HAL Id: hal-01611997
https://hal.archives-ouvertes.fr/hal-01611997
Submitted on 11 Jan 2019
HAL is a multi-disciplinary open access
archive for the deposit and dissemination of
sci-entific research documents, whether they are
pub-lished or not. The documents may come from
teaching and research institutions in France or
abroad, or from public or private research centers.
L’archive ouverte pluridisciplinaire HAL, est
destinée au dépôt et à la diffusion de documents
scientifiques de niveau recherche, publiés ou non,
émanant des établissements d’enseignement et de
recherche français ou étrangers, des laboratoires
publics ou privés.
Unified isothermal and non-isothermal modelling of neat
PEEK crystallization
Emeline Bessard, Olivier de Almeida, Gérard Bernhart
To cite this version:
Emeline Bessard, Olivier de Almeida, Gérard Bernhart. Unified isothermal and non-isothermal
mod-elling of neat PEEK crystallization. Journal of Thermal Analysis and Calorimetry, Springer Verlag,
2014, 115 (2), p. 1669-1678. �10.1007/s10973-013-3308-8�. �hal-01611997�
Unified isothermal and non-isothermal modelling of neat PEEK
crystallization
Emeline Bessard •Olivier De Almeida•
Ge´rard Bernhart
Abstract A differential generalized Avrami’s law is used
to model crystallization kinetic of PEEK in considering that PEEK crystallization results from the contribution of two distinct mechanisms. The form of this equation allows to predict with good accuracy both isothermal and non-isothermal crystallization kinetics. Nevertheless, isother-mal model parameters are not entirely satisfactory for predicting non-isothermal crystallization and the identifi-cation of kinetic parameters is needed for both isothermal and non-isothermal cases. The results show that the Avrami exponents and Arrhenius activation energies remain con-stant for both conditions and therefore suggest that these parameters are only material dependent. On the other hand, the other kinetic parameters depend on the crystallization condition and vary with temperature and/or cooling rate.
Keywords PEEK ! Crystallization ! Kinetic
modelling! Differential scanning calorimetry (DSC)
Introduction
In the field of thermoplastic composite materials, PEEK is an interesting alternative to conventional epoxy matrices used in aeronautical industry because of its higher impact resistance and chemical compatibility to aeronautical
fluids. Nevertheless a high degree of crystallinity (over
35 mass%) must be guaranteed to ensure optimal
mechanical performances [1, 2]. In order to increase the
use of such materials in structural application new rapid manufacturing processes are under investigation like the thermo-compression of powdered or commingled fabrics,
using induction heated die technology [3].
The understanding of the physicochemical phenomena of polymer crystallization allows a better control and
optimisation of industrial processes. Therefore, the
improvement of simulation possibilities has motivated large developments of crystallization models for semi-crystalline polymers, and many extensions of Avrami’s crystallization law were proposed to accurately describe this material transformation.
The work of J. W. Gibbs, based on a classical
thermo-dynamical concept, extended by Turnbull and Fischer [4]
and later by Hoffman and Lauritzen [5] to polymer has first
allowed to justify the crystallization of semi-crystalline thermoplastic as a two main step process: nucleation and crystal growth. Models based on Avrami equation provide a well prediction of crystallization but are in general lim-ited to isothermal crystallization.
Nakamura [6] and Ziabicki [7] extended the Avrami
equation to predict non-isothermal crystallization kinetics
using isothermal transformation data. Ozawa [8] also
pro-posed another extension of Avrami model where kinetic parameters depend on cooling rate. Nevertheless, even if they provide good correlations with experimental data, these models are still limited to uniform cooling rate conditions. In order to describe complex cooling paths, Patel and Sprueill
[9] first proposed a differential form of the Nakamura model
that is more compatible and useful for thermal modelling
[10]. This differential form was also used by Malkin et al.
[11] who assumed that the crystallization rate is the sum of
E. Bessard! O. De Almeida (&) ! G. Bernhart
Institut Cle´ment Ader (ICA), Universite´ de Toulouse, Mines Albi, Campus Jarlard, Route de Teillet, 81013 Albi Cedex 09, France
e-mail: [email protected] URL: http://www.institut-clement-ader.org/
two differential forms respectively related to nucleation and crystal growth. Polymer crystallization was mostly mod-elled by these various approaches. Nevertheless, they are no longer accurate when polymers exhibit unusual crystalliza-tion behaviour.
Among the different thermoplastics, poly-ether-ether-ketone (PEEK) can exhibit multiple melting peaks depending on the cooling conditions, which confirm that classical models may be inaccurate to predict crystalliza-tion kinetics.
In particular, a double melting peak appears when crystallization occurs at high temperature (isothermal conditions) or at low cooling rates. The main melting peak corresponds to the classical theory of nucleation and sub-sequent crystal growth, and the corresponding crystalliza-tion is very well described by classical macroscopic laws of
Avrami, Tobin, Malkin Urbanovici–Segal [12].
The origin of the secondary melting peak is however still discussed. One of the interpretation, reported by Lee
and Porter and by Blundell and Osbourn [13,14], supposes
that the crystals with the low melting temperature form first and then transform into another crystal structure showing a higher melting temperature during annealing or heating.
However, the results of a previous work argue in favour of two melting peaks coming from separate populations of crystals, the higher melting peak related to the primary crystals and the lower melting peak to secondary crystals
which may grow between the original crystals [15]. This
point of view of PEEK crystallization agrees with the description proposed by many authors and this paper considers this explanation as a starting point for the present
work [15–19].
Therefore, as long as two distinct phases are considered, the fusion enthalpy related to this secondary peak signifi-cantly increases the absolute degree of crystallinity of PEEK. Models able to predict this complex crystallinity
rate of PEEK are thus required. Velisaris and Seferis [20]
first proposed a new model for isothermal crystallization of PEEK: they combined two standard Avrami models to take into account two competing crystallization processes. Cebe later extended this approach to non-isothermal conditions
using an Hoffman–Lauritzen approach [21].
Compared to previous work, this paper proposes an unified modelling based on a double differential JMA model that is adapted to the kinetic modelling of neat PEEK crystallization and suitable for the prediction of both isothermal and non-isothermal crystallization kinetics. Special emphasis is put on model parameters identification. The identified parameters are then discussed as long as this double differential JMA model well describes the crystal-lisation process of two populations that is reported in the
literature [15–19].
Experimental investigation of PEEK crystallization Materials and experiments
The material under investigation is a PEEK provided by Victrex as a powder with the reference 151G. The crys-tallization kinetics were studied by differential scanning calorimetry (DSC) with a Perkin-Elmer 8000 equipment. The DSC sealed caps were prepared with 1–1.5 mg of PEEK powder. This low mass allowed considering negli-gible heat transfer effects when applying cooling rates up
to 100 K min-1. Moreover, in order to start cooling from a
nuclei-free melt, the samples were systematically heated
from room temperature to 400!C and held for 5 min in the
molten state.
Isothermal crystallization conditions were achieved by
quickly cooling the sample at 200!C min-1 from the
molten state to isothermal crystallization temperature (Tiso). The sample was then kept at Tiso for 15 min and cooled again quickly to room temperature. Non-isothermal crystallization conditions were carried out using constant
cooling rates between 3 and 100!C min-1. For each test
condition, the transformation rate was assessed from the crystallization heat flux by the partial area method.
All the crystallized samples were subjected to a heating
ramp of 10!C min-1from room temperature to 400!C to
determine the mass fraction crystallinity in considering a
reference enthalpy of fusion of 130 J g-1[22].
Isothermal crystallization results
Eight isothermal temperatures were investigated between
290 and 310!C. Repeatability was ensured by performing
three tests for each temperature (except for 290!C).
The relative mass crystallinity is plotted as a function of
time in Fig.1for four different temperatures. It can be seen
that PEEK crystallization is a continuous process: no sudden changes or discontinuities are discernible in the curves. The sigmoidal shape is characteristic of the overall crystallization of all homopolymers and reveals evidence of nucleation and growth processes.
The crystallization duration depends on testing temper-ature. For an equivalent transformation rate, the lower the temperature, the higher the crystallization kinetic is, i.e. if
crystallization at 310!C occurs within 6 min this duration
drops to\1 min at 300 !C.
Figure2 illustrates the endothermic curves of polymer
fusion measured after isothermal crystallization at 302 and
305!C: the PEEK fusion systematically displays a double
peak already reported in the literature [15,16,23,24]. The
main melting peak temperature is 343!C whatever
iso-thermal temperature investigated during the cooling stage. It corresponds to the fusion of the orthorombic crystalline
phase of PEEK and it is assumed to be the main melting
temperature afterwards called Tm1[20,21]. The maximum
temperature of the secondary melting peak, afterwards
called Tm2, appears at lower temperature. As already
observed for example by Tan et al. [22], this peak is
con-sistently 6–7!C above the temperature of the isothermal
crystallization step. For example, an isothermal
crystalli-zation at 305!C induces a secondary melting peak at
312!C.
Insofar we consider the two melting peaks as coming from separate populations of crystals, this low temperature peak must be taken into consideration when calculating the
total degree of crystallinity Xm. Under such condition, the
procedure consists in performing a deconvolution of the peaks and to consider two different reference enthalpies of fusion when calculating the degree of crystallinity.
This procedure is, however, not necessary for PEEK. Indeed, WAXS experiments performed in a previous study
on PEEK samples demonstrated that both crystal
populations correspond to the same crystalline structure
[14]. As a consequence, an identical enthalpy of fusion for
both phases can be assumed, which agrees with the
meth-odology used by many authors [17].
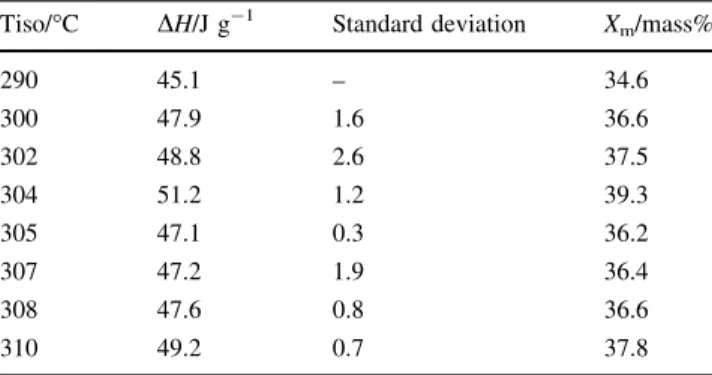
Table1 summarises the enthalpy of fusion and the
resulting degree of crystallinity obtained for the eight dif-ferent test conditions. Taking this double peak into account ensures a large degree of crystallinity, above 34 mass% for
all investigated test conditions as shown in Table1, and an
isothermal step at 304!C leads to the highest degree of
crystallinity of 39 mass%. Moreover, the estimated Stan-dard Deviation of the three different tests is low and con-firms the methodology used.
Non-isothermal crystallization results
The total enthalpy of fusion and resulting degree of crys-tallinity measured for the nine constant cooling rates
investigated between -3 and -100!C min-1are reported
in Table2. The results are consistent with the influence of
cooling rate reported for all homopolymers, i.e. when cooling rate increases the amount of crystallinity decreases. For all investigated configurations, the values are lower than after isothermal conditions and the lowest value is
26 mass% for -100!C min-1.
Relative crystallinity curves are plotted in Fig.3 for
increasing cooling rates. As reported for isothermal crys-tallization, the variation exhibits a sigmoidal shape with a maximal crystallization rate at half-time crystallization.
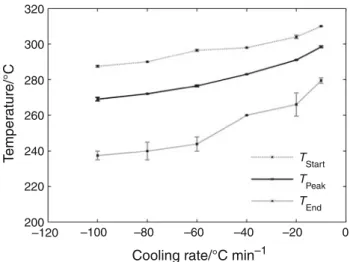
Figure3also shows that the temperatures of crystallization
start (Tstart), peak (Tpeak) and end (Tend) are strongly
dependent on the cooling conditions. As shown in Fig.4,
crystallization occurs between 310 and 240!C and all
these three temperatures decrease when increasing cooling
rate whereas the crystallization rangeDTcrysincreases. For
instance, Tstart (resp. DTcrys) moves from 307!C (resp
32!C) at -10 !C min-1 to 287!C (resp 47 !C) at
-100!C min-1. Error bars indicate that if start and
peak temperatures are reproducible, crystallization end
1.0 0.8 0.6 0.4 0.2 0.0 0 1 2 3 4 5 6 Time/min Relativ e cr ystallinity 300 °C 305 °C 307 °C 310 °C
Fig. 1 Isothermal crystallization kinetics
1.5 1.0 0.5 0.0 100 150 200 250 300 350 400 Temperature/°C Heat flo w (endo up)/mW 302 °C 305 °C
Fig. 2 DSC melting curves of neat PEEK crystallized at 302 and 305!C
Table 1 Enthalpies of fusion and degree of crystallinity for different isothermal crystallization temperatures
Tiso/!C DH/J g-1
Standard deviation Xm/mass%
290 45.1 – 34.6 300 47.9 1.6 36.6 302 48.8 2.6 37.5 304 51.2 1.2 39.3 305 47.1 0.3 36.2 307 47.2 1.9 36.4 308 47.6 0.8 36.6 310 49.2 0.7 37.8
temperature fluctuates around the average value with an
amplitude of 5 !C.
The melting curves resulting from cooling at -3, -10
and -60 !C min-1are displayed in Fig.5. In opposition to
isothermal crystallization, only a single melting peak appears for high cooling rates. It corresponds to the main peak observed previously at the same temperature of
343 !C and designated as Tm1. However, on melting curves
of slowly cooled samples (\10 !C min-1
), a shoulder is observable at the beginning of fusion and indicates that a secondary mechanism contributes to crystallization.
Kinetic modelling and identification Kinetic model description
The isothermal crystallization kinetics are usually studied
using Avrami’s law wherea(t) is the relative crystallinity
as a function of time t, X(t) is the crystallised fraction at time t and X(") is the volume crystalline fraction for
infinite time at temperature T [25]. Applied to polymers, the exponent n (Avrami exponent) contains some
infor-mation about the type of nucleation while K characterizes
the crystallization growth rate (s-1) and depends on the
isothermal testing temperature.
a tð Þ ¼XX tð Þ
1
ð Þ¼ 1 % e
%Ktn
ð1Þ
Generally, for studying the non-isothermal
crystallization kinetics, Nakamura or Tobin models based
on the Avrami’s law, where K (s-n) depends on cooling
rate, are used [4,26,27]. These models give a very good
correlation with experiments; nevertheless they cannot describe simultaneously isothermal, non-isothermal or complex cooling paths. Their application is thus limited to monotonic cooling conditions.
In order to model isothermal and non-isothermal poly-mer crystallization kinetics with a unique model, the JMA
(Jonhson–Mehl–Avrami) equation is used (Eq.2) [27].
Table 2 Enthalpies of fusion and degree of crystallinity for different cooling rates
Cooling rate/!C min-1
DH/J g-1 Xm/mass% -3 47.4 36.5 -5 46.0 35.4 -7 44.1 33.9 -10 37.4 28.8 -20 37.6 28.9 -40 36.8 28.3 -60 37.8 29.1 -80 34.8 26.7 -100 33.8 26.0 1.0 0.8 0.6 0.4 0.2 0.0 340 320 300 280 260 240 220 200 Temperature/°C Relativ e cr ystallinity 3 °C min–1 7 °C min–1 10 °C min–1 20 °C min–1 40 °C min–1 60 °C min–1 80 °C min–1 100 °C min–1
Fig. 3 Non-isothermal crystallization kinetics of neat PEEK
320 300 280 260 240 220 200 –120 –100 –80 –60 –40 –20 0
Cooling rate/°C min–1
Temper
ature/°C
TStart TPeak TEnd
Fig. 4 Variation of characteristic crystallization temperatures with cooling rate 4.5 4.0 3.5 3.0 2.5 2.0 1.5 1.0 0.5 0.0 –0.5 300 350 400 Temperature/°C Heat flo w (endo up)/mW –60 °C min–1 –10 °C min–1 –3 °C min–1
Fig. 5 DSC melting curves resulting from crystallization at different constant cooling rates (-3, -10 and -60!C min-1)
This form, based on the generalized form of the Avrami
equation (Eq.3), was first introduced for polymers by Patel
and Sprueill and used later by different authors [7,28]. It
allows in principle the prediction of non-isothermal crys-tallization using isothermal data.
a! ¼ nK 1 % a tð ð ÞÞln 1 1 % a tð Þ ! "n%1 n ð2Þ a tð Þ ¼XX tð Þ 1 ð Þ¼ 1 % e % Ktð Þn ð3Þ
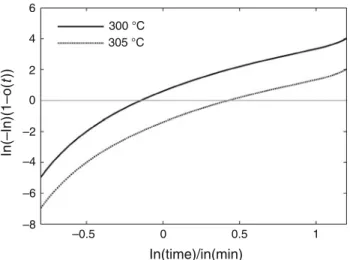
Referring to applicability of JMA model discussed by Malek, it appears that this simple modelling approach is
not consistent with experimental results [27]. As a matter
of fact Fig.6 shows no linearity when plotting the double
logarithmic plot ln ln 1% Xmð Þt
Xmð Þ1
# $
# $
versus ln(t), in particular for isothermal condition or slow cooling rates
(\10 !C min-1
) for which a secondary mechanism contribution is observed (double melting peak).
Velisaris and Seferis, Cebe and Wei observed similar behaviour in indicating two typical slopes initially equal to
2.5 and changing to 1.5 [20,21,24]. This bilinear
behav-iour was related by Velisaris and Seferis to be a conse-quence of the existence of two parallel crystallization mechanisms: the first main crystallization was associated to
the main endothermic melting peak Tm1, whereas the
sec-ond was associated to a secsec-ondary crystallization
corre-sponding to the minor endothermic peak Tm2 (Fig.2).
In order to consider the simultaneous contribution of two complementary mechanisms and using the time
inde-pendent Eq.2, the total crystallization rate can be modelled
with Eq.4 where i = 1 (resp. i = 2) corresponds to main
(resp. minor) crystallization mechanism. Each crystalliza-tion process is associated to a weighting factor,
respec-tively w1and w2, with w1? w2= 1.
a! ¼X 2 i¼1 wia ! i ¼ X2 i¼1 winiKið1% aið Þt Þ ln 1 1% aiðtÞ ! "ni%1 ni ð4Þ Isothermal identification
Previous crystallization model using two competing mechanisms requests the identification of five parameters
w1, K1, K2, n1, n2. Identification was performed using a
numerical optimisation procedure developed in Matlab#; it
compares isothermal DSC results with the numerical
inte-gration of Eq.4 using Runge–Kutta method. Because
mechanism 1 is related to the main crystallization process,
upper and lower bounds of w1were set respectively to 1
and 0.5 but n1, n2, K1and K2parameters were considered
free during optimisation.
As reported in Table3, the procedure leads to
repro-ducible results, indicating a stable optimization procedure. Moreover, the values of the different parameters agree with the literature: the order of magnitude of crystallization
kinetic parameters K1 and K2 is similar to the those
reported by Velisaris or Cebe, and n1and n2are
respec-tively close to 2.1 and 1.7, i.e. between the upper and lower
bounds of 1 and 4 suggested by the Avrami theory [20,21].
6 4 2 0 –2 –4 –6 –8 –0.5 0 0.5 1 In(time)/in(min) In(–In)(1–o( t)) 300 °C 305 °C
Fig. 6 Avrami crystallization plot for isothermal crystallization of neat PEEK at 305!C
Table 3 Results of isothermal kinetic model parameter identification
T/!C n1 n2 K1/910-2 K2/910-2 w1 Standard deviation K1/910-4 K2/910-4 w1 290 2.10 1.70 6.00 1.5 0.98 – – – 300 2.10 1.70 3.13 1.47 0.95 5.25 4.08 0.00 302 2.10 1.69 2.32 1.30 0.95 3.30 13.6 0.00 304 2.09 1.70 1.60 1.03 0.93 0.00 6.00 0.03 305 2.10 1.70 1.50 0.89 0.89 0.00 10.0 0.00 307 2.10 1.70 1.09 0.70 0.82 2.50 1.00 0.04 308 2.10 1.68 1.05 0.75 0.76 11.10 13.6 0.09 310 2.10 1.70 0.82 0.63 0.84 0.25 3.00 0.04
Indeed, the exponents n1 and n2 are found constant,
whatever the testing temperature between 290 and 310 !C
(n1= 2.1 and n2= 1.7). The n exponent that is
charac-teristic of crystallization type (nucleation and growth) would thus not be influenced by temperature.
Contrary to the Avrami exponent, as Table 3indicates,
the weighting factor w1 varies according to isothermal
temperature: in increasing temperature from 290 to 308 !C,
w1decreases from 0.98 to 0.76. It indicates that the main
crystallization process has a strong contribution on total crystallization but also that the contribution of secondary crystallization mechanism is more important when tem-perature is high (where crystallization kinetic is low).
Kinetic parameters K1and K2are largely influenced by
temperature as well, but the sensitivity of parameter Ki
with respect to temperature is more important than for K2:
K1(resp. K2) decreases from 6 9 10-2(resp. 1.5 9 10-2)
to 0.82 9 10-2 (resp. 0.63 9 10-2) when increasing
tem-perature of isothermal crystallization from 290 to 310 !C.
Moreover, the identified values reveal that kinetic
param-eter K1is always higher than K2, even if both parameters
exhibit a same order value at high temperature.
Kið Þ ¼ AT iexp %
Ei
R Tð m% TÞ
! "
ð5Þ
The temperature dependence of kinetic parameters K1and
K2 can be modelled with an Arrhenius law assuming that
crystallization is thermally activated. In Eq.5 the kinetic
parameters are expressed as a function of the surfusion
Tm- T, in considering a melting temperature Tmof 343!C.
Each kinetic parameter Kiis characterized by an activation
energy Ei(J mol-1) and a pre-exponential factor (Ai).
The identified values of Ei and Ai are reported in
Table4, and the Arrhenius models calculated with these
values are displayed in Fig.7. One can see that the model
shows a good fitting with experimental values. Both acti-vation energies and pre-exponential factors are in good
agreement with the respective decrease of K1 and K2.
Indeed, the pre-exponential factor Aithat relates the order
of magnitude of the mechanism kinetic is greater for mechanism 1, which kinetic is faster. Similarly, the fact
that E1[ E2is not surprising, since the activation energy
reflects the sensitivity to surfusion and therefore to tem-perature. Furthermore, it can be noticed that the activation
energy of the main mechanism E1 is close to the value
previously reported by Cebe [29].
Figure8show the good correlation between experiment
and modelling for two temperatures 305 and 310!C. For
both crystallization temperatures, the main first mechanism
related as a1 occurs in the early stage of crystallization,
while secondary mechanism a2 is delayed and its
contri-bution to crystallization becomes substantial just beforea1
reaches its maximal contribution. In isothermal conditions, the first mechanism thus largely influences the first part of the S-shape curve while the second one has major influence on the end of crystallization kinetics. The consequence is the dissymmetry of the sigmoidal kinetic curve as reported in the experimental section.
Non-isothermal modelling
In a first attempt, isothermal data were used to simulate isothermal crystallization of PEEK. For this purpose, a
non-Table 4 Constant Arrhenius parameters identified for each crystal-lization mechanism of neat PEEK
Mechanism 1 Mechanism 2 Ei/J mol-1 1,316 1,050 Ai 0.91 0.26 3.5 3.0 2.5 2.0 1.5 1.0 0.5 0.0 2.2 2.4 2.6 2.8 3.0 1/(Tm–T)/ × 10–2 K–1 Kinetic par ameters/ × 10 –2 K1 K2 Model K2 Model K1
Fig. 7 Variation of kinetic parameters K1 et K2 as a function of
temperature 1.0 0.8 0.6 0.4 0.2 0.0 0 50 100 150 200 250 300 350 Time/s Relativ e cr ystallinity 305 °C 310 °C Exp Tot w1 1 α α α w2 α2
Fig. 8 Kinetic simulations of isothermal crystallization at 305 and 310!C
isothermal numerical integration procedure was developed
in Matlab#: the cooling curve is adequately approximated
by a series of isothermal steps and the Runge–Kutta inte-gration is used during each step. The variation of relative crystallization is calculated by the summation of trans-formed fraction during each elementary step.
Numerical results for a constant cooling rate of
-20!C min-1 are shown in Fig.9 (referenced as without
ILT). The total relative crystallinity evolution is compared with the experimental result and the relative crystallinity contribution of each mechanism is plotted. If general sig-moidal shape is similar to experimental one, the predicted curves overestimate the crystallization kinetics. Indeed, as mentioned on experimental results, crystallization start
temperatures (Tstart) change with non-isothermal cooling
rate. As a matter of fact, nucleation is not instantaneous and an induction lag time (ILT) has to be introduced and considered during modelling.
The cooling rate dependent lag time related to Tstartwas
thus experimentally determined as a linear equation TSTART ¼ 0:236 &dTdt þ309:87, and implemented in the
model to re-simulate non-isothermal crystallization kinet-ics. Thanks to this modification, simulation results are quite in good agreement with experimental curves, in particular
for -20!C min-1 cooling (Fig.9), but this procedure is
still not effective for other conditions as shown for example
in Fig.10 for -60!C min-1. Moreover, for all these
cooling rates, the model predicts a significant contribution
of the minor mechanism (a2) whereas experimental
observations do not exhibit a distinct secondary melting
peek (Tm2) as shown in Fig.5.
In order to improve model capabilities, a non-isothermal kinetic parameter identification was performed using the
Matlab#routine previously described and combined with an
optimization procedure. Considering that nucleation and
growth mechanisms are only material dependent and do not
depend on crystallization conditions, i.e. that values of n1and
n2are fixed, the five parameters E1and E2(activation
ener-gies), A1and A2(pre-exponential factors) and w1(weighting
factor of the first mechanism) were identified for all testing
conditions (cooling rates from -3 up to -100!C min-1).
Results reported in Table5 show that whatever the
cooling rate, the activation energies of both mechanisms remain constant and equal to those obtained during the isothermal identification. On the contrary, slow cooling
rates (\10 !C min-1) have a strong influence on kinetic
parameters A1and A2, and surprisingly in such conditions,
values of A1are higher than those obtained in isothermal
conditions (cf. Table4). Moreover mechanism 2 becomes
preponderant in such conditions, i.e. up to 60 % for
-3!C min-1, indicating that slow cooling rates favours
the development of both crystallite types.
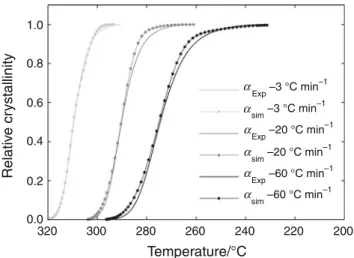
Comparison between numerical model and experimental results actually show a very good correlation whatever the
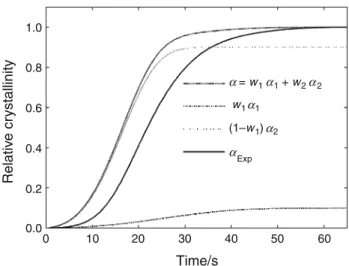
cooling rate (Fig.11). Contribution of each mechanism is
shown in Fig.12for a cooling rate of -3!C min-1: even
1.0 0.8 0.6 0.4 0.2 0.0 320 310 300 290 280 270 Temperature/°C Relativ e cr ystallinity
Tot without ILT
Tot with ILT
w1 1 without ILT w1 1 with ILT w2 2 without ILT w2 2 with ILT Exp α α α α α α α
Fig. 9 Kinetic simulation of non-isothermal crystallization -20!C min-1with and without considering an induction lag time (ILT)
1.0 0.8 0.6 0.4 0.2 0.0 0 10 20 30 40 50 60 Time/s Relativ e cr ystallinity = w1 1 + w2 2 w1 1 (1–w1) 2 Exp α α α α α α
Fig. 10 Kinetic simulation of non-isothermal crystallization at -60!C min-1
Table 5 Kinetic parameters for constant cooling rates Cooling rate/K min-1 E1/J mol-1 E2/J mol-1 A1 A2 w1 3 1315.7 1050.0 1.60 0.20 0.4 5 1315.3 1050.0 1.04 0.18 0.64 7 1316.1 1049.2 1.00 0.26 0.68 10 1316.0 1050.0 0.63 0.16 0.79 20 1315.8 1049.1 0.64 0.20 0.88 40 1316.0 1049.3 0.68 0.20 0.93 60 1316.0 1050.0 0.63 0.16 0.97 80 1315.9 1050.0 0.68 0.18 0.97 100 1315.7 1049.1 0.68 0.16 0.96
if mechanism 1 starts first, its contribution to final crys-tallinity is less important than mechanism 2 (only 40 %) which is quite different from isothermal crystallization where mechanism 1 is always preponderant.
Discussion
The here-proposed model supposes that PEEK crystalli-zation is governed by two competing crystallicrystalli-zation mechanisms satisfying the Avrami equation. Each
mecha-nism is characterised by a ni exponent and a kinetic
parameter Ki, which thermal sensitivity is considered as
Arrhenius type. Using a differential form of the Avrami’s law, the model can predict PEEK crystallization in both isothermal and non-isothermal cooling conditions with good accuracy. Nevertheless, parameters identification
must be performed in both cases otherwise the crystalli-zation prediction is not satisfactory.
Isothermal and non-isothermal identifications lead to the
same values of n1, n2, E1 and E2. On one hand, this
important result upholds the choice of two complementary mechanisms to model PEEK crystallization process, and, on the other hand, confirms that these parameters are only material dependent and do not depend on thermal condi-tions. According to Avrami’s theory, the n exponent characterises the kind of nucleation (homogeneous or het-erogeneous), and the growth geometry (one-, two-, or
three-dimensional growth). Mechanism 1, which n1
expo-nent is 2.1, would then induce crystallization with larger
dimensionality than mechanism 2, which n2 exponent is
only 1.7. Regarding an homogeneous nucleation, such a low n exponent refers to a one-dimensional crystal growth and such growth is generally depicted as ‘toothpicks placed on a water surface in increasing concentration’. This dif-ference of mechanisms dimensionality agrees with the dual crystallization process described by Verma et al. or
Lat-immer et al. [15,16] as a classical crystal nucleation and
lamellae growth associated to mechanism 1 and an inter-lamellar phase associated to mechanism 2. Such a description, however, suggests a radical dimension differ-ence between both crystals growth mechanisms that the identified n exponents do not clearly confirm.
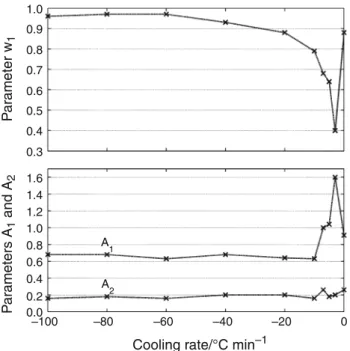
Results also show that the weighting factor w1 and
crystallization kinetics Kiare the only
temperature-depen-dent parameters governing PEEK crystallization.
Parame-ters identification reveals that A1 and A2remain constant
during isothermal crystallization but are influenced by the
cooling rate. The A1(resp. A2) parameter decreases from
1.6 (resp. 0.2) to 0.68 (resp. 0.16) when increasing cooling
rate from -3 to -100!C min-1(Fig.13), indicating that
mechanism 1 is thus much faster than mechanism 2 whatever the cooling condition. Similarly, identification of
weighting factor w1systematically leads to different values
and is both influenced by temperature and cooling rate. But beyond the large sensitivity of these three parameters, the comparison between non-isothermal and isothermal values displays contradictory effects.
Indeed, an isothermal crystallization condition could be considered as a lower limit of cooling rate and continuity could be expected between the values of isothermal iden-tification and the values resulting from non-isothermal identification at low rate. Instead, the non-isothermal ana-lysis reveals that mechanism 2 becomes the major
crys-tallization process at low cooling rate (w1= 0.4 for
-3!C min-1) (Fig.13) whereas isothermal results suggest
that mechanism 1 widely remains the predominant
crys-tallization process (Fig.8).
In the same way, isothermal identification of A1and A2
leads to values corresponding to a -7!C min-1 cooling
1.0 0.8 0.6 0.4 0.2 0.0 320 300 280 260 240 220 200 Temperature/°C Relativ e cr ystallinity Exp–3 °C min–1 Exp–20 °C min–1 Exp–60 °C min–1 sim–60 °C min–1 sim–20 °C min–1 sim–3 °C min–1 α α α α α α
Fig. 11 Comparison of experimental crystallization data with model prediction for three cooling rates
1.0 0.8 0.6 0.4 0.2 0.0 0 100 200 300 400 500 600 Time/s Relativ e cr ystalinity = w1 1 + (1–w1) 2 Exp (1–w1) 2 w1 1 α α α α α α
Fig. 12 Mechanisms contribution for -3!C min-1
rate and the continuity is not respected. As it can be seen in
Fig.3, -7!C min-1 crystallization occurs between 310
and 290!C which exactly corresponds to the temperature
range of the isothermal crystallization study. This let us
suppose that A1 and A2 parameters may not necessarily
depend only on the cooling rate but maybe also on the temperature range in which the crystallization occurs.
Otherwise, the testing method for isothermal crystalli-zation study assumes that the previous rapid cooling step
performed at -200!C min-1 does not influence
isother-mal PEEK Crystallization. Yet, this strong assumption must be reconsidered with regards to the contradictory values of the identified parameters. Indeed, even if DSC signal do not exhibit any crystallization enthalpy during this step, it may be possible that nucleation of mechanism 1 is initiated during cooling, which would favours mecha-nism 1 to occur during the isothermal step. This assumption is coherent with the weighting factor observed for high cooling rates: non-isothermal crystallization at constant
cooling rate of -100!C min-1leads to a weighting factor
of 0.96. This inconsistency between isothermal and non-isothermal parameters is probably heightened for a poly-mer like PEEK that crystallizes very rapidly. As a conse-quence to improve further crystallization model it would be interesting to introduce a cooling rate nucleation model for mechanism 1, able to initiate the more or less growth of mechanism 1 crystallite types.
Finally, if high temperature (i.e. isothermal or low cooling rate) favours mechanism 2 to occur, the resulting crystalline structure still exhibits a low melting temperature
(Tm2). Yet, both mechanisms lead to the same crystalline
form and it thus suggests that both mechanisms are related.
Conclusions
The use of differential form of Avrami equation and con-sidering that PEEK crystallization is induced by two complementary mechanisms has allowed to model with good accuracy non-isothermal and isothermal PEEK crys-tallization even if identification of model parameters must be performed in both conditions. If crystallization type is a material property, as denoted by the stability of the Avrami
exponents ni and activation energies Ei whatever
crystal-lization condition, the weighting factor w1and the
Arrhe-nius parameters A1 and A2 are largely influenced by
thermal conditions. Moreover, both identifications lead to different trends suggesting that nucleation occurs during the rapid cooling prior to the isothermal step and therefore influences isothermal crystallization.
The whole set of results (double melting peak, non-isothermal parameters, dissymmetry of the S-shape relative crystallinity) thus indicates that the secondary mechanisms is favoured for slow cooling rates and isothermal crystal-lization, while main crystallization mechanisms contribu-tion, even if this mechanism appears to be a faster phenomenon, increases with increasing the cooling rate.
Finally, this study also raises a new issue about how isothermal crystallization can be characterized experi-mentally for polymers that exhibit rapid crystallization, since isothermal crystallization is controlled by previous nucleation that may appear during the rapid cooling step. Acknowledgements This work was carried out as part of the cooperative INMAT2 project and was financially supported by the Fond Unique Interministe´riel. The authors wish to thank the project partners for their contribution to the present work. Further thanks are addressed to the technicians of the Institut Cle´ment Ader for their assistance in the experiments.
References
1. Gao SL, Kim JK. Cooling rate influences in carbon fibre/PEEK composites. Part 1. Crystallinity and interface adhesion. Comp Part A. 2000;31:517–30.
2. Gao SL, Kim JK. Cooling rate influences in carbon fibre/PEEK composites. Part III: Impact damage performance. Comp Part A. 2001;32:775–85.
3. Rudolf R, Mitschang P, Neitzel M. Induction heating of contin-uous carbon-fibre-reinforced thermoplastics. Comp Part A. 2000;31:1191–202.
4. Turnbull D, Fisher JC. Rate of nucleation in condensed systems. J Chem Phys. 1949;17:71–3.
5. Hoffman JD, Lauritzen JI. Crystallization of bulk polymers with chain folding—theory of growth of lamellar spherulites. J Res Nat Bur Stand. 1961;65A:297–336.
1.0 0.9 0.8 0.7 0.6 0.5 0.4 0.3 1.6 1.4 1.2 1.0 0.8 0.6 0.4 0.2 0.0 –100 –80 –60 –40 –20 0
Cooling rate/°C min–1
P ar ameters A 1 and A 2 P ar ameter w 1 A1 A2
Fig. 13 Non-isothermal and isothermal (cooling rate = 0) kinetic model parameters
6. Nakamura K, Watanabe T, Katayama K. Some aspects of non-isothermal crystallization of polymers. I. relationship between crystallization temperature, crystallinity, and cooling conditions. J Appl Polym Sci. 1972;16:1077–91.
7. Ziabicki A. Theoretical analysis of oriented and non-isothermal crystallization. Colloid Polym Sci. 1974;252:433–47.
8. Ozawa T. Kinetics of non-isothermal crystallization. Polymer. 1971;12:150–8.
9. Patel RM, Sprueill JE. Crystallization kinetics during polymer processing: analysis of available approaches for process model-ing. Polym Eng Sci. 1991;31:730–8.
10. Le Goff R, Poutot G. Study and modeling of heat transfer during the solidification of semi-crystalline polymers. Int J Heat Mass Tran. 2005;48:5417–30.
11. Malkin AY, Beghishev VP, Keapin IA. General treatment of poly-mer crystallization kinetics. Part I. A new macrokinetic equation and its experimental verification. Polym Eng Sci. 1984;24:1396–401. 12. Supaphol P. Application of the Avrami, Tobin, Malkin and
Ur-banovici–Segal macrokinetic models to isothermal crystallization of syndiotactic polypropylene. Thermochim Acta. 2001;370:37–48. 13. Lee Y, Porter RS. Double-melting behavior of poly(ether ether
ketone). Macromolecular. 1987;20:1336–41.
14. Blundell DJ, Osborn BN. The morphology of poly(aryl-ether-ether-ketone). Polymer. 1983;24:953–8.
15. Latimmer MP, Hobbs JK, Hill MJ. On the origin of the multiple endotherms in PEEK. Polymer. 1992;33:3971–3.
16. Verma RK, Velikov V, Kander RG. SAXS studies of lamellar level morphological changes during crystallization and melting in PEEK. Polymer. 1996;37:5357–65.
17. Bessard E, De Almeida O, Bernhart G. Melt state behaviour of PEEK and processing window interpretation for fast compression moulding process. In: Chinesta F, Chastel Y, El Mansori M, editors. AIP conference proceedings. Paris: AMPT; 2011.
18. Cheng SZD, Cao MY, Wunderlich B. Glass transition and melting of PEEK. Macromolecular. 1986;19:1868–76.
19. Basset DC, Olley RH, Al Raheil IAM. On crystallization phe-nomena in PEEK. Polymer. 1988;29:1745–54.
20. Velisaris C, Seferis J. Crystallization kinetics of polyethere-therketone (PEEK) matrices. Polym Eng Sci. 1986;26: 1574–81.
21. Cebe P. Application of the parallel Avrami model to crystalli-zation of PEEK. Polym Eng Sci. 1988;28:1192–7.
22. Tan S, Su A, Luo J. Crystallization kinetics of poly(ether ether ketone) (PEEK) from its metastable melt. Polymer. 1999; 40:1223–31.
23. Chao SC, Chen M, Chung CT. Isothermal crystallization and melting behavior of short carbon fiber reinforced poly(ether ether ketone) composites. J Polym Res. 1998;5:221–6.
24. Wei CL, Chen M, Yu FE. Temperature modulated DSC and DSC studies on the origin of double melting peaks in poly(ether ether ketone). Polymer. 2003;44:8185–93.
25. Avrami M. Kinetics of phase change. I general theory. J Chem Phys. 1939;7:1103–12.
26. Supaphol P, Spruiell JE. Application of the Avrami, Tobin, Malkin and simultaneous Avrami macrokinetic models to iso-thermal crystallization of syndiotactic polypropylenes. J Macro-mol Sci. 2000;39:257–77.
27. Malek J. Kinetic analysis of crystallization processes in amor-phous materials. Thermochim Acta. 2000;355:239–53.
28. Trende A, Astrom BT, Wo¨ginger A. Modelling of heat transfer in thermoplastic composites manufacturing: double-belt press lam-ination. Comp Part A. 1999;30:935–43.
29. Cebe P. Non-isothermal crystallization of poly(ether ether ketone) aromatic polymer composite. Polym Comp. 1988;9: 271–9.