HAL Id: hal-02468778
https://hal.inria.fr/hal-02468778
Submitted on 6 Feb 2020
HAL is a multi-disciplinary open access
archive for the deposit and dissemination of
sci-entific research documents, whether they are
pub-lished or not. The documents may come from
teaching and research institutions in France or
abroad, or from public or private research centers.
L’archive ouverte pluridisciplinaire HAL, est
destinée au dépôt et à la diffusion de documents
scientifiques de niveau recherche, publiés ou non,
émanant des établissements d’enseignement et de
recherche français ou étrangers, des laboratoires
publics ou privés.
Toward Visual Interactive Exploration of Heterogeneous
Graphs
Irène Burger, Ioana Manolescu, Emmanuel Pietriga, Fabian Suchanek
To cite this version:
Irène Burger, Ioana Manolescu, Emmanuel Pietriga, Fabian Suchanek. Toward Visual Interactive
Exploration of Heterogeneous Graphs. SEAdata 2020 - Workshop on Searching, Exploring and
An-alyzing Heterogeneous Data in conjunction with EDBT/ICDT, Mar 2020, Copenhagen, Denmark.
�hal-02468778�
Toward Visual Interactive Exploration of Heterogeneous
Graphs
Irène Burger
[email protected] Institut Polytechnique de Paris, Inria
Palaiseau, France
Ioana Manolescu
[email protected] Inria, Institut Polytechnique de ParisPalaiseau, France
Emmanuel Pietriga
[email protected] Univ. Paris-Saclay, CNRS, Inria
Orsay, France
Fabian Suchanek
suchanek@telecom- paris.frTélécom Paris, Institut Polytechnique de Paris Palaiseau, France
ABSTRACT
An interesting class of heterogeneous datasets, encountered for instance in data journalism applications, results from the inter-connection of data sources of different data models, ranging from very structured (e.g., relational or graphs) to semistructured (e.g., JSON, HTML, XML) to completely unstructured (text). Such het-erogeneous graphs can be exploited e.g., by keyword search, to uncover connection between search keywords [1].
In this paper, we present a vision toward making such graphs easily comprehensible by human users, such as journalists seek-ing to understand and explore them. Our proposal is twofold: (i) abstracting the graph by recognizing structured entities; this simplifies the graph without information loss; (ii) relying on data visualization techniques to help users grasp the graph con-tents. Our work in this area continues; we present preliminary encouraging results.
1
INTRODUCTION
Data journalists often have to handle sets of different data struc-tures, which they obtain from official organizations or from their sources, extract from social media, receive via email or create themselves (typically Excel or Word-style) etc. For instance, jour-nalists from the Le Monde newspaper want to retrieveconnections between elected people at Assemblée Nationale and companies that have outposts outside of France; such a query can be answered cur-rently at a high human effort cost, by inspecting e.g. a JSON list of Assemblée elected officials (available from NosDeputes.fr) and manually connecting the names with those found in a national registry of companies. This huge effort may still miss connections that could be found if one added information about politicians’ and business people’s spouses, information sometimes available in public knowledge bases such as DBpedia, or in a journalists’ personal notes.
ConnectionLens heterogeneous graphs. The ConnectionLens project [1] aims to enable journalists towork with data sources as they come, and quickly due to the speed of the news cycle. This precludes the time to understand, analyze, and extract the data into a single unified data model. Instead, in ConnectionLens we consider thatthe data model of a given dataset is “an accident” related to its creation history, and should not be a barrier toward exploiting it.
As no single query language can be used on such heteroge-neous data, ConnectionLens supportskeyword queries, asking for © Copyright 2020 for this paper held by its author(s). Published in the proceedings of SEAData 2020 (March 30, 2020, Copenhagen, Denmark, co-located with EDBT/ICDT 2020) on CEUR-WS.org. Use permitted under Creative Commons License Attribution 4.0 International (CC BY 4.0).
Figure 1: Sample screen shot of ConnectionLens GUI [1] showing an answer to a three-keyword query.
all the connections that exist, in one or across several data sources, between these keywords. This problem has been raised by our col-laboration with Les Décodeurs, Le Monde’s fact-checking team, with whom we collaborate within the ContentCheck research project. The novelty of ConnectionLens search wrt the literature on keyword search in databases is to seek answers which may span overseveral datasets of different data models, with very dif-ferent or even absent internal structure (the latter is true for text data).
For instance, Figure 1 shows an answer to the three-keyword query: {“Macron”, “Kohler”, “Costa”}. Different colors indicate nodes from data sources of different data models ( JSON, RDF and text, respectively); the nodes filled with solid color are those that match the query keywords. Nodes are either derived from the original dataset, e.g., a node for each tuple and attribute from a relational dataset, a node for each map or list in JSON, for each node in an RDF graph etc., or they may beentity occurrences, identified by a Named Entity Recognition module capable for now to identify People, Organizations and Locations. We extract entity occurrences from any text, whether a document or a phrase or a name appearing in a JSON node. The dataset interconnection is materialized by the two red edges labeledsame-asbetween pairs of entity occurrences.
The problem: ConnectionLens graph exploration. While such a raw node-link diagram visualization allows users to find some results in heterogeneous ConnectionLens graphs, the sup-port they provide forexploring and understanding the graph to non-expert users, such as journalists, is quite limited.
(1.) The visualization only shows the answer tree; the full graph is much larger, and a simplenode-link diagram as this one
does not scale beyond a dozen edges, as illustrated on a Con-nectionLens graph1of barely more than 200 edges.This problem is common to any large data graph (not specific to Connection-Lens) [6]. Many techniques have been developed to address this issue, going from a simple navigable node-centric GUI2 for a large RDF knowledge base [7], to more elaborate visualization techniques, e.g., [4].
(2.) While some ConnectionLens nodes are meaningful for human users, e.g., the entity occurrences recognized in Figure 1, others are not, as they merely correspond tointernal containers, such as JSON maps or arrays, relational tuples etc., which do not carry human-understandable significance; examples are the nodes labeled 2|1 and 2|1.3 in the figure. Showing these nodes at the same level, therefore, is not appropriate.This problem is spe-cific to ConnectionLens: it originates in its very goal of connecting information, no matter what format it comes from.
In this paper, we outline a vision for dramatically increasing the usability of ConnectionLens graphs, in particular through novel interactive visualizations based on recent advances in the area of expressive node-link diagram authoring [5] for multi-variate networks [3]. We identified two steps toward realizing that vision: graph abstraction (Section 2), and graph visualization (Section 3).We present some preliminary results, and perspectives for our work.
2
ABSTRACTING CONNECTIONLENS
GRAPHS
We present our analysis of the ways in which ConnectionLens graphs can be simplified, or abstracted, based on a set of obser-vations made by journalists (from Le Monde and TF1) and data journalists / data visualization professionals (from WeDoData, a French company) with whom we shared them.
2.1
Abstraction Principles
We present a set of guiding principles, which we identify by a capital letter to be able to refer to them in the paper.
(A) Entities are interesting. Users want to know who, or what, a given dataset, or multi-dataset graph, is about. It is natural to be interested in people (e.g., a politician or a businessperson), organizations (e.g., an army or a company), or a place (e.g., the city where one lives, or a country such as Panama). Depending on the dataset and the application, of course, other kinds of entities may be considered, e.g., a Web site, a Facebook or Twitter account, a specific kind of organization (e.g., companies from Panama) etc.
(B) Datasets may or may not be interesting. Conceptually, we like to think of “data” as an abstract set of information, say, a large graph. From a practical viewpoint, however, data comes in datasets, which delimit “original subsets” of the global graph. The contours of a dataset are sometimes clear, e.g., a tweet, a Web page, or a speech; in other cases, they are more fuzzy. For instance, if a relational database holds three tables, should we view this as one or three datasets? From a user perspective, one can choose to ignore the datasets (make their boundaries invisible); this may be appropriate, for instance, if in a social network graph, we want to focus just on connections between users and/or hash tags. Al-ternatively, datasets can play a very significant role: (i) if entities co-occurring in a dataset denote an interesting association, e.g., two recipients of the same email; or (ii) if we identify connections
1
http://pages.saclay.inria.fr/ioana.manolescu/DOT- obtained- image.pdf
2https://gate.d5.mpi- inf.mpg.de/webyago3spotlx/SvgBrowser
between users and datasets, e.g., user AlicehasAuthored dataset article1, on which user Bobcommented etc.
(C) Containers are rather uninteresting. Here, containers denote: a table (or set of tuples) if the data is relational, or a JSON array. Intuitively, containers serve to group together several more-or-less comparable “things”, such as albums of a singer, or members of a committee. The container node itself is less useful.
(D) Rich entity nodes are desirable for data exploration. Here, an entity node (EN, in short) denotes an instance of an Entity, in the traditional Entity-Relationship sense known from conceptual design. For instance, “the person François Ruffin, having the birthplace Amiens and the twitter handle @François_Ruffin” is an EN. Observe thatan EN is a larger and more complex notion than an entity occurrence currently identified by the extraction; in particular, an entity occurrence is always a leaf (added as a child of the text node where the extractor found it), and has no attributes.
As customary in the Entity-Relationship model, we assume that some of the nodes surrounding an ENn, and reachable from n, e.g., the twitter handle above, only serve to describen and are not standalone nodes. However, we depart from the classical notion of an Entity used in relational database design, by allowing ENs of a given type to have different sets of attributes, and/or to have more than one value for a given attribute. Note also that in some datasets, Amiens may also be an EN, e.g., if the dataset specifies things about it such as its population, geographical coordinates etc.; in other datasets, e.g., one centered around individuals, or around shops distributed across a country, Amiens may be just a dimension characterizing the ENs (people, respectively, shops). We believe ENs are useful paradigms for exploring the dataset because:
• They correspond to a natural paradigm of “things” character-ized by their properties (attributes);
• They group together pieces of information related to a common resource, e.g., the twitter and Facebook handles of a given person;
• They lay the foundation for many interesting visualizations, where attributes can be used e.g. to place shops on a map according to their location, or events on a timeline etc. (E) Relationships between ENs are interesting. Here, we extend the intuition that just like ENs, relationships are intuitive constructs that allow to structure and analyze a CL graph. For instance, it is interesting to find that Alice (an EN)supervised Bob (another EN).
Based on the above principles, below we describe an algorith-mic approach which, starting from a ConnectionLens graph, (1) identifies Entity Nodes, (2) assigns them attributes among the nodes in their neighborhood, and (3) connects them through relationships.
2.2
Abstraction Algorithm
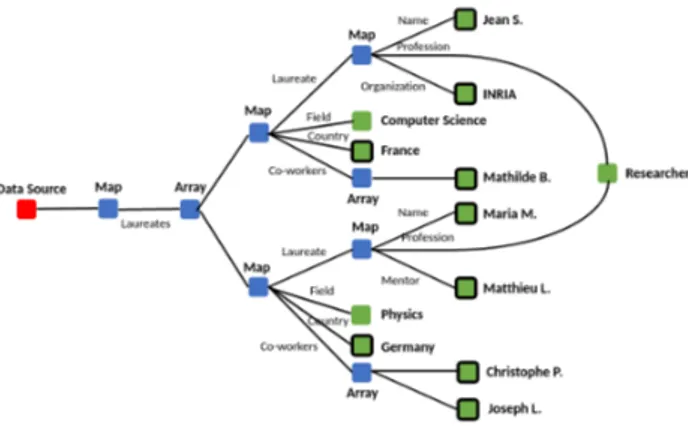
As an example, Figure 2 shows a ConnectionLens graph resulting from a JSON document describing Nobel laureates. The red node is the dataset; blue nodes are maps or arrays, while green nodes correspond to values (literals). Further, named entity occurrences identified by the extraction are outlined by a black contour, e.g., Jean S., Inria, CNRS etc. These form the basis of the entity nodes we want to identify. The figure also shows that ConnectionLens creates a single node for all the nodes with the same label found on the same root-to-leaf path in a dataset: thus, there is a single
Figure 2: Input graphG(d) from a JSON document.
Figure 3: Modified graph G(d) after extracting entities from the graph in Figure 2.
node labeled “Researcher”. This decision materializes the con-nection which exists between Jean S. and Maria M.: both are researchers.
Given a graphG(d) such as shown in the figure, corresponding to a datasetd, a graph EG(d) consisting of entity nodes and relationships between them can be built as follows.
(1) Following(A) and (D), we seek to create ENs starting from the entity occurrences. To that purpose, we use a priority queue Q in which we push all pairs (entity occurrence, its parent node) fromG(d); the priority is computed as the length of the path from the occurrence to the parent until the dataset root (the longer the path, the higher the pair’s priority). If an entity occurrence has several parents, it is pushed inQ once for each parent.
(2) WhileQ is not empty: Pop from Q the pair (o, p) with the high-est priority. Thetype ofo, denoted τ (o), is available in the graph G(d); the set of entity occurrence types currently supported isT = {Person, Location, Organization}. We need to create a rich entity nodeEN (o) out of o. As o is a leaf node (created by ConnectionLens extraction), to find possible attributes of EN (o), we need to climb up from o one or a few levels, then go down to findo’s attributes in the vicinity.
(a) Ifp is an array (list), e.g., in the case when o is the entity oc-currence "Mathilde B.", we conclude thato has no attributes among its siblings, as one does not expect to find, in an array, entitiesand attributes of the same (or comparable) entities.
(b) Ifp is a map, e.g., when o is the entity occurrence "Jean S.", we find the first edge with a non-empty labelλ on the path fromp to the dataset node; in our example, λ is "Laureate". We make the assumption thatλ carries useful information about the content (meaning) of the mapp.
Next, we need to understand howp relates to the entity
nodeEN (o) we are trying to build. For each type τ ∈ T , we compareλ, using Embedded Word Distances [2], to a manually chosen set of keywordsWτ, and select the type τλto whichλ is closest. When λ is “Laureates”, τλis Person. Then:
• Ifτλ, τ (o), the parent p comprising o is “not about o”; p likely describes something else. In our example, where τ (o) is Person, if τλis Organization,p may describe, e.g., an organization in whicho plays some role, but not o itself, therefore the siblings ofo are not its attributes. In this case, fromo, we can find no more attributes of EN (o). • On the contrary, ifτλ = τ (o), we consider that the p
may be abouto, and try to find p children (siblings of o) to attach to EN (o) as attributes. For that purpose, we examine all the entity childrenc of p with type τ (c) = τλ. Ifo is the only one, as is "Jean S.", then its siblings that are leaf children ofp and are not entities themselves are considered as attributes ofEN (o). Otherwise, e.g., "Maria M." has a sibling "Matthieu L." which is also of typeτ = PERSON, then for each edge p
a
−→c, where c is the child ofp with type τ
λanda is the label of the edge, we comparea to a manually chosen set of keywords whose meaning is similar to "key", e.g., “ID”, “name” etc. The labela with the smallest distance to this set determines the “winner” entity occurrence (child ofp) which captures its siblings as attributes. In our example, "Name" is closer in meaning to "key" than "Mentor", so "Maria M." is chosen. In application of our principle(C), when EN (o) captures an attribute,EN (o) replaces its container parent p in G(d), and is pushed back inQ paired with p’s parent.
(c) Ifp is a JSON value from which several entities occur-rences were extracted (e.g.,p is a long text, say, a politician’s speech), no attribute ofEN (o) is extracted from p. This algorithm creates a set of ENs, each encompassing several in-terconnected nodes from the original graphG(d). It also modifies the structure ofG(d) as shown in Figure 3.
Finally, to satisfy principle(E), we look for relationships (links) to be added toEG, based on paths found in the modified graph G as shown above. For now we consider two simple approaches; • If the shortest path between two ENs inG has a length below a fixed threshold, we create an edge between them inEG, labeled with the concatenation of labels on this path. For example we create the edge "Co-workers" between "Maria M." and "Joseph L."
• If two ENs have identically labeled paths to their nearest com-mon ancestornca, we create an edge between them, whose label is"co-" concatenated with the sequence of labels on this path. Ifnca happens to be an array, we add to this the first label encountered on the path fromnca to the datasource. Finally, to avoid overloadingEG with edges, we do not create an edge between two entities if the shortest path between them in G goes through another EN. Figure 4 shows the resulting graph.
The above algorithm handlesone dataset, a JSON one. It di-rectly applies torelational data (where a tuple plays the role of a map and a relation that of an array),(X)HTML documents, andtext documents which we view as shallow trees (one dataset node with entity occurrence children). Further, two ENse1, e2 extracted from datasetsd1, d2such that the originating entity oc-currenceso1, o2were connected by same-As inG(D) are unified in the final graph.
Figure 4: Graph of extracted entitiesEG from example
3
VISUALIZING ENTITY GRAPHS
As mentioned earlier, node-link diagram representations of graphs do not scale beyond a few dozen nodes and edges. Alternative representations of graphs exist, such as adjacency matrices, but are much less familiar to users and require some training to in-terpret. Furthermore, adjacency matrices complicate tasks that involve following paths in graphs, which is an essential aspect of analysis in ConnectionLens. Thus, we exploreways to support the visual exploration of ConnectionLens graphs by improving the more familiar node-link diagram representation, addressing problems of scalability both in terms of number of nodes and links, and in terms of attributes of the multivariate network.
The abstraction strategy we explored so far (Section 2) can be seen as a pre-processing before generating a visual representa-tion of the graph. Another strategy would consist in converting some links in the graph that point to leaf nodes (literal values) into attributes of the source node. Conceptually similar to what GSS [4] does for RDF graphs, applying such a strategy means that the node attributes that have been preprocessed this way can then be visually conveyed by encoding their value using visual variables of the nodes themselves, as is typically done in mul-tivariate network visualization [3]. Then, expressive node-link diagram authoring environments such as Graphies [5], which feature a rich palette of visual mapping options, will let users create elaborate visual representations in which nominal, or-dered and quantitative attributes can be conveyed using different properties of the graphical nodes: shape (predefined shapes or sketches), size, fill and stroke color hue/saturation/brightness, label font properties, even position depending on the choice of layout strategy.
The second strategy consists in incrementally building the graph based on one or a few named entities of interest, iteratively adding subsets of nodes and relationships based on their type or other criterion (e.g., a threshold value for a given attribute), specified interactively by the user in the visualization environ-ment. Thus, users populate the initially-empty canvas with nodes and links of particular interest, adding/removing elements by direct manipulation. Combined with a history mechanism that enables backtracking and forking to explore different subsets of the original ConnectionLens graph, this bottom-up approach to building the visual representation makes it possible to explore graphs that would not be amenable to visualization considered in their entirety. Here again, we rely on Graphies [5] to enable such an incremental construction of the graph. While Graphies is fully functional, we are still in the early stages of integrating it with ConnectionLens. Preliminary results, that rely on a manual processing pipeline for now, are encouraging.
4
PRELIMINARY EXPERIMENTS
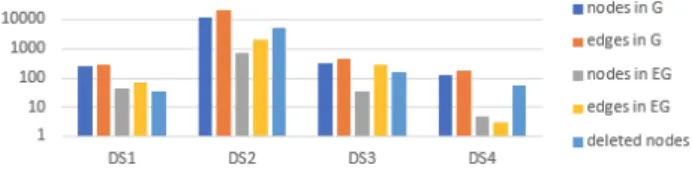
We implemented in Python the algorithm outlined previously. We present some quantitative results based on tests made over four heterogeneous datasets denotedDS1, DS2, DS3 and DS4. DS1 is composed of four datasets : two JSON documents describing
Figure 5: Impact of the graph abstraction algorithms. National Assembly member and a tweet from F. Ruffin respec-tively, as well as two texts. The resulting ConnectionLens graph (the one in1) is not easy to understand; it has many structural nodes and also uninteresting metadata part of the Tweet content. DS2 is a large dataset representing a list of Nobel Laureates. This comprises many Person and Location entity occurrences, as well as many attributes: birth dates, professions etc.DS3 is a RDF graph describing French politicians.DS4 describes the career of one politician, most nodes describe him, while other entities are cities where he was elected.
Figure 5 shows, for each dataset, the number of edges and nodes inG(d), respectively, EG(d). We see that graph abstraction brings about an order of magnitude reduction in the number of nodes and edges. The “deleted nodes” are neither recognized ENs nor attributes of one. A text with no entity occurrence, or children of a map or array which does not contain entities, is not present inEG, nor in the visualization.
5
PERSPECTIVES
Attribute assignment needs to be refined: we currently assume a map refers to at most one EN. However, a map can describe several ENs, or a link between several ENs, in which case the attributes should be added to the link instead of the ENs. For example, if we consider a contract, the id of the contract should be an attribute of the edge link the ENs that are part of this contract. We aim to improve our work in order to take these occurences into account.
To improve the visualization, we also seek to simplify the labels of the edges between entities. Indeed, in large graphs, con-catenating labels found on a path will lead to long and unintelli-gible labels. One idea is to simplify these labels by recognizing a more general type of link such as "worksIn", "writesAbout", "worksWith", etc.
Acknowledgements. This work was partially supported by ANR-15-CE23-0025 (ContentCheck) and ANR-16-CE23-0007 (DI-COS).
REFERENCES
[1] Camille Chanial, Rédouane Dziri, Helena Galhardas, Julien Leblay, Minh Huong Le Nguyen, and Ioana Manolescu. 2018. ConnectionLens: Finding Connections Across Heterogeneous Data Sources (demonstration). VLDB (2018).
[2] Tomas Mikolov, Kai Chen, Greg Corrado, and Jeffrey Dean. 2013. Efficient Estimation of Word Representations in Vector Space.arXiv (2013). [3] C. Nobre, M. Meyer, M. Streit, and A. Lex. 2019. The State of the Art in
Visualizing Multivariate Networks.Computer Graphics Forum 38, 3 (2019). [4] E. Pietriga. 2006. Semantic Web Data Visualization with Graph Style Sheets. In
SoftVis.
[5] Hugo Romat, Caroline Appert, and Emmanuel Pietriga. 2019. Expressive Au-thoring of Node-Link Diagrams with Graphies.TVCG (2019).
[6] T. von Landesberger, A. Kuijper, T. Schreck, J. Kohlhammer, J.J. van Wijk, J.-D. Fekete, and D.W. Fellner. 2011. Visual Analysis of Large Graphs: State-of-the-Art and Future Research Challenges.Computer Graphics Forum 30, 6 (2011). [7] Gerhard Weikum, Johannes Hoffart, and Fabian M. Suchanek. 2016. Ten
Years of Knowledge Harvesting: Lessons and Challenges . In Data Engineering Bulletin .
![Figure 1: Sample screen shot of ConnectionLens GUI [1]](https://thumb-eu.123doks.com/thumbv2/123doknet/12156023.312278/2.892.530.788.371.547/figure-sample-screen-shot-connectionlens-gui.webp)