Predicting early post-stroke aphasia outcome from initial aphasia severity
1
Alberto Osa Garcíaa,b , Simona Maria Brambatic,d , Amélie Brisebois, a,b, Marianne Désilets-Barnabéa,b, 2
Christophe Bedettic,d, Elizabeth Rochone,f,g,h , Carol Leonarde,g,i , Alex Desautelsa,j,k and Karine
3
Marcotte, a,b* 4
a Centre de recherche du Centre intégré universitaire de santé et de services sociaux du
Nord-de-l’Île-de-5
Montréal, Montréal, Québec, Canada. 6
b École d’orthophonie et d’audiologie, Université de Montréal, Montréal, Québec, Canada.
7
c Centre de recherche de l’Institut Universitaire de Gériatrie de Montréal, Montréal, Québec, Canada.
8
d Département de psychologie, Université de Montréal, Montréal, Québec, Canada.
9
e Department of Speech-Language Pathology, University of Toronto, Toronto, Ontario, Canada.
10
f Toronto Rehabilitation Institute, Toronto, Ontario, Canada.
11
g Heart and Stroke Foundation, Canadian Partnership for Stroke Recovery, Ontario, Canada
12
h Rehabilitation Sciences Institute, University of Toronto, Toronto, Canada
13
i School of Rehabilitation Sciences, University of Ottawa, Ottawa, Canada
14
j Département de neurosciences,Université de Montréal, Montréal, Québec, Canada.
15
k Centre d’études Avancées en médecine du sommeil, Hôpital du Sacré-Cœur de Montréal, Montréal,
16 Québec, Canada. 17 18 Corresponding author: 19 Karine Marcotte, Ph.D. 20 E-mail: [email protected] 21 22 23 24 25 26 27 28 29 30 31 32 33 34 35 36 37 38 39 40 41 42 43 44 45 46 47
Abstract 48
49
Background: The greatest degree of language recovery in post-stroke aphasia takes place within the 50
first weeks. Aphasia severity and lesion measures have been shown to be good predictors of long-term 51
outcomes. However, little is known about their implications in early spontaneous recovery. The present 52
study sought to determine which factors better predict early language outcomes in individuals with 53
post-stroke aphasia. 54
Methods: Twenty individuals with post-stroke aphasia were assessed < 72 hours (acute) and 10-14 days 55
(subacute) after stroke onset. We developed a composite score (CS) consisting of several linguistic sub-56
tests: repetition, oral comprehension and naming. Lesion volume, lesion load and diffusion measures 57
(fractional anisotropy (FA) and axial diffusivity (AD)) from both arcuate fasciculi (AF) were also 58
extracted using MRI scans performed at the same time points. A series of regression analyses were 59
performed to predict the CS at the second assessment. 60
Results: Among the diffusion measures, only FA from right AF was found to be a significant predictor 61
of early subacute aphasia outcome. However, when combined in two hierarchical models with FA, age 62
and either lesion load or lesion size, the initial aphasia severity was found to account for most of the 63
variance (R2 = 0.678), not far from the complete models (R2 = 0.703 and R2 = 0.73, respectively). 64
Conclusions: Initial aphasia severity is the best predictor of early post-stroke aphasia outcome, whereas 65
lesion measures and age show a minor influence. We suggest that factors predicting early recovery may 66
differ from those involved in long-term recovery. 67
68
Introduction 69
Aphasia represents one of the most devastating cognitive consequences of a stroke. It is 70
associated with higher levels of anger, loneliness, social isolation and greater difficulties in resuming 71
daily life activities (e.g., return to work).(1) The resulting impairments can partially recover in the days, 72
weeks or months after a stroke,(2) but the degree of recovery varies widely across individuals.(3–5) To 73
date, the degree of recovery has been primarily associated with three kinds of factors:(6) demographic 74
variables (such as age or education),(4) lesion-related variables (such as lesion size and lesion location) 75
(7,8) and clinical variables (including the type and severity of aphasia, and also treatment provided to 76
the patient).(9) While demographic variables have a weak association with long-term outcomes,(10) 77
lesion-related factors have been shown to have a strong relationship with long-term recovery.(6,11) 78
However, clinical variables remain the most widely used measures for clinicians to gain insight into the 79
patient’s clinical progression.(12) Current research focuses on investigating which are the most reliable 80
factors that enable clinicians to predict long-term outcomes and that help predict recovery. 81
82
Among the clinical variables, initial aphasia severity seems to be one of the best predictors of 83
aphasia outcome.(4,13,14) For instance, Kertesz and McCabe showed that the initial Aphasia Quotient 84
(AQ, aphasia severity scale from the Western Aphasia Battery,(15) henceforth referred to as WAB) 85
was a good predictor of aphasia recovery at 6- and 12-months, while age or sex did not improve 86
prognosis accuracy.(16) More recently, Lazar and colleagues proposed a modified version of the AQ 87
for acute stroke assessment (mean = 2.1 days).(13) Their mean composite score was composed of the 88
comprehension, repetition and naming sections of the WAB, having all sections equal weight on the 89
final score. Using this modified AQ, they reported that initial severity was a good predictor of recovery 90
during the first 90 days post-stroke. Although the results were clear, this study evaluated patients with 91
only mild to moderate aphasia, which neglects those patients with more severe language deficitsin 92
which recovery results are more difficult to capture. A recent study found evidence that the interaction 93
between severity and other variables may be different in patients with more severe aphasia.(17) 94
Inclusion of patients with severe aphasia entails more difficulty in the analysis of data, but is necessary 95
to picture a more realistic and clinically relevant scenario.(12) Furthermore, another gap in the 96
literature is the study of the spontaneous recovery, scarcely studied in the weeks after stroke onset 97
(3,18,19), and impossible to analyze in longitudinal studies due to the effect of therapy and 98
rehabilitation. Recently, Wilson and colleagues described the evolution of aphasia during the first 2 99
weeks after a stroke, and explored how language recovers promptly in different modalities within the 100
first week post-stroke.(20) However, no measures were taken to assess the biomarkers that might 101
predict this recovery. 102
103
As for lesion-related factors, they are also broadly used to predict aphasia outcomes. Although 104
lesion size has been shown to be a good predictor of stroke and aphasia outcomes, (7,21,22) the study 105
of specific damaged structures has recently been determined to be a more accurate index for specific 106
impairments. Because most patients with post-stroke aphasia have damage near/in the middle cerebral 107
artery,(23) lesions to specific structures in this territory have been linked to aphasia symptoms. For 108
instance, the superior temporal gyrus, the pars opercularis of the inferior frontal gyrus, the anterior 109
insula and the supramarginal gyrus are among the areas most frequently related to aphasia 110
symptoms.(24) However, contemporary frameworks of language processing consider language 111
functions to be a result of processing cores working in an interconnected network. This functional 112
network is supported by pathway structures linking the areas of processing, i.e. the white matter 113
bundles. Therefore, if white matter structures are important to establish linguistic abilities, they may be 114
good candidates to support aphasia recovery.(25) 115
116
Among all the white matter structures in the brain, probably the one that is the most studied in 117
relation to language is the arcuate fasciculus (AF).(26,27) This fiber bundle, which connects areas from 118
the temporal, parietal and frontal cortical areas through its three segments,(23) has been linked to 119
several language functions, from speech-in-noise perception to syntax processing. Researchers have 120
used diffusion magnetic resonance imaging (dMRI) measures to assess the influence of the lesioned AF 121
in the language breakdown, either through the integrity of its structure(28–30) or through its properties. 122
Other approaches include combinations of grey and white matter,(31,32) or the quantitative measure of 123
the spared white matter in the contralesional hemisphere.(33,34) However, most studies that have 124
investigated the role of white matter in aphasia outcomes are performed during the chronic phase of 125
recovery. Therefore, there is a lack of evidence regarding the role of the white matter in early and 126
spontaneous recovery from aphasia. 127
128
In this study, we intended to explore outcomes of aphasia in the first 2 weeks after stroke onset. 129
We also intended to elucidate which factors, either related to the lesion characteristics or the preserved 130
language skills, are accurate predictors of these outcomes in patients at the beginning of their subacute 131
phase, before having received any therapy. To our knowledge, no previous study has evaluated the 132
degree of improvement between the acute and sub-acute phase using analyses that combine more than 133
one language ability and neuroimaging measures. This work could provide new information that can be 134
used to improve the prediction of aphasia recovery and the planification of rehabilitation of patients in 135
the long-term. Based on previous evidence,(13,20) we hypothesized that initial severity will predict the 136
early recovery, but only partially given that the dynamics of recovery are more unstable in this phase 137
than in the phases more commonly reported in the literature (e.g., at 3, 6 months post-onset). We also 138
predicted that there is a relationship between the diffusion measures from the arcuate fasciculus, given 139
its proven importance as a predictor for language abilities in other studies,(34–36) and the early 140
outcomes two weeks after onset. 141
Materials and Methods 142
143
Participants 144
145
Twenty participants took part in this study (5 women; mean age: 71.6 ± 12.45 years; mean 146
education: 10.05 ± 5.04). Participants presented with aphasia due to a first single ischemic stroke in the 147
left middle cerebral artery. No criteria concerning aphasia severity or lesion size were adopted. All 148
participants were diagnosed by a neurologist at the Stroke Unit at Hôpital du Sacré-Coeur de Montréal 149
and screened for eligibility. Initial assessments took place within the first 72 hours (mean = 2.3 days) 150
after stroke onset, and the following assessments took place 7 to 15 days later (mean = 10.55 days). 151
Therefore, two time points will be defined as “initial time point” and “10 days time point”. Clinical and 152
sociodemographic information of the entire sample are presented in Table 1. All participants were 153
fluent speakers of French or English before stroke and completed their evaluation either in French 154
(n=18) or in English (n=2), using equivalent stimuli in the case of English dominant speakers. 155
Exclusion criteria included a history of major psychiatric disorder(s), learning disabilities, severe 156
perceptual deficits, additional neurological diagnoses or left-handedness. No participant presented with 157
pronounced subcortical arteriosclerosis. The study was approved by the ethics review board (Project 158
#MP-32-2018-1478) of the research center of the Centre intégré universitaire de santé et de services du 159
Nord-de-l’Île-de-Montréal, in the Hôpital Sacré Coeur de Montreal. Written informed consent was 160
obtained from all participants. 161
162
************************ 163
Insert Table 1 approximately here 164
************************* 165
166
Rationale, construction, and scoring of the Aphasia Composite Score 167
168
Based on Lazar et al.,(13) we developed a composite score (CS) adapted for the French- and 169
English-speaking population that consisted of three subscores: comprehension, repetition and naming. 170
For the comprehension subscore, we combined the Word-Sentence Comprehension Task (max = 47 171
points) of the Montreal-Toulouse(37) and the revised (short) version of the Token Test(38)(max = 36 172
points), which includes oral comprehension of words, sentences and sequential commands. The 173
repetition subscore was assessed using the repetition task (2 points for each word/nonword (n=30) and 174
5 points for each sentence (n=3), max = 75 points) of the MT-86.(37) Finally, the naming subscore 175
consisted of using the DO-80(39) (max = 80 points) and the semantic fluency task (max = 25 points) of 176
the Protocole Montréal d’Évaluation de la Communication.(40) The Boston Naming Test (BNT) was 177
used instead of the DO-80 in the cases in which participants were more proficient in English.(41) Each 178
of the three subscores was computed to a possible score of 10, so the maximum CS was equal to 30. 179
Initial aphasia severity (CS initial) and sub-acute severity (CS10 days) were calculated for each participant,
180
as well as their potential recovery (potential recovery = 30 – CS initial) and their achieved recovery
181
(achieved ΔCS = CS10 days – CS initial). A percentage of factual recovery per individual was computed as
182
achieved recovery = (achieved ΔCS / Potential recovery). 183
184
Neuroimaging processing and tractography analyses 185
Participants underwent an MRI scan the same day of each language assessment. The MRI 187
protocol was acquired using a Skyra 3T MRI scanner (Siemens Healthcare, USA) at the Radiology 188
Department of Hôpital du Sacré-Coeur in Montreal. One high resolution 3D T1-weighted scan was 189
acquired using a Magnetization Prepared Rapid Gradient Echo (MP-RAGE) sequence (TR = 2200 ms, 190
TE = 2.96 ms, TI = 900 ms, voxel size = 1x1x1 mm3, matrix = 256x256, 192 slices, flip angle = 8 191
degrees). A diffusion weighted imaging (DWI) series of sequences in a posterior-anterior acquisition 192
(64 images with non-collinear diffusion gradients at b =1,000 s/mm² with TR = 8051 ms, TE = 86 ms, 193
FOV = 230 mm, voxel size = 2 mm×2 mm×2 mm, flip angle = 90 degrees, bandwidth = 1698Hz; EPI 194
factor=67) was also acquired. In addition, two T2-weighted images at b = 0 s/mm² were also acquired 195
one in a posterior-anterior acquisition, one in an anterior-posterior acquisition to correct for distortion 196
caused by magnetic field inhomogeneities. Stroke lesions were demarcated using a semi-automated 197
demarcation performed with Clusterize(42) (http://www.medizin.uni-198
tuebingen.de/kinder/en/research/neuroimaging/software/). Agreement between a manual segmentation 199
and the semi-automated lesion maps obtained with Clusterize has been shown to be excellent in acute 200
stroke using CT, DWI and T2 FLAIR.(43) Moreover, ADC maps extracted from the DWI sequence are 201
less sensitive to imaging artifacts (i.e. T2-shine-through) than DWI images(44) and both have high 202
sensitivity for detecting acute ischemic stroke.(45) Thus, stroke lesions were segmented with the ADC 203
maps using Clusterize, and were verified and corrected by two other independent judges afterwards. 204
Lesion size was estimated in mL. After lesion demarcation, regions of interest were extracted using 205
FreeSurfer (https://surfer.nmr.mgh.harvard.edu) and tensors and fiber orientation maps were obtained 206
using MRtrix3. Previous research has shown the importance of the AF for recovery from aphasia, but 207
some studies indicate the AF in the left hemisphere is more important(35,36), whereas others suggest 208
the right hemisphere is relevant for recovery.(34) Based on this converging evidence regarding the role 209
of the long segment of the AF in language recovery in patients with aphasia, we extracted the fractional 210
anisotropy (FA), the axial diffusivity (AD) and the lesion load of this fiber bundle in both hemispheres. 211
AD was chosen over other diffusivity measures since it has been more directly related to acute post-212
stroke recovery in motor impairments compared to other measures.(46) Lesion load was calculated 213
from the number of voxels that were defined as AF inside the lesion size of each participant, weighted 214
by the number the same voxels occupied by the AF in healthy participants, described in another study 215 of our team.(47) 216 217 Statistical analyses 218 219
First, we performed tests on the behavioral measures alone to evaluate whether there was a 220
significant improvement of language impairment during the first two weeks following a stroke. Since 221
CS10 days and some of the subscores showed a non-normal distribution (a Shapiro Wilk normality test
222
revealed the scores for comprehension(10 days), repetition(initial), repetition(10 days), being p < .05 in all
223
cases), we conducted a Wilcoxon signed rank test for paired-samples between CSinitial and CS10 days and
224
between the paired subscores, with at least one subscore having a non-normal distribution. For the 225
other pair whose distribution was normal (naming), a paired-sample t-test was used. We also inspected 226
how much of the achieved score was influenced by the potential recovery. 227
228
Second, we performed different analyses to determine which variables predict more accurate 229
CS10 days. We first performed a series of Pearson correlations to test the association between all our
230
variables of interest with CS10 days. Correlation analyses were corrected at a level of significance of α =
231
0.01. Subsequently, to test which variables best fit an ultimate regression model, we performed several 232
regressions analyses in different steps. In a first step, a backwards analysis was performed to determine 233
which diffusion variables extracted from the arcuate fasciculus (i.e., FA from left AF; FA from right 234
AF; AD from left AF; AD from right AF) was more so related to the dependent variable. The variables 235
that were found to be significant were included in a hierarchical multivariate regression later. Two 236
models of this hierarchical regression were tested. Both of them were computed in t blocks: in the first 237
block, age and initial aphasia severity were entered as control variables, or covariates (since previous 238
research has already shown a certain capacity of prediction of both of them for later outcomes in 239
aphasia);(6) in the second block, we introduced either lesion size (first hierarchical model) or lesion 240
load of the left AF (second hierarchical model); in the third block, we introduced the significant 241
diffusion variables from the first regression that we performed. Doing so, we could differentiate the 242
contribution of the patient-related- and the different lesion-related-factors in the final prediction of the 243 outcome. 244 245 Results 246 247
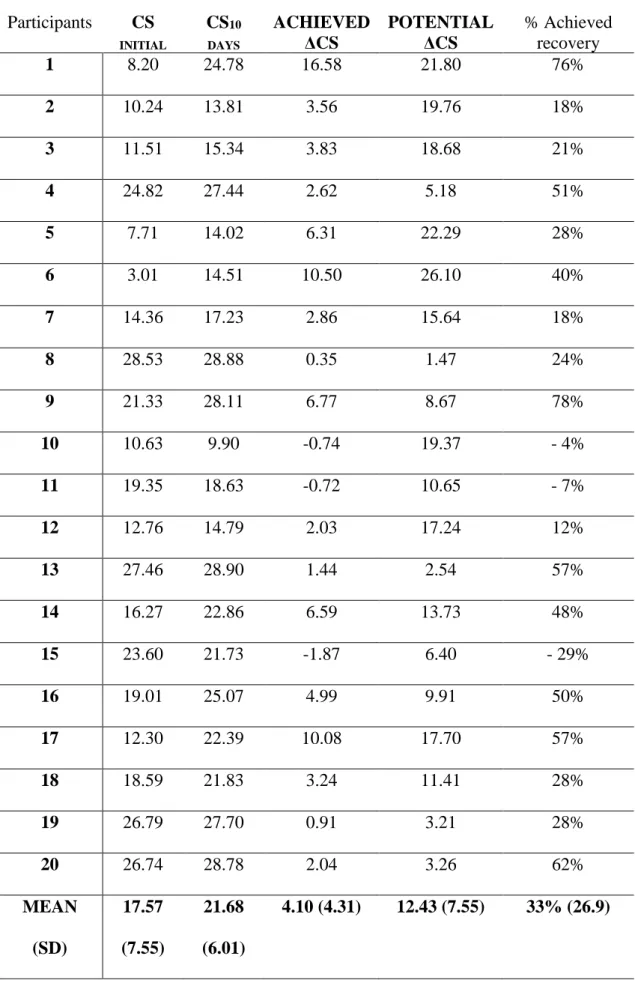
Individual CS scores during the initial and second assessment are reported in Table 2. Three 248
participants showed a deterioration during the two time points; the rest of the participants showed an 249
improvement in CS scores. As a group, the mean CSinitial was 17.57 (SD = 7.55), whereas the mean
250
CS10days was 21.68 (SD = 6.01). There was a significant overall improvement in language functioning
251
during the follow-up (Z = 3.547, P <0.001). The mean improvement in CS for the whole group was 252
33% (SD = 26.9), i.e. 33% of the potential recovery was reported on average. Achieved ΔCS positively 253
correlated with the potential ΔCS (r = 0.651, P = 0.002). A visual representation of this relation can be 254
seen in the figure 1 in the supplementary materials. All three subscores (i.e., comprehension, repetition 255
and naming) were significantly improved between the initial assessment and the follow-up 256
(Comprehension Wilcoxon signed ranks test, Z = 3.771, P < 0.001; Repetition Wilcoxon signed ranks 257
test, Z = -3.115, P = 0.002; naming paired-sample t-test = -2.329, df = 18, P = 0.031). A visual 258
comparison can be seen in the figure 2 in the supplementary materials. 259
260
************************ 261
Insert Table 2 approximately here. 262
************************* 263
Only one model was significant as a result of the backwards regression analysis that used the 264
diffusion variables and CS10days as dependent variable. The model included FA from right AF (rFA) and
265
AD from left AF after elimination of the less contributing variables (R2 = 0.282). From these two 266
variables, only rFA was found to have a significant coefficient (β = 0.590, P = 0.23). Thus, rFA was the 267
only diffusion variable included in the hierarchical regression analyses with the rest of the variables. 268
269
Two hierarchical multivariate regressions were computed, each one with a different variable 270
that represented a measure of the lesion: the first consisted of a three-block computation, where CS initial
271
and age were introduced in the first block, lesion load of the left AF was introduced in the second block 272
and rFA was introduced in the second block. The second regression consisted of the same procedure, 273
but we used lesion size in the second block. Before performing the regression analysis, we performed a 274
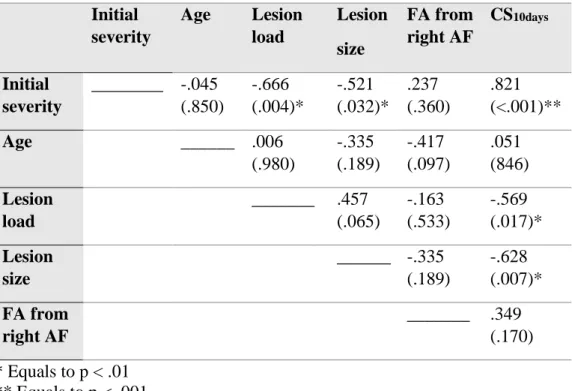
correlation analysis between the possible predictors to determine the independence of the variables. CS 275
initial, lesion load and lesion size were found to have a significant correlation with the dependent variable
276
(respectively, r = 0.810, P <0.001; r = -0.515, P = 0.02; -0.628, P = 0.003; see Table 3 for all 277
correlations between the variables). 278
279 280
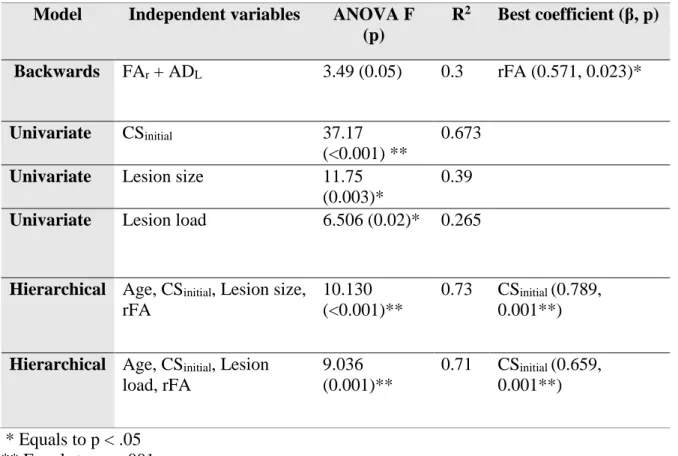
After this, regression analyses were performed. Results are reported in Table 4. First, we 281
decided to run univariate regressions to determine the possible predictive power of each of the lesion-282
related measures, i.e. lesion size, lesion load of AF and rFA, and the initial severity (CSinitial ) on the
283
CS10days. Regressions with lesion size, lesion load and initial severity were found to be significant. Each
accounted, respectively, for 39%, 26.5% and 67.3% of the variance of the dependent variable. The next 285
step consisted of performing a multivariate regression analyses with the previous variables and age 286
(used as a covariate). When combined in the first block of the hierarchical analysis, CS initial and age
287
explained 67.8% of the variance (R2 = 0.678), with a F = 17.874 (P < 0.001, df = 19), and CS initial
288
being the only variable whose coefficient was significant (β = 0.824; P < 0.001). Adding the second 289
block to the model allowed us to see two possible results that depended on the lesion-related variable. 290
If lesion load was added, it did not add more R2 to the previous model, and the CS initial was still the
291
only significant coefficient (P = 0.001). If lesion size was added, it explained up to 71.7% of the 292
variance (R2 = 0.717) with a F = 10.130 (P < 0.001, df = 19). We added a third block in each 293
regression, which included the rFA. Inclusion of this variable increased 2.6% in the variance account of 294
the regression that used the lesion load (R2 change = - 0.007), and 2.3% in the case of the regression
295
that used lesion size (R2 change = - 0.006). Both changes were not significant. We decided to run a 296
variance inflation factor analysis (VIF) to discard multi-collinearity (or dependency) among the 297
predictors, since two of these predictors in each model were highly correlated with the dependent 298
variable. No predictor was found to be extremely collinear with the others. 299
300
************************ 301
Insert Table 4 approximately here. 302 ************************ 303 304 Discussion 305
Substantial improvement in language performance occurred within the first two weeks after 306
stroke; this was measured using a composite score of several language functions in patients with mild 307
to severe aphasia. As previously reported, there was a significant correlation between the degree of the 308
achieved recovery (achieved ΔCS) and the potential improvement (potential ΔCS); however, our 309
assessment time points were different than those previously reported in a study using similar 310
measures.(13) As for the predictions of the composite score during the early sub-acute phase, the most 311
successful model consisted of a combination of age, lesion size, initial aphasia severity and FA of the 312
long segment of the right AF. Even without the diffusion measure, the model could predict up to 70% 313
of the variance of the severity during the sub-acute phase. Most importantly, the predictive power of 314
the initial aphasia severity (univariate model) was close to the multivariate models including lesion 315
measures, which indicates that among all our variables, it was the best predictor for severity at the 316
second time point. 317
318
Recovery from aphasia peaks during the first weeks after onset,(3,4) but it is difficult to ensure 319
that all changes in the abilities are constrained by time. We have reported here, as has also been 320
recently reported elsewhere,(20) that it is possible to capture this process with a sensitive and reliable 321
assessment. As is typical when quantifying these processes, patients with higher initial severities also 322
show more recovery, due to a larger level of possible improvement. Other patients with a lower initial 323
severity improved less, or even slightly deteriorated during this period. These patients’ recovery results 324
may depend on other factors that do not systematically contribute to their recovery as successfully as in 325
other patients. The reasons for this may vary from individual physiological factors, such as the brain’s 326
blood supply and modulation of post-stroke neuroinflammation(5) to more patient-related factors, such 327
as previous language use or socio-individual situation. 328
329
The effective recovery that occurs during the early stage of aphasia remains an important part of 330
the whole recovery process, but it is highly variable between individuals. This variability is reflected in 331
the different rates of recovery per individual, which tend to stabilize over time.(18,48) Most studies 332
have investigated the prediction of language outcomes (either from damaged or spared brain areas and 333
for long term outcomes) such that the “size or site”, or any combination of both, could explain severity, 334
symptoms and prognosis of aphasia.(28,31,34,49,50) Conversely, we present evidence that different 335
factors may account for the early phases of recovery, and more specifically, these factors may influence 336
spontaneous recovery. Previous studies have reported that initial aphasia severity, isolated or in 337
combination with other biological measures, can account for a large amount of variance in the long 338
term.(13,17) It has been also shown that different white matter structures may be involved in the 339
outcome of aphasia at different stages, although this has not been explored during early recovery.(51) 340
This evidence indicates that behavioral measures are useful for predicting the linguistic abilities at 341
several phases of aphasia recovery and may explain its dynamics in a more detailed way than has been 342
explored to date. Based on these data, we propose that initial language severity may have a greater 343
influence for short-term overall language prediction; whereas lesion-related variables may be more 344
important for the prediction of specific language domains or for long-term predictions. 345
346
One of the main hypotheses about the mechanisms of aphasia recovery is the involvement of 347
spared contralateral homologue structures during the acute phase(52), as a prelude to a different stage 348
of recovery where left hemisphere structures are involved,(33,52) reflecting a better long-term 349
recovery. The right arcuate fasciculus was the white matter structure that better predicted aphasia 350
outcomes after stroke in our sample, which is in line with previous findings in the literature(34). 351
However, its involvement, as measured using FA, is much less significant when introduced into a 352
multivariate model. One explanation is that the stabilization of recovery had not yet reached its peak 353
because pathophysiological processes may have avoided a right “uptake” from the right arcuate 354
fasciculus, and the timing of the assessment may have been too close to stroke onset to see differences. 355
Previous studies have looked into changes in white matter structures over time after lesions,(54,55) but 356
these changes have been reported only at long term time points and under specific therapies. The 357
emerging question is whether initial aphasia severity, and therefore the degree of early recovery, 358
influences the changes of these structures in the long term. 359
360
Limitations of this study include the small sample size and the analysis that was limited to only 361
one white matter tract. In order to analyze the complex process of spontaneous recovery, more factors 362
should be addressed, specifically the structures that have been flagged as potential scaffolding for later 363
recovery, such as the inferior fronto-occipital fasciculus or the uncinate fasciculus.(51) However, we 364
have been able to explain a large part of language outcome after almost two weeks in individuals with 365
aphasia using linguistic assessments and biological measures that do not target specific structures. This 366
suggests that cognitive evaluation remains one of the most useful tools in the acute stages of aphasia 367
and in the study of its evolution. Future studies should address differences between recovery phases 368
with more neuroimaging techniques and with a larger sample to help account for the variability that this 369
disorder presents in daily clinical practice. 370
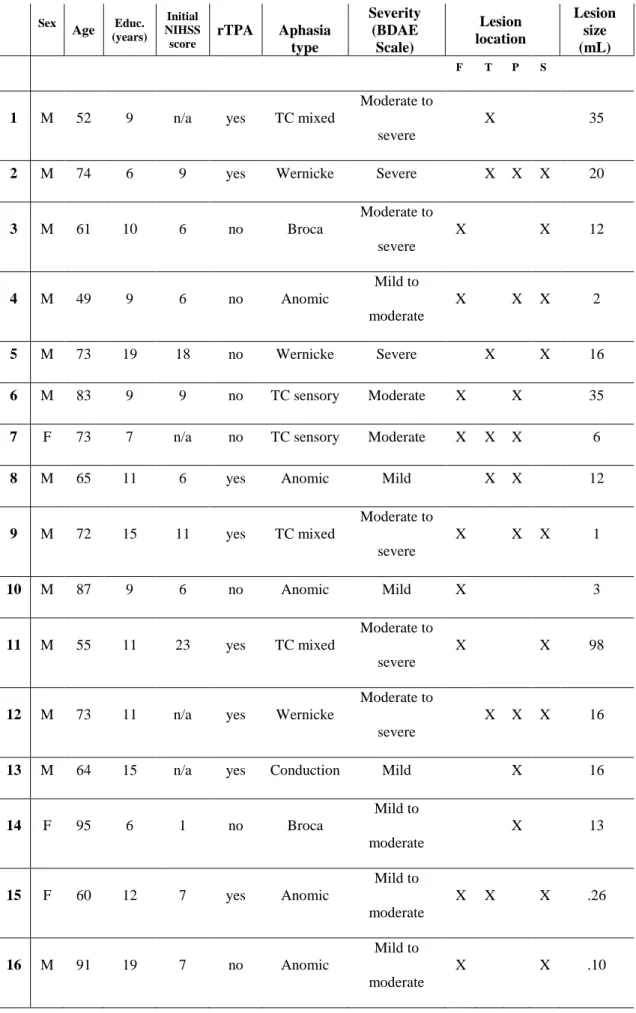
Table 1. Participants’ sociodemographic and clinical information. Sex Age Educ. (years) Initial NIHSS score rTPA Aphasia type Severity (BDAE Scale) Lesion location Lesion size (mL) F T P S
1 M 52 9 n/a yes TC mixed
Moderate to severe
X 35
2 M 74 6 9 yes Wernicke Severe X X X 20
3 M 61 10 6 no Broca Moderate to severe X X 12 4 M 49 9 6 no Anomic Mild to moderate X X X 2 5 M 73 19 18 no Wernicke Severe X X 16 6 M 83 9 9 no TC sensory Moderate X X 35
7 F 73 7 n/a no TC sensory Moderate X X X 6
8 M 65 11 6 yes Anomic Mild X X 12
9 M 72 15 11 yes TC mixed Moderate to severe X X X 1 10 M 87 9 6 no Anomic Mild X 3 11 M 55 11 23 yes TC mixed Moderate to severe X X 98
12 M 73 11 n/a yes Wernicke
Moderate to severe
X X X 16
13 M 64 15 n/a yes Conduction Mild X 16
14 F 95 6 1 no Broca Mild to moderate X 13 15 F 60 12 7 yes Anomic Mild to moderate X X X .26 16 M 91 19 7 no Anomic Mild to moderate X X .10
17 F 85 16 n/a no TC mixed Moderate X 14
18 M 71 7 n/a no TC motor Moderate X X 1
19 F 81 15 17 yes Anomic Mild X 10
20 F 68 12 n/a yes Anomic Mild X X .33
rTPA = Recombinant tissue plasminogen activator F = Frontal, T = Temporal, P = Parietal, S = Subcortical
Table 2. Participants’ Composite Scores (CS) Participants CS INITIAL CS10 DAYS ACHIEVED ΔCS POTENTIAL ΔCS % Achieved recovery 1 8.20 24.78 16.58 21.80 76% 2 10.24 13.81 3.56 19.76 18% 3 11.51 15.34 3.83 18.68 21% 4 24.82 27.44 2.62 5.18 51% 5 7.71 14.02 6.31 22.29 28% 6 3.01 14.51 10.50 26.10 40% 7 14.36 17.23 2.86 15.64 18% 8 28.53 28.88 0.35 1.47 24% 9 21.33 28.11 6.77 8.67 78% 10 10.63 9.90 -0.74 19.37 - 4% 11 19.35 18.63 -0.72 10.65 - 7% 12 12.76 14.79 2.03 17.24 12% 13 27.46 28.90 1.44 2.54 57% 14 16.27 22.86 6.59 13.73 48% 15 23.60 21.73 -1.87 6.40 - 29% 16 19.01 25.07 4.99 9.91 50% 17 12.30 22.39 10.08 17.70 57% 18 18.59 21.83 3.24 11.41 28% 19 26.79 27.70 0.91 3.21 28% 20 26.74 28.78 2.04 3.26 62% MEAN (SD) 17.57 (7.55) 21.68 (6.01) 4.10 (4.31) 12.43 (7.55) 33% (26.9)
Table 3. Matrix with all correlations between independent variables (Initial severity, Age, Lesion load, Lesion size, rFA) and the dependent variable (CS10 days). Pearson
coefficients are reported (level of p). All correlations have been corrected to a threshold of α = 0.01. Initial severity Age Lesion load Lesion size FA from right AF CS10days Initial severity ________ -.045 (.850) -.666 (.004)* -.521 (.032)* .237 (.360) .821 (<.001)** Age ______ .006 (.980) -.335 (.189) -.417 (.097) .051 (846) Lesion load _______ .457 (.065) -.163 (.533) -.569 (.017)* Lesion size ______ -.335 (.189) -.628 (.007)* FA from right AF _______ .349 (.170) * Equals to p < .01 ** Equals to p < .001
Table 4. Summary of results from regression models.
Model Independent variables ANOVA F
(p) R2 Best coefficient (β, p) Backwards FAr + ADL 3.49 (0.05) 0.3 rFA (0.571, 0.023)* Univariate CSinitial 37.17 (<0.001) ** 0.673
Univariate Lesion size 11.75
(0.003)*
0.39
Univariate Lesion load 6.506 (0.02)* 0.265
Hierarchical Age, CSinitial, Lesion size,
rFA
10.130 (<0.001)**
0.73 CSinitial (0.789,
0.001**)
Hierarchical Age, CSinitial, Lesion
load, rFA 9.036 (0.001)** 0.71 CSinitial (0.659, 0.001**) * Equals to p < .05 ** Equals to p < .001
References
1. Ferro JM, Madureira S. Aphasia type, age and cerebral infarct localisation. J Neurol. 1997;(244):505–9.
2. Hillis AE. Aphasia: Progress in the last quarter of a century. Neurology. 2007;69(2):200–13.
3. Pedersen PM, Stig Jørgensen H, Nakayama H, Raaschou HO, Olsen TS, Jorgensen HS, et al. Aphasia in acute stroke: Incidence, determinants, and recovery. Ann Neurol. 1995;38(4):659–66.
4. Laska AC, Hellblom A, Murray V, Kahan T, Von Arbin M. Aphasia in acute stroke and relation to outcome. J Intern Med. 2001;249(5):413–22.
5. Charidimou A, Kasselimis D, Varkanits M, Selai C, Potagas C, Evdokimidis I. Why is it difficult to predict language impairment and outcome in patients with aphasia after Stroke? J Clin Neurol. 2014;10(2):75–83.
6. Watila MM, Balarabe B. Factors predicting post-stroke aphasia recovery. J Neurol Sci. 2015;352(1–2):12–8.
7. Maas MB, Lev MH, Ay H, Singhal AB, Greer DM, Smith WS, et al. The prognosis for aphasia in stroke. J Stroke Cerebrovasc Dis. 2012;21(5):350–7. 8. Heiss WD, Thiel A, Winhuisen L, Mühlberger B, Kessler J, Herholz K.
Functional imaging in the assessment of capability for recovery after stroke. J Rehabil Med. 2003;41:27–33.
9. Hillis AE. Editorial: The “standard” for poststroke aphasia recovery. Stroke. 2010;41(7):1316–7.
10. Plowman E, Hentz B, Ellis C. Post-stroke aphasia prognosis: A review of patient-related and stroke-patient-related factors. J Eval Clin Pract. 2012;18(3):689–94.
11. Boyd LA, Hayward KS, Ward NS, Stinear CM, Rosso C, Fisher RJ, et al.
Biomarkers of Stroke Recovery: Consensus-Based Core Recommendations from the Stroke Recovery and Rehabilitation Roundtable. Neurorehabil Neural Repair. 2017;31(10–11):864–76.
12. Gerstenecker A, Lazar RM. Language recovery following stroke. Clin Neuropsychol. 2019;1–20.
13. Lazar RM, Minzer B, Antoniello D, Festa JR, Krakauer JW, Marshall RS. Improvement in aphasia scores after stroke is well predicted by initial severity. Stroke. 2010/06/12. 2010;41(7):1485–8.
14. Glize B., Villain M., Richert L., Vellay M., de Gabory I., Mazaux JM., Dehail P., Sibon I., Laganaro M. JP. Language features in the acute phase of poststroke severe aphasia could predict the outcome. Eur J Phys Rehabil Med.
2017;53(2):249–55.
15. Kertesz A, Poole E. The aphasia Quotient: The taxonomic approach to measurement of aphasic disability. Can J Neurol Sci. 2004;31(2):175–84. 16. Kertesz A, Mccabe P. Recovery patterns and prognosis in aphasia. Brain.
1977;100:1–18.
17. Benghanem S, Rosso C, Arbizu C, Moulton E, Dormont D, Leger A, et al. Aphasia outcome : the interactions between initial severity , lesion size and location. J Neurol. 2019;266(6):1303–9.
18. El Hachioui H, Lingsma H, van de Sandt-Koenderman M, Dippel DWJ, Koudstaal PJ, Visch-Brink EG. Recovery of aphasia after stroke : a 1-year follow-up study. J Neurol. 2013;260:166–71.
Early Recovery of Aphasia through Thrombolysis: The Significance of Spontaneous Speech. J Stroke Cerebrovasc Dis. 2018;27(7):1937–48.
20. Wilson SM, Eriksson DK, Brandt TH, Schneck SM, Lucanie JM, Burchfield AS, et al. Patterns of Recovery From Aphasia in the First 2 Weeks After Stroke. J Speech, Lang Hear Res. 2019;62(3):723–32.
21. Heiss WD. Flow thresholds of functional and morphological damage of brain tissue. Stroke. 1983;14(3):329–31.
22. Hope TMH, Seghier ML, Leff AP, Price CJ. Predicting outcome and recovery after stroke with lesions extracted from MRI images. NeuroImage Clin. 2013;2:424–33.
23. Catani M, Mesulam M. The arcuate fasciculus and the disconnection theme in language and aphasia: history and current state. Cortex. 2008 Sep;44(8):953–61. 24. Fridriksson J, Den Ouden DB, Hillis AE, Hickok G, Rorden C, Basilakos A, et
al. Anatomy of aphasia revisited. Brain. 2018;141(3):848–62.
25. Duffau H. White Matter Pathways in the Human. In: Neurobiology of Language, ed Hickcok G and Small S. 2016. p. 129–37.
26. Catani M, Jones DK, ffytche DH. Perisylvian language networks of the human brain. Ann Neurol. 2005 Jan;57(1):8–16.
27. Jang SH. Diffusion Tensor Imaging Studies on Arcuate Fasciculus in Stroke Patients: A Review. Front Hum Neurosci. 2013;7(November):1–7.
28. Jang SH, Cho IT, Lim JW. Recovery of aphasia and change of injured arcuate fasciculus in the dominant hemisphere in stroke patients. NeuroRehabilitation. 2017;41(4):759–64.
29. Tak HJ, Jang SH. Relation between aphasia and arcuate fasciculus in chronic stroke patients. BMC Neurol. 2014;14(1):1–5.
30. Marchina S, Zhu LL, Norton A, Zipse L, Wan CY, Schlaug G. Impairment of Speech Production Predicted by Lesion Load of the Left Arcuate Fasciculus. Stroke. 2011 Aug;42(8):2251–6.
31. Hillis AE, Beh YY, Sebastian R, Breining B, Tippett DC, Wright A, et al.
Predicting recovery in acute poststroke aphasia. Ann Neurol. 2018;83(3):612–22. 32. Meier E, Johnson J, Pan Y, Kiran S. The utility of lesion classification models in
predicting language abilities and treatment outcomes in persons with aphasia. Front Hum Neurosci. 2019;12.
33. Wright A, Tippett D, Saxena S, Sebastian R, Breining B, Faria A, et al. Leukoaraiosis is independently associated with naming outcome in poststroke aphasia. Neurology. 2018;91(6):e526-532.
34. Forkel SJ, Thiebaut de Schotten M, Dell’Acqua F, Kalra L, Murphy DG, Williams SC, et al. Anatomical predictors of aphasia recovery: a tractography study of bilateral perisylvian language networks. Brain. 2014;137(Pt 7):2027–39. 35. Marchina S, Zhu LL, Norton A, Zipse L, Wan CY, Schlaug G. Impairment of
speech production predicted by lesion load of the left arcuate fasciculus. Stroke. 2011;42(8):2251–6.
36. Breier JI, Hasan KM, Zhang W, Men D, Papanicolaou AC. Language dysfunction after stroke and damage to white matter tracts evaluated using diffusion tensor imaging. Am J Neuroradiol. 2008;29(3):483–7.
37. Nespoulous JL, Lecours AR, Lafond D. MT-86-Protocole Montréal-Toulouse d’examen linguistique de l’aphasie. Ortho-Edition: Isbergues. 1986;
38. De Renzi E, Faglioni P. Normative data and screening power of a shortened version of the Token Test. Cortex. 1978;14(1):41–9.
du centre de psychologie appliquée; 1997.
40. Joanette Y, Ska B, Côté H. Protocole Montréal d’Évaluation de la Communication. Isbergues, France: Ortho Édition; 2004.
41. Kaplan E, Goodglass H, Weintraub S. Boston Naming Test. Philadelphia: Lea & Febiger; 1983.
42. Clas P, Groeschel S, Wilke M. A Semi-Automatic Algorithm for Determining the Demyelination Load in Metachromatic Leukodystrophy. Acad Radiol.
2012;19(1):26–34.
43. De Haan B, Clas P, Juenger H, Wilke M, Karnath HO. Fast semi-automated lesion demarcation in stroke. NeuroImage Clin [Internet]. 2015;9:69–74. Available from: http://dx.doi.org/10.1016/j.nicl.2015.06.013
44. Straka M, Albers GW, Bammer R. Real-time Diffusion-Perfusion Mismatch Analysis in Acute Stroke. J Magn Reson Imaging. 2010;6(9):2166–71.
45. Schaefer PW, Copen WA, Lev MH, Gonzalez RG. Diffusion-Weighted Imaging in Acute Stroke. Magn Reson Imaging Clin N Am. 2006;14(2):141–68.
46. Moulton E, Amor-sahli M, Perlbarg V, Pires C. Axial Diffusivity of the Corona Radiata at 24 Hours Post-Stroke : A New Biomarker for Motor and Global Outcome. PLoS One. 2015;1–16.
47. Boukadi M, Marcotte K, Bedetti C, Houde J-C, Desautels A, Deslauriers-Gauthier S, et al. Test-retest reliability of diffusion measures extracted along white matter language fiber bundles using HARDI-based tractography. Front Neurosci. 2019;12:1055.
48. Pedersen PM, Vinter K, Olsen TS. Aphasia after stroke: type, severity and prognosis. The Copenhagen aphasia study. Cerebrovasc Dis. 2004;17(1):35–43. 49. Xing S, Lacey EH, Skipper-Kallal LM, Jiang X, Harris-Love ML, Zeng J, et al.
Right hemisphere grey matter structure and language outcomes in chronic left hemisphere stroke. Brain. 2016;139(1):227–41.
50. Yang M, Yang P, Fan Y-S, Li J, Yao D, Liao W, et al. Altered Structure and Intrinsic Functional Connectivity in Post-stroke Aphasia. Brain Topogr. 2018;31(2):300–10.
51. Zavanone C, Samson Y, Arbizu C, Dupont S, Dormont D, Rosso C. Critical brain regions related to post-stroke aphasia severity identified by early diffusion
imaging are not the same when predicting short- and long-term outcome. Brain Lang. 2018 Nov 1;186:1–7.
52. Schlaug G. Even when right is all that’s left: There are still more options for recovery from aphasia. 2018;83(4):661–3.
53. Saur D, Lange R, Baumgaertner A, Schraknepper V, Willmes K, Rijntjes M, et al. Dynamics of language reorganization after stroke. Brain. 2006;129(Pt 6):1371–84.
54. Wan CY, Zheng X, Marchina S, Norton A, Schlaug G. Intensive therapy induces contralateral white matter changes in chronic stroke patients with Broca’s
aphasia. Brain Lang. 2014;136:1–7.
55. Van Hees S, McMahon K, Angwin A, De Zubicaray G, Read S, Copland DA. Changes in white matter connectivity following therapy for anomia post stroke. Neurorehabil Neural Repair. 2014;28(4):325–34.