HAL Id: hal-02925043
https://hal.archives-ouvertes.fr/hal-02925043
Submitted on 28 Aug 2020
HAL is a multi-disciplinary open access
archive for the deposit and dissemination of
sci-entific research documents, whether they are
pub-lished or not. The documents may come from
teaching and research institutions in France or
abroad, or from public or private research centers.
L’archive ouverte pluridisciplinaire HAL, est
destinée au dépôt et à la diffusion de documents
scientifiques de niveau recherche, publiés ou non,
émanant des établissements d’enseignement et de
recherche français ou étrangers, des laboratoires
publics ou privés.
Fully automatic CNN-based segmentation of retinal
bifurcations in 2D adaptive optics ophthalmoscopy
images
Iyed Trimeche, Florence Rossant, Isabelle Bloch, Michel Pâques
To cite this version:
Iyed Trimeche, Florence Rossant, Isabelle Bloch, Michel Pâques. Fully automatic CNN-based
segmen-tation of retinal bifurcations in 2D adaptive optics ophthalmoscopy images. International Conference
on Image Processing Theory, Tools and Applications (IPTA 2020), Nov 2020, PARIS, France.
�hal-02925043�
Fully automatic CNN-based segmentation of retinal
bifurcations in 2D adaptive optics ophthalmoscopy
images
Iyed Trimeche, Florence Rossant
Institut Sup´erieur d’Electronique de Paris (ISEP) France
iyed.trimeche@isep.fr, florence.rossant@isep.fr
Isabelle Bloch
LTCI, T´el´ecom Paris, Institut Polytechnique de Paris France
isabelle.bloch@telecom-paris.fr
Michel Paques
Centre Hospitalier National d’Ophtalmologie des Quinze-Vingts, INSERM DHOS, Clinical Investigation Center 1423 Paris, France
mpaques@15-20.fr
Abstract—Automated image segmentation is a crucial step to characterize and quantify the morphometry of blood vessels. Adaptive Optics Ophthalmoscopy (AOO) images of eye fundus allow visualizing retinal vessels with a high resolution, espe-cially arterial bifurcations, suitable to morphometric biomarkers measurements. In this paper, we propose a fully automatic hybrid approach based on a modified U-Net convolutional neu-ral network and active contours for segmenting retinal vessel branches and bifurcations with high precision. The obtained segmentation results are within the range of intra-and inter-user variability, and meet the performance of our previous semi-automatic approach in terms of precision and reproducibility, while being obtained in a completely automatic way.
Index Terms—Convolutional neural networks, segmentation, retinal vessels, adaptive optics ophthalmoscopy images.
I. INTRODUCTION
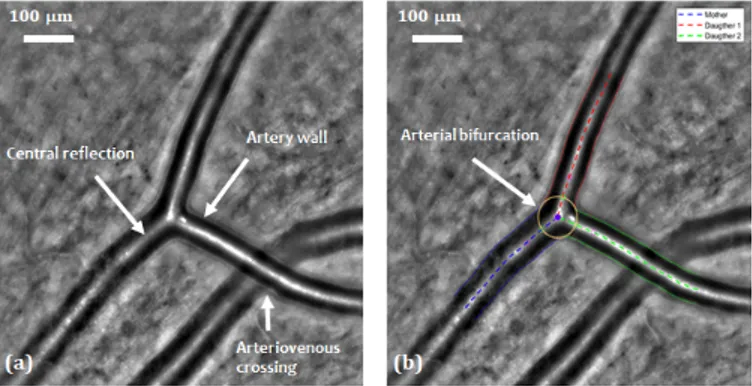
This study is part of a project which aims at determining the effect of some pathologies affecting blood flow in small vessels, particularly within the brain [1]. Knowing that retinal vessels are related to cerebral vessels and that they share many structural, functional and pathological features, retinal vessels may be considered in many ways as substitutes for the cerebral vessels in clinical studies. Moreover, retinal vessels are easily observable thanks to their planar arrangement and to dedicated high resolution imaging systems, such as Adaptive Optics Ophthalmoscopy (AOO) (Figure 1(a)). This recent and non-invasive technique has a better resolution than classical eye fundus imaging and enables us to observe microstructures such as photoreceptors, capillaries and vascular walls.
The effect of diseases on the retinal vascular tree can be determined by measuring morphometric biomarkers at the bifurcations in AOO images, for both healthy and pathological subjects. In fact, many biomarkers based on Murray’s law [2] can describe relationships between the lumens (i.e. diameters)
This research has been partially funded by a grant from the French Agence Nationale de la Recherche ANR-16-RHUS-0004 (RHU TRT cSVD).
of bifurcating blood vessels and thus characterize blood circu-lation. Deviations from Murray’s optimality have been related to some pathologies such as stroke [3], diabetes [4] and high blood pressure [5]. In some cases, these deviations can also reflect the progress of the pathology. However, large clinical studies performed on AOO images require automatic algo-rithms for segmenting retinal vessels efficiently and calculating biomarkers precisely.
Fig. 1: AOO image. (a) Retinal arterial bifurcation and arte-riovenous crossing. (b) Segmentation of the arterial bifurca-tion [6], [7].
This paper presents an extension of our previous work [6], [7] in which we proposed automatic and semi-automatic methods to segment vessels in AOO images acquired with a RTX 1 system. In [6] we presented a fully automatic algorithm to detect artery branches and delineate the arterial wall by four curves approximately parallel to a common reference line placed on the central reflection. The segmentation is based on a parametric active contour model which imposes an approximate parallelism between the curves to be more robust to noise, blur and lack of contrast. The approach reaches a high accuracy when the central reflection is well detected and the active contour model correctly initialized. Then, building
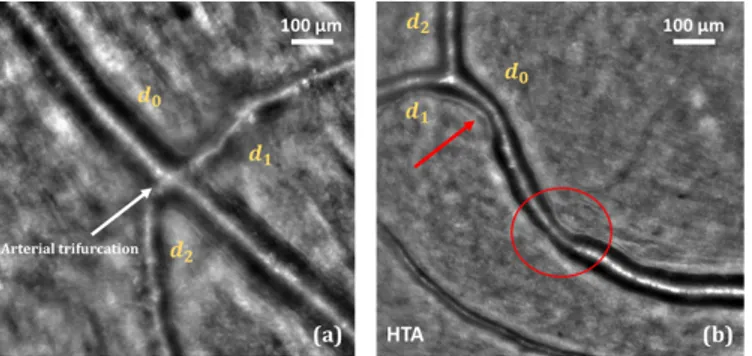
on this first segmentation, we proposed an additional step to segment accurately the arterial bifurcations [7]. This step takes as input the segmentation of the three branches involved in the birfurcation and outputs the precise delineation of the lumen at the bifurcation, thanks to another parametric active contour model which adapts itself to the geometry of each bifurcation (Figure 1(b)). Biomarkers characterizing vessels and bifurcations can then be automatically calculated, and all this framework, called AOV, has been already used to perform several medical studies [8]. However, the main weakness of the proposed method comes from the first steps related to the ves-sel detection and then the initialization of the parallel snakes. Both are not reliable enough, especially in some particular cases with arteriovenous crossings (Figure 1(a)), pathological vessels with large irregularities (Figure 2(b)) and vessels with “trifurcations” (Figure 2(a)). For this reason, medical experts use AOV in a semi-automatic way: they manually define the vessel branches and bifurcations to be segmented by putting points on the corresponding central reflections; they can also correct the initialization of the parallel snakes. However, there is a need for more automation.
Fig. 2: Some cases where segmentation is difficult. (a) Arterial “trifurcation”. (b) Strong irregularity due to hypertension.
To this end, we present in this paper a hybrid method, based on a modified U-Net deep convolutional neural network architecture [9] and our active contour model under parallelism constraint. The network enables us to get automatically a binary mask of the vessel lumens, from which we detect the vessel branches and initialize our active contour models. This paper focuses on the proposed deep neural network and presents a quantitative evaluation of the segmentation results and biomarker estimates.
II. STATE OF THE ART
Most of the retinal vessel segmentation methods were applied on conventional fundus images. However, to the best of our knowledge, there is not yet a fully automatic and reliable algorithm for retinal vessel segmentation in AOO images. Convolutional neural networks (CNN) are widely used for segmentation in medical imaging. Ronneberger et al. [9] introduced the first CNN dedicated to such tasks, which is known as U-Net. The concatenation of the high and low-resolution features in U-Net allows the network to produce a more precise output. Since then, this network has been used
to segment retinal vessels in classic fundus images. Lepetit-Aimon et al. [10] have redesigned the central stage of the U-Net network (the deepest stage, between the encoding and decoding branches) by integrating a Fire-Squeeze structure which was proposed originally by Iandola et al. [11] to reduce the size of the Alex-Net model [12] without loss of performance. This stage allows the characteristics to be broken down into three convolutional layers. Each layer applies a mask of different size (1 × 1, 3 × 3 and 5 × 5). The obtained features are then recombined by a 1 × 1 convolution. Li et al. [13] proposed a U-Net architecture redesigned by residual blocks called MResU-Net. This residual pre-activation block which was recommended in [14] contains two convolutional layers, and includes, before each of them, a batch normal-ization layer (BN) and a ReLU function. The MResU-Net architecture allows for the combination of local information and global functionality, which is useful for improving the detection of vessel contours. This is done by concatenating the outputs of certain residual blocks in the encoding and decoding branches. The proposed algorithm outperforms current state-of-the-art methods on the publicly available DRIVE [15] and STARE [16] datasets in terms of sensitivity, F1-score, G-mean and AUC. Nevertheless, this architecture does not provide an accurate segmentation in AOO images (see our experimental results in Table I).
Limits of the proposed methods, when applied on AOO images, come from the difference in resolution (about 10 to 20 µm/pixel in standard eye fundus images, and about 1 to 2 µm/pixel for RTX 1 AOO images). More importantly, retinal vessels have an almost constant overall shape and section in eye fundus images and a large field of view. By contrast, AOO images have a smaller field of view, exploring a small and random region of the eye fundus, in which we cannot know the number of vessels nor their size and orientation, which are highly variable. With these characteristics, AOO images will generate coarser feature maps, impacting the segmentation precision (e.g. unclear delineation of the vessels at the pixel level, blob-like shapes); we have also a class imbalance problem (vessels/background).
To account for the specificities of the AOO images, and to achieve an accurate and automatic segmentation, we propose a new fully automatic approach based on three steps: (1) extracting the vessel mask using an adapted U-Net architecture and an adequate learning strategy; (2) applying an active contour approach to refine and regularize the segmentation; (3) extracting vessel diameters and computing biomarkers. These steps are described in Section III, which is the key contribution of this paper. Results are illustrated and discussed in Section IV.
III. CNNMODEL TO GENERATE A RETINAL VESSELS MASK
A. Model Architecture
In this work, we use the deep neural network U-Net as a base model. The convolution blocks of the original architecture are replaced by the feature extractor from the
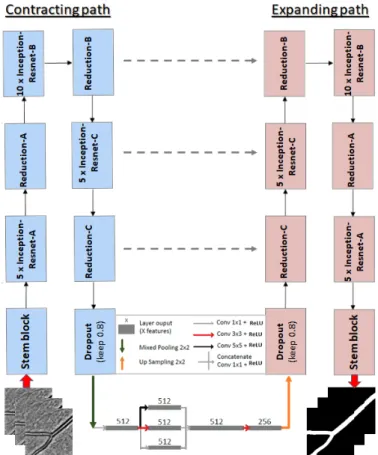
InceptionResNetV2 network [17] (without the last dense lay-ers). The benefit of the InceptionResNetV2 network in our case is that the blocks of this model integrate filters of different sizes at every level. This is useful to better handle the different sizes of vessels in the same AOO image, and therefore we can expect a better robustness to this type of variability. In addition, its variety of receptive fields and short-cut connections showed remarkable results in both processing time and performance [17]. Moreover, we have added a Fire-squeeze block to the central stage of the U-Net (Bottleneck) as suggested in [10]. This block replaces 3 × 3 filters with 1 × 1 filters (Squeeze layer), decreasing the number of input channels to the next layer. Thus, we integrate a structure that breaks up the characteristics into three convolutional layers each applying a mask of different size (1 × 1, 3 × 3 and 5 × 5) and then recombines them by a 1 × 1 convolution. According to [11] and due to the delayed downsampling, this will produce larger activation maps which can lead to higher classification accuracy. We will show that this structure indeed improves the performance of our model (see Table I). The complete network is shown in Figure 3.
Fig. 3: Proposed architecture, building on U-Net and Incep-tionResNetV2, and including a Fire-squeeze structure at the bottleneck.
B. Loss function
The loss function used to train the network is the Dice similarity coefficient (DSC), which measures the agreement
between the model prediction (segmentation) P and the refer-ence segmentation Q:
DSC = 2|P ∩ Q|
|P | + |Q| (1) Another usual loss function is the binary cross-entropy. However, the results using this function were consistently worse than those resulting from the DSC, and therefore only the DSC is used in the results described next.
C. Training strategy
We trained the proposed model on our own dataset with 1440 × 1440 pixels images after normalizing pixel intensities. The dataset was acquired at the Clinical Investigation Center, Quinze-Vingts Hospital, with the RTX 1 adaptive optics cam-era. To ensure the capability of our model to segment precisely all types of vessels, we have imposed the following criteria to build our learning dataset: (1) a balanced number of arteries and veins; (2) a balanced number of sharp images and blurred images; (3) presence of arteriovenous crossings; (4) presence of arterial bifurcations and venous confluences; (5) presence of healthy and pathological vessels (diabetic, hypertensive, CADASIL). This way, our network will be able to cope with the great variability of size and morphology of retinal vessels in AOO images.
Among the total dataset of 65 images, 30 raw images which met the criteria mentioned above were selected to train the network (training set), 5 images were selected as the validation set and 30 other images sharing the same characteristics were selected for the testing set. Annotated data were obtained using the manual mode of AOV software [6] and the delineation of the lumens (i.e. internal contours of the vessels) was carried out by experts. Afterwards we extracted the entire internal section of the vessels to get the reference segmentations as shown in Figure 4(b). To increase the amount of training data and to solve the problem of the variability of vessel directions, we implemented data augmentation methods. We first extracted random patches from each image of the learning set (input images and reference segmentations). A patch size of 320 × 320 pixels has been chosen, which can cover a considerable part of the vessels in AOO images. This technique was performed at each epoch, which makes it possible to increase the size of the training data set. In addition, we ap-plied combinations of spatial transformations (horizontal flip, vertical flip, transposition and 90 degree rotations to obtain the original image and the corresponding reference segmentation in all eight directions) and intensity transformations (additive Gaussian noise and random contrast) to the training set. For data augmentation, we used the “Albumentations” library [18]. This allows reducing overfitting during the training phase, maximizing the invariance of the model and reducing the detection of the vessel-like structures in the highly textured background of AOO images.
For the training process, we used transfer learning, which can effectively reduce training time and cope with the limited number of training data. The network was pre-trained on ImageNet [19], and fine-tuning was used.
IV. EXPERIMENTS
The experiments described in this section are conducted as follows: first, the segmentations obtained by the proposed architecture (see Figure 3) and by other networks, Residual U-Net and InceptionResU-Net, are compared. In order to regularize and refine the output of the neural network, we propose to apply our previously proposed active contour method. On the final result, it is finally possible to measure morphometric biomarkers automatically. These measures and the segmentations are compared quantitatively with those obtained from manual and semi-automatic methods [7]. A. Experimental set-up
We used stochastic gradient descent with an adaptive mo-ment estimator (Adam) to train our model [20]. Both up-sampling and down-up-sampling layers are followed by a dropout of 0.2. The initial learning rate was set to 10−4 and was exponentially decayed every 10 epochs. The batch size was set to 24 and each model was trained for 150 epochs. The experiments were implemented in Keras with a Tensorflow backend and we trained our model on an Nvidia TITAN RTX GPU.
B. Vessel mask evaluation
The performance of our model is evaluated by comparing the predicted segmentation P with the corresponding reference segmentation Q, using several indicators, such as the Dice coefficient (DSC in Equation 1) and the boundary F1 metric (BF 1), which calculates the distance between the edges of the vessels in the prediction and in the reference segmentation. Let BP, BQdenote the boundaries of P and Q, respectively. Then
the precision (P r) and the recall (R) are defined as follows:
P r =|B1 P| X x∈BP [[d(x, BQ) < θ]], R = |B1 Q| X x∈BQ [[d(x, BP) < θ]] (2)
where [[a]] = 1 is equal to 1 when statement a is true, and 0 otherwise, d(.) is the Euclidean distance measured in pixels, θ is a predefined threshold on the distance; in all experiments we set θ to 3, corresponding to the acceptable error for clinicians. The distance from a point x to a set B is classically computed as miny∈Bd(x, y). The BF1-score is defined as:
BF 1 = 2P r.R
P r + R (3) and represent the harmonic mean of the distance from BP to
BQ and the distance from BQ to BP.
We applied our training strategy on three different archi-tectures with the same loss function and hyperparameters. We evaluate the performances by comparing our results with the corresponding reference segmentations. Results are shown in Table I.
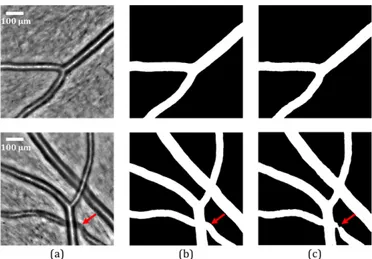
According to Table I, our architecture (U-Net + Inception-ResNetV2+ Fire-squeeze) has an overall high level of precision and it obtains the highest results in terms of recall, DSC and BF1-score. Thus, it will be used as the main architecture in the sequel. Figure 4 shows two examples, with the input image (a),
TABLE I: Evaluation of the segmentation obtained with the proposed strategy and Residual U-Net, InceptionResU-Net, and the proposed InceptionRes U-Net with Fire-squeeze.
Precision Recall DSC BF1-score Residual U-Net 0.96 0.83 0.89 0.89 InceptionResU-Net 0.98 0.88 0.93 0.92 InceptionResU-Net + Fire-squeeze 0.97 0.96 0.96 0.96
the reference mask (b) and the mask predicted by the proposed model (c).
Fig. 4: Segmentation results of our model. (a) Original AOO images. (b) Corresponding reference segmentations. (c) Vessel masks predicted by our U-Net + InceptionResNetV2 + Fire-squeeze architecture. The red arrows indicate where local improvement is needed.
The results in Figure 4(c) show that our model is capable of extracting the vessels in AOO images, including simple arteries, simple veins, simple bifurcations and arteriovenous crossings. However, the detection of arteriovenous crossings is not always accurate (Figure 4(c)) and sometimes not con-sistent. In addition, when the image presents a small vessel that is not planar enough in the eye fundus, the black area between the central reflection and the vessel lumens becomes gray. Thus, the vessel will be classified partially as background. This particular case is illustrated in Figure 5.
Fig. 5: Particular case of partial vessel detection. In our testing set of 30 images, we obtained 28 masks with a complete detection (93.3%) against 2 with a partial one as in Figure 5. Visually speaking, the segmentation is good for these 28 images. However, the precision level is not always sufficient
to calculate the biomarkers with high accuracy, particularly at arterial bifurcations (see CN NM ask results in Table III).
Therefore, we propose in the following subsection a post-processing method to refine and regularize the contours of the vessels, extract the diameters and calculate the morphometric biomarkers.
C. Vessel contours refinement and regularization
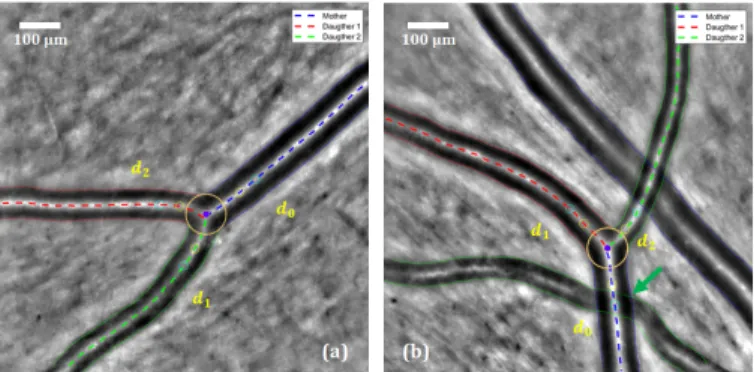
The median lines of the segmentation mask are calculated through morphological operations and the main branches are extracted after the automatic analysis of the branch points. So, the structure of the vascular tree is fully recovered, with birfurcations and arteriovenous crossings, all branches being labeled. The classical parametric active contour model [21] is initialized with the center line of each branch and applied to a Tophat image to match the central reflections, as in our pre-vious work [6]. Then the inner borders of the vessel branches are extracted from the segmentation mask, and the parallel active contour model [22] is applied to refine and regularize the segmentation. The two last steps, i.e. the segmentation of the outer borders and the segmentation of the bifurcation, follow the same methodology as the one described in [6] and [7] respectively, as well as the computation of the biomarkers (see next subsection). Figure 6 shows the final fully automatic segmentation of arterial bifurcations on two images. The result on the right is obtained on the same image as in Figure 4, and illustrates the improvement achieved with the refinement and regularization step.
Fig. 6: Final segmentation of an arterial bifurcation on two examples. The green arrow indicates the improvement with respect to the result in Figure 4.
D. Quantitative evaluation
We consider again the database of ten images used in our previous work for the quantitative evaluation [7]. These im-ages were selected by the medical experts to take into account image quality and morphology variability encountered in clin-ical routine. Three physicians (P hysj) delineated manually
the lumen at the birfurcation and five images were processed twice by each physician to study the intra-expert variability. We will evaluate the accuracy of the final segmentation by calculating mean squared errors (MSE) between the automatic and manual delineations. We will also evaluate the quality of
biomarker estimates, by comparing measures obtained from the manual segmentations and from the automated ones.
Arterial bifurcation morphometry can be evaluated by mea-suring biomarkers derived from Murray’s law [2]. The most known is the junction exponent x. Denoting by d0 the parent
diameter, and d1and d2 the child diameters, this biomarker is
defined by:
dx0 = dx1+ dx2 (4) Murray stated that x = 3 for an ideal bifurcation. However, solving Equation 4 may lead to negative values of x. This may happen in particular for pathological subjects [3], in cases not considered here. Therefore, we have selected another biomarker, that is derived from the asymmetry coefficient λ = d2/d1 (d2 < d1) and the branching coefficient, defined
by:
βdev= βoptimal− βmeasured (5)
where βmeasured is given by:
βmeasured= d2 1+ d22 d2 0 = 1 + λ 2 (1 + λx)2/x (6)
and the optimal branching coefficient βoptimalis given by the
right hand side of Equation 6 with x = 3. The biomarker βdev
is always calculable and provides information on the deviation to Murray’s law optimum.
In practice, we estimate the branch diameters in regions derived from the largest circle inscribed in the bifurcation (i.e. tangent to the segmentation), similarly to [23]. Let us denote by Rbthe radius of this circle. The measurement region starts
at a distance equal to one radius Rbfrom the intersection point
between the circle and the central reflection, up to 2Rb. We
calculate the median of the diameters measured in this region (more robust to outliers than the mean value).
In our quantitative evaluation, we evaluate the accuracy of the segmentation on the circular region of radius 4Rb
centered on the bifurcation. We consider the three curves that delineate the lumen at this bifurcation, and we calculate the mean squared error (MSE) between the manual and the automatic curves. Branch diameters and biomarkers are also calculated from both the manual and automatic segmentations, and compared. We denote by δd0,1,2, δβdev and δx the
measured differences (averaged over the three branches for the diameters). The results are then averaged over the test cases to obtain mean and standard deviation values. Note that one image has been excluded from the evaluation, compared to [7], because it has an incomplete vessel mask due to a small and poorly contrasted branch in the bifurcation (case presented in Figure 5). So, for the sake of comparison, all numerical results come from the 9 other images. Table II shows the intra-expert variability measured from the five segmentations realized twice by each expert. The physician P hys3, who obtained the most stable results on the biomarkers, was chosen as reference for the inter-experts and software/expert variability study. Table III summarizes the results obtained with the semi-automatic method [7] (sof tware1), from the CNN binary mask (without refinement and regularization of the boundaries
by the active contour models, CN NM ask) and with the fully
automatic method presented in this article (sof tware2). TABLE II: Intra-expert variability (MSE and diameters ex-pressed in pixels).
MSE δd0,1,2 δβdev δx
P hys1 2.43 ± 0.90 +0.84 ± 2.22 0.00 ± 0.09 −0.10 ± 0.49
P hys2 2.80 ± 0.99 −0.62 ± 3.98 0.00 ± 0.11 +0.41 ± 1.24
P hys3 2.04 ± 0.96 −1.18 ± 2.09 +0.01 ± 0.02 +0.07 ± 0.11
TABLE III: Inter-expert variability and software/expert vari-ability. Values are expressed in pixels for MSE and diameters.
Seg/Ref MSE δd0,1,2 δβdev δx
P hys1/P hys3 2.37 ± 0.96 +0.58 ± 3.16 +0.05 ± 0.06 +0.64 ± 1.33
P hys2/P hys3 3.26 ± 1.88 +0.82 ± 6.08 −0.02 ± 0.19 −0.67 ± 2.70
Sof tware1/P hys3 3.14 ± 1.12 +3.20 ± 2.49 +0.03 ± 0.06 +0.18 ± 0.34
CN NM ask/P hys3 5.22 ± 1.93 +7.41 ± 5.66 +0.08 ± 0.15 +1.14 ± 1.70
Sof tware2/P hys3 3.16 ± 1.53 +2.54 ± 4.04 +0.02 ± 0.05 +0.13 ± 0.24
MSE values obtained with the proposed method (sof tware2) are similar to the ones achieved with the previous method (sof tware1) [7] but obtained this time fully automatically thanks to the CNN. The significant gap between the results of CN NM ask and sof tware2 demonstrates the
usefulness of applying the active contour models to refine the vessel lumen delineation. Diameter estimates are slightly better than the previous ones, errors are consistent with the MSE, but there is still a bias revealing a small over-segmentation. Nevertheless, our automatic method reaches the best accuracy regarding the biomarkers, both in terms of mean error and standard deviation. The proposed CNN model enables us to properly initialize our active contour models, so that we obtain accurate final segmentations and biomarker estimates without the need for expert supervision.
V. CONCLUSION
In this paper, we proposed a cascade of a neural network, based on a new architecture accounting for the size variability of vessels, and active contours to achieve a completely auto-matic segmentation of retinal blood vessels in adaptive optics images. The benefit of the neural network is to provide a first automatic segmentation (once the network is trained), which is combined with the regularization and precision features of the active contours. Results show that the method meets medical requirements in terms of reproducibility and precision, and allows deriving useful biomarkers for further medical analysis. Future work aims at improving the extraction of masks for arteriovenous crossings and poorly contrasted small vessels, and at classifying arteries and veins.
REFERENCES
[1] H. Chabriat, A. Joutel, M. Dichgans, E. Tournier-Lasserve, and M.-G. Bousser, “Cadasil,” The Lancet Neurology, vol. 8, no. 7, pp. 643–653, 2009.
[2] C. D. Murray, “The physiological principle of minimum work: I. the vascular system and the cost of blood volume,” Proceedings of the National Academy of Sciences, vol. 12, no. 3, pp. 207–214, 1926. [3] N. W. Witt, N. Chapman, S. A. McG. Thom, A. V. Stanton, K. H. Parker,
and A. D. Hughes, “A novel measure to characterise optimality of diameter relationships at retinal vascular bifurcations,” Artery Research, vol. 4, no. 3, pp. 75–80, 2010.
[4] T. Luo, T. J. Gast, T. J. Vermeer, and S. A. Burns, “Retinal vascular branching in healthy and diabetic subjects,” Investigative Ophthalmology & Visual Science, vol. 58, no. 5, pp. 2685–2694, 2017.
[5] N. Chapman, N. Witt, X. Gao, A.A. Bharath, A.V. Stanton, S.A. Thom, and A.D. Hughes, “Computer algorithms for the automated measurement of retinal arteriolar diameters,” British Journal of Ophthalmology, vol. 85, no. 1, pp. 74–79, 2001.
[6] N. Lerm´e, F. Rossant, I. Bloch, M. Paques, E. Koch, and J. Benesty, “A fully automatic method for segmenting retinal artery walls in adaptive optics images,” Pattern Recognition Letters, vol. 72, pp. 72–81, 2016. [7] I. Trimeche, F. Rossant, I. Bloch, and M. Paques, “Segmentation
of retinal arterial bifurcations in 2D adaptive optics ophthalmoscopy images,” in IEEE International Conference on Image Processing (ICIP), 2019, pp. 1490–1494.
[8] M.-H. Errera, M. Laguarrigue, F. Rossant, E. Koch, C. Chaumette, C. Fardeau, M. Westcott, J. Sahel, B. Bodaghi, J. Benesty, and M. Paques, “High-resolution imaging of retinal vasculitis by flood illu-mination adaptive optics ophthalmoscopy: A follow-up study,” Ocular Immunology and Inflammation, pp. 1–10, 2019.
[9] O. Ronneberger, P. Fischer, and T. Brox, “U-net: Convolutional networks for biomedical image segmentation,” in Medical Image Computing and Computer-Assisted Intervention (MICCAI). Springer, 2015, pp. 234–241. [10] G. Lepetit-Aimon, R. Duval, and F. Cheriet, “Large receptive field fully convolutional network for semantic segmentation of retinal vasculature in fundus images,” in First International Workshop, COMPAY 2018, and 5th International Workshop, OMIA 2018, Held in Conjunction with MICCAI, 2018, pp. 201–209.
[11] F. Iandola, S. Han, M. Moskewicz, K. Ashraf, W. Dally, and K. Keutzer, “SqueezeNet: AlexNet-level accuracy with 50x fewer parameters and <0.5MB model size,” ArXiv 1602.07360, 2016.
[12] A. Krizhevsky, I. Sutskever, and G. Hinton, “ImageNet classification with deep convolutional neural networks,” Neural Information Process-ing Systems, vol. 25, 2012.
[13] D. Li, D. A. Dharmawan, B. P. Ng, and S. Rahardja, “Residual U-Net for retinal vessel segmentation,” in IEEE International Conference on Image Processing (ICIP), 2019, pp. 1425–1429.
[14] K. He, X. Zhang, S. Ren, and J. Sun, “Deep residual learning for image recognition,” in IEEE Conference on Computer Vision and Pattern Recognition, 216, pp. 770–778.
[15] J. Staal, M. D. Abramoff, M. Niemeijer, M. A. Viergever, and B. van Ginneken, “Ridge-based vessel segmentation in color images of the retina,” IEEE Transactions on Medical Imaging, vol. 23, no. 4, pp. 501–509, 2004.
[16] A. D. Hoover, V. Kouznetsova, and M. Goldbaum, “Locating blood vessels in retinal images by piecewise threshold probing of a matched filter response,” IEEE Transactions on Medical Imaging, vol. 19, no. 3, pp. 203–210, 2000.
[17] C. Szegedy, S. Ioffe, V. Vanhoucke, and A. Alemi, “Inception-v4, Inception-ResNet and the impact of residual connections on learning,” AAAI Conference on Artificial Intelligence, pp. 4278–4284, 2017. [18] A. Buslaev, A. Parinov, E. Khvedchenya, V. Iglovikov, and A. Kalinin,
“Albumentations: fast and flexible image augmentations,” Information, vol. 11, no. 2, pp. 125–144, 2020.
[19] J. Deng, W. Dong, R. Socher, L. Li, K. Li, and L. Fei-Fei, “ImageNet: A large-scale hierarchical image database,” in IEEE Conference on Computer Vision and Pattern Recognition, 2009, pp. 248–255. [20] D. Kingma and J. Ba, “Adam: A method for stochastic optimization,”
in International Conference on Learning Representations, 2015. [21] M. Kass, A. Witkin, and D. Terzopoulos, “Snakes: Active contour
models,” International Journal of Computer Vision, vol. 1, no. 4, pp. 321–331, 1988.
[22] F. Rossant, I. Bloch, I. Ghorbel, and M. Paques, “Parallel double snakes. Application to the segmentation of retinal layers in 2D-OCT for pathological subjects,” Pattern Recognition, vol. 48, pp. 3857–3870, 2015.
[23] S. Ramcharitar, Y. Onuma, J.-P. Aben, C. Consten, B. Weijers, M.-A. Morel, and P. W Serruys, “A novel dedicated quantitative coronary analysis methodology for bifurcation lesions,” EuroIntervention: Journal of EuroPCR in collaboration with the Working Group on Interventional Cardiology of the European Society of Cardiology, vol. 3, no. 5, pp. 553–557, 2008.