Adsorption and structure formation of the weak polyelectrolytic diblock
copolymer, PVP-b-PDMAEMA
Boris Mahltig(1), Jean-François Gohy(2), Sayed Antoun(2), Robert Jérôme(2), Manfred Stamm(1)
(1)
Institut für Polymerforschung Dresden, e.V., Hohe Straße 6, D-01069 Dresden, Germany
(2)
Centre for Education and Research on Macromolecules, University of Liège Sart-Tilman B6, B-4000 Liège, Belgium
Abstract
This paper reports on the pH-dependent adsorption of weak the polyelectrolytic diblock copolymer poly(2-vinylpyridine)-block-poly(dimethylaminoethyl metha-crylate), (PDMAEMA). Aqueous
PVP-b-PDMAEMA solutions have been adsorbed on alkaline pretreated silicon substrates. Altogether two copolymers differing in block ratio and molecular weight were used for the investigations. While the electrical charge of both samples in solution was investigated by electrophoretic measurements, the adsorbed polymer layers were studied with ellipsometry and atomic force microscopy (AFM). Depending on pH the electrical charge of both blocks of the diblock copolymer varied. Three different regimes have been identified. Under acidic conditions at pH < 5, both blocks are mainly positively charged. At medium pH between 5 and 8, only the PDMAEMA block is positively charged. At pH > 8, both blocks are nearly uncharged and a polymer precipitation occurred in solution. Each of these pH regimes was characterized by a specific adsorption behaviour leading to two adsorption maxima at acidic and alkaline pH values, while at medium pH a plateau in the adsorbed amount was observed. Moreover, the structures of the polyelectrolytes formed on the substrate after adsorption were specific to each of the three pH regimes.
Keywords: Polyelectrolytes - Adsorption - Ellipsometry - AFM - Diblock copolymers
1. Introduction
Polyelectrolytes and their adsorption behaviour have been of high scientific interest in the last few years [1-3]. In addition to the considerable experimental work on this topic [4-6], the theoretical description of polyelectrolytes in solution and at interfaces has increased drastically in the literature [7-11]. Those scientific efforts were reflected in technological applications of polyelectrolytes, for example in dewatering of industrial sludges, the pigmentation of powder coatings or the removal of mineral particles [12-14].
Many groups report on the adsorption behaviour of diblock copolymers [15-18]. It has to be distinguished between different types of diblock copolymers with respect to their differences in adsorption behaviour. At first there are uncharged diblock copolymers with a hydrophilic and a hydrophobic block dissolved in organic solutions [3, 19-20]. For these systems it was stated that the hydrophilic block acts as an anchor block during adsorption onto a hydrophilic substrate, while the hydrophobic block is placed away from the substrate surface. One of the most frequently investigated system belonging to this family is the poly(2-yinylpyridine)-block-polystyrene [16-18, 21-23]. In addition to the adsorption in a brush-like structure, the formation of highly ordered surface micelles or surface stripes has been reported [17, 24].
The adsorption of diblock copolymers containing one permanently charged block and one hydrophobic block has also been reported in organic solvents [25]. These polymers with one polyelectrolytic block act similar to uncharged systems containing an uncharged hydrophilic block. For the adsorption in aqueous media, on the other hand, double hydrophilic block copolymers are ideal candidates. These copolymers are formed from a
polyelectrolyte block which acts as anchor to a hydrophilic substrate, while the other non-ionic or polyelectrolyte block is placed away from the substrate surfaces.
The adsorption of diblock polyelectrolytes with pH-dependent charged blocks has been intensively discussed in the last few years [26-29]. One has to distinguish between polymer systems consisting of blocks with charges of the same sign [27, 28] and those with oppositely charged blocks [29-32], which have been referred to as block polyampholytes. This paper will report the adsorption of poly(2-vinylpyridine)-block-poly(dimeth-ylaminoethyl methacrylate), (PVP-b-PDMAEMA), from aqueous solution as a function of block sizes and pH. In this case, the degree of ionisation of both polymer blocks is strongly dependent on the pH of the aqueous polymer solution. Therefore a dramatic influence of pH on the adsorption behaviour should be expected. Indeed, the pH-dependent formation of micelles was reported in similar polymer systems [28, 33-35].
A recent study by Styrkas et al. [28] on a polymer containing one permanent and one pH-dependent positively charged block indicates the adsorption of whole preformed micelles directly from solution. A more complex
adsorption behaviour is expected to be observed for PVP-b-PDMAEMA. Moreover, the adsorption should be strongly influenced by pH.
2. Experimental
2.1. Polymers and sample preparation.
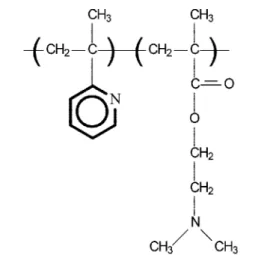
The adsorption experiments were performed with the weak polyelectrolyte poly(2-vinylpyridine)-block-poly (dimethylaminoethyl methacrylate), (PVP-b-PDMA-EMA) (Fig. 1). Diblocks of different block ratio and molecular weight were used (Fig. 1). The molecular characteristics of the used PVP-b-PDMAEMA copolymers are shown in Table 1. Both poly-electrolytes were synthesized by a sequential living anionic polymerisation process, as described elsewhere [35]. The characterization of the copolymers was performed with size exclusion chromatography (SEC) and H NMR spectroscopy, respectively [35].
All adsorption procedures were carried out from aqueous polymer solutions on alkaline pretreated silicon wafers. These silicon wafers contained a silicon oxide layer of approximately 2 nm thickness. The isoelectric point of this silicon oxide layer after alkaline treatment was determined from streaming potential measurements and was found to be at pHIEP= 3.9 [31].
Fig. 1. The structural units of the investigated polyelectrolyte PVP-b-PDMAEMA Table 1. Polymer characteristics
Polymer Mn [g/mol] PVP [g/mol] PDMAEMA [g/mol] mass density δ [kg/cm3] A 7300 3500 3800 1.3 B 14600 10800 3800 1.25
All adsorption experiments were performed from aqueous polymer solutions. The copolymer concentration was 0.13 g/l PVP-b-PDMAEMA and 0.01 mol/l NaCl was added to the solution. The pH values were varied from 2.8 to 10.7 by the addition of HClaq and NaOHaq in amounts which were small compared to the NaCl concentration.
After setting the pH the silicon substrates were placed into the adsorption solution for at least 10h. This time is long enough to reach equilibrium of adsorption [36]. Afterwards the substrates were removed from the solution, rinsed with MilliQ water and dried with nitrogen.
2.2 .Electrophoretic measurements.
The zeta-potential ζ of the copolymers in solution as a function of pH was determined by elec-trophoretic measurements. For these electrophoretic investigations a commercially available Zeta Sizer 3 (Malvern Instruments, UK) was used. The electrophoretic mobilities were converted to the zeta potential ζ using the Smoluchowski equation [37, 38, 39]. All zeta potential measurements were carried out in aqueous solutions containing 10-3 mol/l NaCl.
2.3. Ellipsometry.
el-lipsometer in a polariser-compensator-sample-analyser (PCSA) arrangement (Multiskop, Optrel Berlin) [40]. An He-Ne laser (λ = 632.8 nm) was used as light source and the incident angle was set to 70°. A multilayer model for a homogeneous layer system was used to calculate the layer thickness d of the adsorbed PVP-b-PDMAEMA layer from the ellipsometric angles Ψ and ∆ [41]. The adsorbed amount A was determined from the layer thickness d measured in air by A = δd, with δ as the mass density of the adsorbed copolymer layer. 2.4. Atomic force microscopy (AFM).
Atomic force microscopy (AFM) was used to investigate the topography of the dried adsorbed polyelectrolyte films. For all measurements a commercially available force microscope (Digital Instruments, Multimode 300) was used. The measurements were performed in the tapping mode to minimize any damage to the sample surface. The resonance frequency of the used silicon cantilevers was set in the range of 300— 315 kHz. 3. Results and discussion
3.1. The solution behaviour
To understand the adsorption behaviour of polyelec-trolytes from aqueous solutions onto a solid/liquid interface it is absolutely necessary to describe first the behaviour of the polyelectrolyte in solution as a function of pH [31]. The charge of the investigated polymer system PVP-b-PDMAEMA in aqueous solution is determined by the pKa values of both polymer blocks. The pKa value of the PVP block was reported to be approximately pKa
(PVP)≈5 and for the PDMAEMA block approximately pKa (PDMAEMA)≈8, respectively [42, 43, 44].
Depending on these pKa values the investigated pH range can be divided into three different regimes. Under
acidic conditions below pH < 5 both blocks are mainly positively charged. At medium pH values between 5 and 8 only the PDMAEMA block is positively charged. Under alkaline conditions with pH values higher than pH > 8 both blocks are nearly uncharged and a polymer precipitation should occur in solution [9, 34].
To understand the difference in solution behaviour between the two investigated PVP-b-PDMAEMA samples, zeta-potential measurements were performed. Also the precipitation behaviour at alkaline pH values was
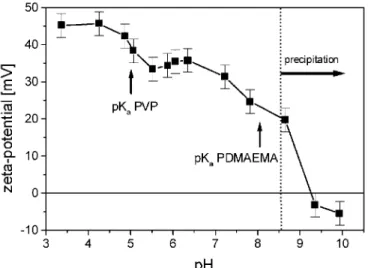
investigated. The zeta-potential of copolymer A with a block ratio of PVP:PDMAEMA of 48:52 showed positive values up to a pH of around 9 (Fig. 2). In the vicinity of the pKa of PVP (pK≈5), no drastic change in the
zeta-potential was observed. Above the pKa(PDMAEMA) of around pH≈8 the zeta-potential decreased significantly
and reached, at pH higher than 9, negative values due to the adsorption of negative ions on the now uncharged polymer. A polymer precipitation was observed for pH values higher than 9, which is quite similar to the behaviour at the pH, where the zeta-po-tential of copolymer A is near zero. Such a precipitation is a quite typical behaviour of weak positive polyelec-trolytes at alkaline pH values [9, 34].
The polyelectrolyte B contains a larger PVP block and a block ratio of PVP:PDMAEMA of 74:26. The zeta-potential in sample B is significantly different from the one previously observed for sample A (Figs. 2 and 3). In case B a decrease in the zeta-potential from + 45 mV to +35 mV was found in the pH region around pH≈5, where pKa of PVP is located. Therefore the uncharging process of the PVP block at pH values around 5 could be
observed via a decrease in the zeta-potential of B. The difference to copolymer A, where the zeta-potential exhibited no such decrease around pH≈5, could be explained by the larger PVP block of B. Another difference in solution behaviour of sample B is that the precipitation starts from pH values up to 8.5, which is considerably lower than that for A with a precipitation starting at pH around 9. This earlier precipitation of B at lower pH could be caused by the larger PVP block and smaller PDMAEMA block of this copolymer. The aggregation behaviour in aqueous solutions of both polyelectrolytes A and B was reported by Gohy et al. in a previous article [35]. Up to pH values of around 5.5 for both polymers aggregates with hydro-dynamic radii of around 70 nm were reported.
Fig. 2. The zeta-potential of the polyelectrolyte A as a function of pH. The pKa-values of PVP (pKa ≈ 5) and
PDMAEMA (pKa ≈ 8) are indicated by arrows. The alkaline pH region where polymer precipitation occurred is
marked with a horizontal arrow
Fig. 3. The zeta-potential of the polyelectrolyte B as a function of pH. The pKa-values of PVP (pKa ≈ 5) and
PDMAEMA (pKa ≈ 8) are indicated with arrows. The alkaline pH region where polymer precipitation occurred
is marked with a horizontal arrow
At pH between 5.5 and the point where the precipitation at alkaline pH starts, hydrodynamic radii of around 35 nm were found in solution of both polyelectrolytes. In sharp contrast to the zeta-potential experiments, the dynamic light scattering study of [35] did not show any substantial difference between PVP-b-PDMAEMA samples of different composition, however.
3.2. pH dependence of the adsorbed amount
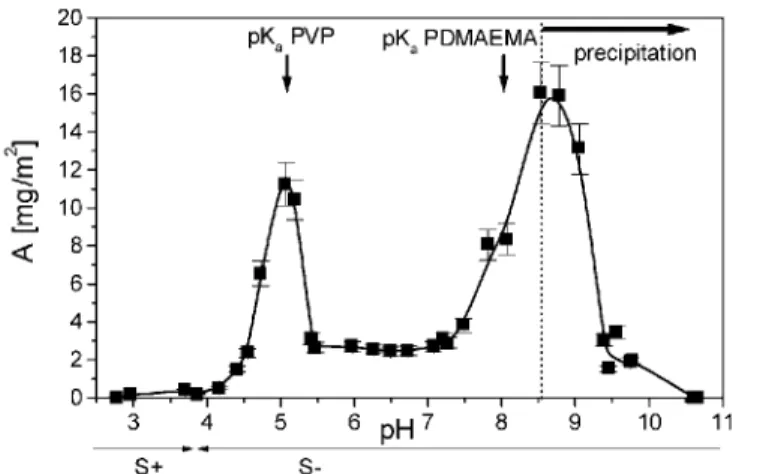
Due to the strong influence of pH on the solution behaviour of copolymers A and B the adsorption of both polyelectrolytes is expected to change as function of pH. In case of copolymer A two adsorption maxima at pH = 5.0 with A = 4.7 mg/m2 and at pH = 9.7 with A = 6.3 mg/m2 were detected. In the pH region from 5.2 up to 8.5 a plateau in adsorption with adsorbed amounts around A≈3 mg/m2 was observed (Fig. 4). An analogous behaviour with two maxima in adsorption was also exhibited by copolymer B but the maxima at pH = 5.1 with A= 11.3 mg/m2 and at pH = 8.5 with A= 16.0 mg/ m2 showed considerably larger adsorbed amounts. Also a plateau in adsorption between pH 5.4 up to 7.3 with adsorbed amounts around A≈3 mg/m2 were detected (Fig. 5). For both polyelectrolytes A and B the adsorption behaviour as function of pH can be divided into four pH regimes determined by the net charges of the polymer blocks and the silicon substrate, respectively. Below pH<3.9 both blocks and the substrate carry a positive net charge. Therefore an electrostatic repulsion between polyelectrolyte and substrate should prevent an adsorption of A and B in this pH range. In this pH range only small adsorbed amounts below 0.5 mg/m2 were observed and could be explained by a hydrophobically driven adsorption process [26, 45]. The second pH range from 3.9 up to values of around pH≈5 is characterized by an increasing negative net charge of the silicon substrate and polyelectrolytes with two positively charged PVP and
PDMAEMA blocks. In this case both polymer blocks experience direct electrostatic attraction to the substrate and therefore the increase in adsorbed amount to the first maximum can be explained.
At pH values higher than 5 the PVP block is nearly uncharged and only the PDMAEMA block remains the positively charged part of the polyelectrolyte. This decrease in total charge also causes a decrease in electrostatic attraction to the substrate and the adsorbed amount is reduced to values of around 3 mg/m2 in the plateau area. When the adsorption behaviour at the acidic maximum of copolymer B is compared to that of copolymer A, the adsorption maximum of B exhibits with A=11.3 mg/m2 more than double the adsorbed amount of B. Also the position of the maximum is shifted to higher values from pH = 5.0 to pH = 5.1.
Fig. 4. The adsorbed amount A of the polyelectrolyte A as a function of pH of the adsorption solution. The pKa
-values of PVP and PDMAEMA are indicated with arrows. The alkaline pH region where polymer precipitation occurred is marked with a horizontal arrow. The arrow below the graph indicates, where the silicon surface is carrying a positive (S +) or a negative net charge (S-)
Fig. 5. The adsorbed amount A of the polyelectrolyte B as a function of pH of the adsorption solution. The pKa
-values of PVP and PDMAEMA are indicated with arrows. The alkaline pH region where polymer precipitation occurred is marked with a horizontal arrow. The arrow below the graph indicates, where the silicon surface is carrying a positive (S +) or a negative net charge (S-)
Both phenomena should be explainable with the larger PVP block of B as compared to A. A larger PVP block exhibits more positively charged groups and the pH, which is necessary to uncharge the PVP block, is shifted to higher pH values. Therefore the adsorption maximum is also shifted to higher pH and an increase in the adsorbed amount should be explained by an increased negative net charge of the silicon substrate at higher pH values. The plateau value between both adsorption maxima is characterized by adsorbed amounts of approximately A≈3 mg/m2. This adsorbed amount is quite similar for both polyelectrolytes. Both polyelectrolytes A and B carry a PDMAEMA block of the same size. In the plateau region only the positively charged PDMAEMA block should determine the adsorption behaviour, which is of identical size for A and B, so a similar behaviour of both polymers in the plateau area could be understandable.
At alkaline pH values a fourth area of adsorption with the second adsorption maximum was observed. At the same time in the polyelectrolyte solution a precipitation was observed at high alkaline pH values. This
precipitation results from the agglomeration of the polyelec-trolyte chains, because of increasing hydrophobic interactions due to the loss in positive charges at higher pH. The adsorption of whole preformed agglomerates directly onto the substrate was reported elsewhere [31] and is quite similar to the adsorption of charged poly-electrolytic complexes [46]. Therefore an analogous adsorption of bigger agglomerates could occur for the investigated polyelectrolytes and would explain the big increase in adsorbed amount to the second alkaline maximum. The electrostatic attraction of the polymer aggregates to the silicon substrates could be explained by a remaining positive charge of the PDMAEMA block. This positive charge of the PDMAEMA block decreases at higher alkaline pH, but even at pH values higher than 10 precipitation was observed. The adsorbed amount, however, decreases due to the decrease in PDMAEMA block charge at higher pH values [26, 27, 28, 30]. In the case of polymer B, the adsorbed amount at the alkaline maximum (A= 16.0 mg/m2) is significantly higher than the one observed at the alkaline maximum of polymer A. Moreover, the pH of maximal adsorption was shifted to lower values of around pH≈8.5 in the case of B. Both phenomena could be explained by the occurrence of precipitation at lower pH in the case of B compared to A.
3.3. The surface topography
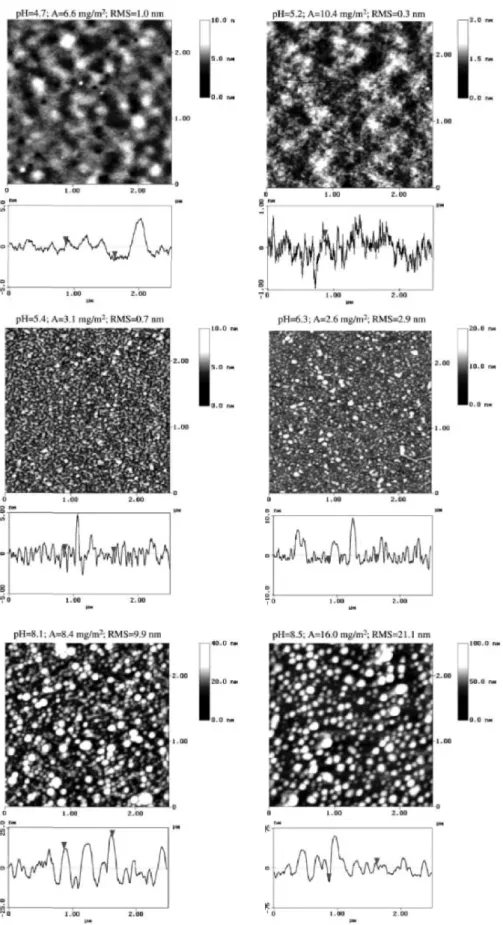
To characterize the surface topography of the adsorbed polyelectrolytes A and B, AFM investigations were performed on dried polymer layers adsorbed in the three different pH regimes: the first acidic maximum, the plateau area and the second alkaline maximum (Figs. 6 and 7). Adsorption performed in these three pH regions results in different surface topographies. Under acidic conditions no regular structures and little roughness were observed. This observation is in contrast with previously reported results which in solution showed the presence of loose aggregates with diameters of approximately 140 nm in this pH regime [35]. Therefore, an adsorption of these aggregates directly from solution under conservation of their structure cannot be confirmed by force microscopy. In this case both blocks carry positive charges and should be strongly attracted to the negatively charged substrate. Therefore the adsorbing structures are expected to collapse during the adsorption process. Topographies with increased roughness were observed in the medium pH regime but the lateral sizes of the adsorbed structures were not of high regularity and not of the same length scale which was determined in solution to approximately 70 nm diameter. Therefore an adsorption of the polyelectrolytic aggregates directly from solution could not be assumed to be the main process driving structure formation in the plateau regime [31]. As reported in the literature for the PS-b-PVP systems [11, 16] the adsorption of the charged anchor PDMAEMA block in direct contact to the substrate should be stated. The other less charged PVP block would be placed away from the substrate and PVP chains aggregate with each other due to hydrophobic interactions [11, 24]. Therefore the structure formation in the plateau region should be mainly driven by the hydrophobic
aggregation of the PVP block, while the positively charged PDMAEMA blocks are placed directly on the silicon substrate [28]. Thus, the structures formed in the adsorbed layer are different to the ones in solution.
While the surface topographies at the acidic maximum and the plateau regime are similar for both poly-electrolytes A and B, the topographies at the alkaline maximum are significant different for both polymers. In case of polymer A no separately adsorbed regular agglomerates were observed. The adsorbed structures were separated from each other by holes with depths of up to 5 nm. Completely different topographies were observed for adsorbed copolymers B at the alkaline maximum. In this case well separated, lateral round structures of heights up to 70 nm were determined. Such a topography is consistent with the adsorption of whole aggregates directly from solution with structure conservation [31], so the adsorption of B aggregates preformed during precipitation in the polymer solution could explain the surface topography of adsorbed B. The difference in topography of the adsorbed polymers A and B at the alkaline maximum could be explained by the higher pH values of around pH≈9.5, where the maximum of A was observed. At higher pH the PDMAEMA block carries a smaller positive charge, so the electrostatic repulsion between the adsorbed structures were decreased and the structures could merge together.
4. Conclusions
This article reports on the adsorption of the weak diblock polyelectrolyte poly(2-vinylpyridine)-block-poly (dimethylaminoethyl methacrylate), (PVP-b-PDMA-EMA). The adsorption experiments were performed from aqueous solutions, where the charges of both polymer blocks PVP and PDMAEMA are strongly dependent on the pH of the polymer solution.
Fig. 6. AFM images of the dried adsorbed polyelectrolyte A on silicon substrates. The adsorption was performed from solutions containing different pH-values. The pH values, the ellipsometrically determined adsorbed amount A and the RMS-roughness are shown directly above the AFM figures. A cut through the AFM image is shown below the images
Fig. 7. AFM images of the dried adsorbed polyelectrolyte B on silicon substrates. The adsorption was performed from solutions containing different pH-values. The pH values, the ellipsometrically determined adsorbed amount A and the RMS-roughness are shown directly above the AFM figures. A cut through the AFM image is shown below the images
Therefore a strong influence of pH on the copolymer structure in solution and the adsorption behaviour has been observed for this copolymer system. Altogether the investigated pH range can be divided into four regimes, each of them being characterized by a specific adsorption behaviour. Under acidic conditions, near the pKa of the PVP
block, a first maximum in adsorption was observed, while a second adsorption maximum was found at pH > 8. Between both maxima a plateau in adsorption appeared with pH independent adsorbed amounts of
approximately A≈3 mg/m2.
In each of these pH regimes, a typical surface topography of the adsorbed polyelectrolytes was observed. In most cases an adsorption of whole polyelectrolytic aggregates directly from solution onto the substrate under
conservation of the aggregate structure in solution was not observed. The aggregates observed in solution reorganize as they come into contact with the substrate. This is certainly due to the fact that strong electrostatic interactions exist between the negatively charged substrate and the positively charged blocks of the copolymers. Acknowledgements
For help during zeta-potential measurements we would like to thank A. Manicke and Dr. C. Bellmann (IPF-Dresden). We are very much indebted to the DFG-Schwerpunkt ‘‘Polyelektrolyte mit definierter
Moleku¨larchitektur’’ (grant Sta 324/5-2) for financial support. JFG and RJ owe many thanks to the ‘‘Services Fédéraux des Affaires Scientifiques, Techniques et Culturelles’’ for financial support in the frame of ‘‘Pôles d'Attraction Interuniversitaires: PAI 4-11: Chimie Supramoléculaire et Catalyse Supramoléculaire’’. JFG acknowledges the European Science Foundation program SUPERNET for support.
References
[1] Förster S, Schmidt M (1995) Adv Polym Sci 120:133 [2] Kudaibergenov SE (1999) Adv Polym Sci 144:115 [3] Cölfen H (2001) Macromol Rapid Commun 22:219 [4] Eirich FR (1977) J Colloid Interface Sci 58:423
[5] Cohen Stuart MA, Fleer GJ, Lyklema J, Norde W, Scheutjens JMHM (1991) Adv Colloid Interface Sci 34:477 [6] van de Steeg HGM, Cohen Stuart MA, de Keizer A, Bijsterbosch BH (1992) Langmuir 8:2538
[7] Hoeve CAJ (1966) J Chem Phys 44:1505
[8] de Gennes PG (1987) Adv Colloid Interface Sci 27:189 [9] Higgs PG, Joanny J-F (1991) J Chem Phys 94:1543 [10] Netz RR, Joanny J-F (1998) Macro-molecules 31:5123
[11] Kramarenko EY, Potemkin II, Khokhlov AR, Winkler RG, Reineker P (1999) Macromolecules 32:3495 [12] Böhm N, Kulicke W-M (1997) Colloid Polym Sci 275:73
[13] Janex ML, Chaplain V, Counord JL, Audebert R (1997) Colloid Polym Sci 275:352 [14] Duivenvoorde FL, van Nostrum CF, van der Linde R (1999) Progr Org Coat 36:225 [15] Siqueira DF, Pitsikalis M, Hadjichristidis N, Stamm M (1996) Langmuir 12:1631 [16] Spatz JP, Möller M, Noeske M, Behm RJ, Pietralla M (1997) Macromolecules 30:3874 [17] Meiners JC, Elbs H, Ritzi A, Mlynek J, Krausch G (1996) J Appl Phys 80:2224
[18] Stamouli A, Pelletier E, Koutsos V, van der Vegte E, Hadziioannou (1996) Langmuir 12:3221 [19] Stamm M, Dorgan JR (1994) Colloid Surf A 86:143
[20] Dorgan JR, Stamm M, Toprakcioglu C, Jérôme R, Fetters LJ (1993) Macromolecules 26:5321 [21] Parsonage E, Tirrell M, Watanabe H, Nuzzo RG (1991) Macromolecules 24:1987
[22] Meiners JC, Ritzi A, Rafailovich MH, Sokolov J, Mlynek J, Krausch G (1995) Appl Phys A 61:519 [23] Ruela Talingting M, Ma Y, Simmons C, Webber SE (2000) Langmuir 16:862
[24] Potemkin II, Kramarenko EY, Khokhlov AR, Winkler RG, Reineker P, Eibeck P, Spatz JP, Möller M (1999) Langmuir 15:7290 [25] Amiel C, Sikka M, Schneider JW, Tsao Y-H, Tirrell M, Mays JW (1995) Macromolecules 28:3125
[26] Hoogeveen NG, Cohen Stuart MA, Fleer GJ (1994) Faraday Discuss 98:161 [27] Hoogeveen NG, Cohen Stuart MA, Fleer GJ (1996) J Colloid Interf Sci 182:133 [28] Styrkas DA, Bütün V, Lu JR, Keddie JL, Armes SP (2000) Langmuir 16:5980 [29] Mahltig B, Gohy J-F, Jérôme R, Stamm M (2001) J Polym Sci B 39:709
[30] Mahltig B, Walter H, Harrats C, Jérôme R, Müller-Buschbaum P, Jérôme R, Stamm M (1999) Phys Chem Chem Phys 1:3853 [31] Mahltig B, Gohy J-F, Jérôme R, Bellmann C, Stamm M (2000) Colloid Polym Sci 278:502
[32] Goloub T, de Keizer A, Cohen Stuart MA (1999) Macromolecules 32:8441 [33] Bütün V, Billingham NC, Armes SP (1997) Chem Commun 671
[34] Lee AS, Gast AP, Bütün V, Armes SP (1999) Macromolecules 32:4302 [35] Gohy J-F, Antoun S, Jérôme R (2002) Macromolecules (accepted)
[36] Walter H, Harrats C, Müller-Buschbaum P, Jérôme R, Stamm M (1999) Langmuir 15:1260 [37] Jacobasch H-J, Simon F, Werner C, Bellmann C (1996) Technisches Messen 63:439 [38] Jacobasch H-J, Simon F, Werner C, Bellmann C (1996) Technisches Messen 63:447 [39] Kortüm G, Braun W (1972) Lehrbuch der Elektrochemie. Verlag Chemie, Weinheim [40] Harke M, Teppner R, Schulz O, Motschmann H, Orendi H (1997) Rev Sci Instrum 68:3130 [41] Azzam RMA, Bashara NM (1987) Ellipsometry and polarized light. North Holland, Amsterdam [42] Martin TJ, Procházka, Munk P, Webber SE (1996) Macromolecules 29:6071
[43] Gohy J-F, Varshney SK, Antoun S, Jérôme R (2000) Macromolecules 33:2000 [44] Patrickios CS, Hertler WR, Abbott NL, Hatton TA (1994) Macromolecules 27:930
[45] Jones RAL, Richards RW (1999) Polymers at surfaces and interfaces. Cambridge University Press, Cambridge [46] Estel K, Kramer G, Schmitt F-J (2000) Colloids Surf A 161:193