The Cryosphere, 7, 583–597, 2013 www.the-cryosphere.net/7/583/2013/ doi:10.5194/tc-7-583-2013
© Author(s) 2013. CC Attribution 3.0 License.
EGU Journal Logos (RGB)
Advances in
Geosciences
Open Access
Natural Hazards
and Earth System
Sciences
Open AccessAnnales
Geophysicae
Open AccessNonlinear Processes
in Geophysics
Open AccessAtmospheric
Chemistry
and Physics
Open AccessAtmospheric
Chemistry
and Physics
Open Access DiscussionsAtmospheric
Measurement
Techniques
Open AccessAtmospheric
Measurement
Techniques
Open Access DiscussionsBiogeosciences
Open Access Open Access
Biogeosciences
DiscussionsClimate
of the Past
Open Access Open Access
Climate
of the Past
Discussions
Earth System
Dynamics
Open Access Open Access
Earth System
Dynamics
DiscussionsGeoscientific
Instrumentation
Methods and
Data Systems
Open Access
Geoscientific
Instrumentation
Methods and
Data Systems
Open Access DiscussionsGeoscientific
Model Development
Open Access Open Access
Geoscientific
Model Development
DiscussionsHydrology and
Earth System
Sciences
Open AccessHydrology and
Earth System
Sciences
Open Access DiscussionsOcean Science
Open Access Open Access
Ocean Science
Discussions
Solid Earth
Open Access Open Access
Solid Earth
DiscussionsThe Cryosphere
Open Access Open Access
The Cryosphere
Discussions
Natural Hazards
and Earth System
Sciences
Open Access
Discussions
An updated and quality controlled surface mass balance dataset for
Antarctica
V. Favier1, C. Agosta1,3, S. Parouty1, G. Durand1, G. Delaygue1, H. Gall´ee1, A.-S. Drouet1, A. Trouvilliez1,2, and G. Krinner1
1UJF-CNRS, LGGE, 54 rue Moli`ere, BP 96, 38402 Saint-Martin-d’ H`eres, France
2IRSTEA, UR ETGR Erosion Torrentielle Neige Avalanches, Domaine universitaire, 2, rue de la Papeterie, 38402 Saint-Martin-d’H`eres, France
3Department of Geography, University of Liege, Belgium
Correspondence to: V. Favier ([email protected])
Received: 31 July 2012 – Published in The Cryosphere Discuss.: 3 September 2012 Revised: 17 February 2013 – Accepted: 8 March 2013 – Published: 3 April 2013
Abstract. We present an updated and quality controlled sur-face mass balance (SMB) database for the Antarctic ice sheet. Importantly, the database includes formatted metadata, such as measurement technique, elevation, time covered, etc, which allows any user to filter out the data. Here, we discard data with limited spatial and temporal representativeness, too small measurement accuracy, or lack of quality control. Ap-plied to the database, this filtering process gives four times more reliable data than when applied to previously available databases. New data with high spatial resolution are now available over long traverses, and at low elevation in some areas. However, the quality control led to a considerable re-duction in the spatial density of data in several regions, par-ticularly over West Antarctica. Over interior plateaus, where the SMB is low, the spatial density of measurements remains high. This quality controlled dataset was compared to re-sults from ERA-Interim reanalysis to assess whether field data allow us to reconstruct an accurate description of the main SMB distribution features in Antarctica. We identified large areas where data gaps impede model validation: ex-cept for very few areas (e.g., Adelie Land), measurements in the elevation range between 200 m and 1000 m above sea level are not regularly distributed and do not allow a thor-ough validation of models in such regions with complex to-pography, where the highest scattering of SMB values is re-ported. Clearly, increasing the spatial density of field mea-surements at low elevations, in the Antarctic Peninsula and in West Antarctica is a scientific priority.
1 Introduction
In the context of global warming, particular attention is being paid to the mass balance of the Antarctic ice sheet (AIS) and its impact on sea level rise (e.g., Lemke et al., 2007; Shep-herd et al., 2012). With a surface area of 12.3 × 10⁶km2, the annual surface mass balance (SMB) of the grounded ice rep-resents a huge mass flux, which is expected to increase in the future leading to a significant compensation of solid ice discharge, and hence to the eustatic sea level rise (e.g., Mon-aghan et al., 2006; Krinner et al., 2008). However, because reliable field information concerning the Antarctic SMB is scarce, the integrated SMB over the continent presents a large uncertainty (between −4.9 ± 0.1 and −5.7 ± 0.3 mm sea level equivalent a−1; Lenaerts et al., 2012b). Thus, it is crucial to aggregate all available field data to better constrain interpolation techniques based on modeling or remote sens-ing data.
Even though several methods have been developed to as-sess the SMB in the field (see Eisen et al., 2008, for a review), direct SMB measurements are rare in Antarctica and exist-ing ones generally span a very local area (e.g., stake and ice core measurements). The size and remoteness of the AIS and the harsh climatic conditions make long-term investigation difficult. All available data have only been compiled once previously by Vaughan and Russell (1997). This Antarctica database (hereafter referred to as V99) was described in de-tail by Vaughan et al. (1999). The V99 database legitimately became a reference for climate studies in Antarctica and was
regularly used for model validation (e.g., Van de Berg et al., 2006; Krinner et al., 2007, 2008; Lenaerts et al., 2012b). However, only partial updates have been undertaken since 1999 (e.g., Magand et al., 2007; Van de Berg et al., 2006; Lenaerts et al., 2012b), even if important new datasets have been acquired since 1999. For instance, during the last inter-national polar year 2007–2008 (IPY), several inland traverses were performed with several scientific goals including fill-ing the gaps in SMB measurements. In the framework of the international TASTE-IDEA programs (Trans-Antarctic Sci-entific Traverse Expeditions – Ice Divide of East Antarc-tica), isolated measurements and traverses were performed, as from Troll station to South Pole (Ansch¨utz et al., 2009), from the Swedish Wasa station to the Japanese Syowa station (Fujita et al., 2011) and along the French traverse to Dome C (Verfaillie et al., 2012).
Based on the V99 database, several authors interpolated the SMB data to the whole AIS. The current surface accu-mulation value integrated over the grounded ice sheet is gen-erally assumed to range between 143 mm w.e. a−1 (Arthern et al., 2006) and 168 mm w.e. a−1(Van de Berg et al., 2006). These two studies are generally considered the most reliable ones: Arthern et al. (2006) computations included interpola-tion methods of remote sensed passive microwave data to ac-curately fit the observed SMB from the V99 database (Mon-aghan et al., 2006), and Van de Berg et al. (2006) calibrated model results. However, these values should be considered with caution because a reliability check of the V99 data, as proposed by Magand et al. (2007), was not performed before interpolating field data. In fact, different problems affect es-timates of the Antarctic SMB, particularly limited or unwar-ranted spatial and temporal coverage and measurements in-accuracy (Magand et al., 2007). Surface measurements bias can strongly affect SMB estimation for the whole Antarc-tica (e.g., Genthon et al., 2009; Lenaerts et al., 2012b). Such a bias was observed by Verfaillie et al. (2012) who identi-fied a serious discrepancy between the SMB of Arthern et al. (2006) and recently updated SMB estimates for Adelie Land. Similar discrepancies were also mentioned from ob-servation of SMB in the Norway–USA traverse (Ansch¨utz et al., 2009, 2011). Further, SMB interpolations (e.g., by pas-sive microwave) may be inaccurate in steep slope terrain, in wind glazed snow areas (Scambos et al., 2012) and in melt-ing snow areas (Magand et al., 2008).
Here, we present an updated SMB database for Antarctica. An important part of the work was documenting and format-ting so-called “metadata” (e.g., time coverage, measurement methods, altitude) which is required when using data, espe-cially to check the quality of the SMB values. In the next Sect. 2, we present this updated database, we describe the improvements in spatial coverage, and compare the data with the V99 dataset (Sect. 2.2). A quality control allows us to reject data considered as unreliable (Sect. 2.3). The impact of this quality control on the spatial distribution of reliable data over Antarctica is discussed in Sect. 2.4. In Sect. 3, we
compare the data with ERA-Interim reanalysis (Simmons et al., 2006), and show the importance of the selected data for climate model validation. The comparison highlights the re-maining gaps in the spatial coverage of surface mass balance data in Antarctica, and the biases that can occur when inter-polating these data. Finally, in Sect. 4, we discuss the main gaps in the SMB database and suggest how to achieve a better estimate of the Antarctic SMB.
2 Description of the SMB database 2.1 Definitions
The surface mass balance (or net accumulation of snow/ice; hereafter referred to as SMB) can be expressed as the balance between the accumulation and ablation terms as follows: SMB = PS+PL−ER − SU − RU (in mm w.e. a−1), (1) where PS, PL, ER, SU and RU are solid precipitation, liquid precipitation, erosion by the wind, sublimation and runoff, respectively. Drifting snow deposition is represented by a negative ER term. Hence SMB is the result of the compe-tition between accumulation and ablation terms. The knowl-edge of erosion or deposition is crucial in windy areas where these processes lead to extremely high spatial variability of SMB values. For instance, in the coastal area of Adelie Land, the SMB may change from negative to highly positive values within a distance of one or two kilometers (Agosta et al., 2012).
2.2 The fully updated database
Because the international polar year (IPY) recently pro-vided a large amount of new SMB data, an update of ex-isting SMB compilation is timely. We consequently updated the V99 database by including the large amount of new SMB data obtained since 1999 (Fig. 1b). Important new in-formation was obtained during the European EPICA and international TASTE-IDEA programs, when isolated mea-surements and traverses were performed (Fig. 1a), includ-ing in Dronninclud-ing Maud Land (e.g., Rotschky et al., 2007), from Ross Sea to Talos Dome (French-Italian contribution to ITASE (Frezzotti et al., 2004). Measurements were also taken along the French traverse to Dome C (Agosta et al., 2012; Verfaillie et al., 2012), along the Norway–USA scien-tific traverse from South Pole to Dronning Maud Land (An-sch¨utz et al., 2009, 2011; M¨uller et al. 2010), and along the Japanese–Swedish traverse from the Swedish Wasa station to the Japanese Syowa (also spelled Showa) station (Fujita et al., 2011). A large new dataset was acquired from Zhongshan station to Dome A by the Chinese Antarctic Research Expe-dition (CHINARE) (Ding et al., 2011). Some traverses have also been revisited like the Japanese traverse from Syowa to Dome Fuji (e.g., Motoyama and Fujii, 1999; Motoyama, per-sonal communication, 2011), resulting in a major update and
Fig. 1. (a) Orientation map of Antarctica showing the main regions cited in the text. Blue lines are 1000 m elevation contours computed from Bamber et al. (2009). (b) Location of available SMB data in Antarctica. White circles are data from V99’s database, black dots represent data from the updated database before quality control, gray circles represent data from Bull (1971) which were directly excluded from the Vaughan et al. (1999) database due to their low reliability (digitalized from maps). Background map is elevation according to (Bamber, 2009). (c) Lo-cation of reliable field data (black dots) and selected datasets for model validation. Background map is elevation according to (Bamber, 2009). Abbreviations are CAS: Casey (Vincennes Bay, Australia), DC: Dˆome C (Antarctic Plateau, France/Italy, DDU: Dumont d’Urville (Adelie Land, France), DF: Dome Fuji (Dronning Maud Land, Japan), LD: Law Dome (Wilkes Land, Australia), GS: GLACIOCLIM-SAMBA net-work, MRN: Mirny (Davis Sea, Russia), MWS: Mawson (Mac Robertson Land, Australia), NMY: Neumayer (Atka-Bay, Germany), SHW: Syowa (East Ongul Island, Japan), SP: Amundsen–Scott South Pole (South Pole, USA), TRL for Troll (Dronning Maud Land, Norway), VTK: Vostok (Antarctic Plateau, Russia), ZGS: Zhongshan (Prydz Bay, China).
completing SMB data close to Fujiwara and Endo (1971) route. Finally, we also present unpublished stake data from the coast to Princess Elizabeth station which result from the collaboration between the Belgian Antarctic expeditions and the French Polar Institute (IPEV) in the framework of the GLACIOCLIM observatory (Agosta et al., 2012). However, in this paper, we did not include SMB values obtained with ground-penetrating radar (GPR), because – unlike stake
mea-surements for example – these are indirect measurement of SMB, and require an interpretation of radargrams. In fact, difficulties in signal processing and interpretation may occur in picking the reflectors, which are sources of error (Verfail-lie et al., 2012). Moreover, even if radargrams are available as graphs, the age of reflectors is generally not identified in pub-lications, and getting data from publication is not straightfor-ward. Thus, we choose to not include the published GPR data
in the present paper which is dedicated to direct SMB esti-mates.
In addition to SMB values, information essential for a quality control is also provided, i.e., location, methodol-ogy, altitude, local mean temperature, distance to the coast, dates of measurements, SMB units in the primary data sources, time period covered by the SMB values, primary data sources. This primary information was retrieved for both new data and for previous V99 data, which enabled us to correct several data. For instance, correction of longitude for measurements on Siple Coast was possible thanks to the primary publication (Thomas et al., 1984; Bindschadler et al., 1988). In some cases, if measurements were a short dis-tance apart (within approx. 20 × 20 km2), the V99 database only gives their averaged values. Instead, we documented each data point. This was mainly the case at the South Pole and along traverses around Lambert Glacier, in Wilkes Land and from Syowa to Dome Fuji (Table 1). This increases the number of available measurements by 1493 (Table 1) (even though these data did exist in the V99 database it was at a lower spatial resolution). Of these 1671 data, 215 from Lam-bert Glacier traverse to Dome A were updated using new measurements made since 1999. These data offer a more ac-curate description of small scale (1 to 2 km scale) SMB spa-tial variability. Other specific characteristics were also added to the database, for instance, the presence of blue ice and of megadunes (when available in primary sources).
Retrieving the primary information was complex because the whole information is usually not available in one single publication. After tracking down previous publications, we were able to select the most relevant data together with pre-cise information on the method used and the location. This included digitalizing data from figures or maps when neces-sary, which is clearly indicated in the final database. Finally, when different time periods were available for a single loca-tion (for instance, when several layers were reliably dated in ice cores), SMB estimates are given for each period.
This involved compiling and documenting more than 5800 SMB data distributed over the whole continent (Fig. 1b). Following Magand et al. (2007), we rejected data that did not correspond to measurements of annual SMB. This was the case of 255 data provided by Bull (1971) for which metadata are missing (e.g., Vaughan and Russell, 1997). Several data, as for instance between Dome Fuji and South Pole, can be traced as probably originating from a tra-verse undertaken in the area before 1971 (Fujiwara and Endo, 1971). However, original publication suggests that data are not highly reliable, justifying their rejection.
The full updated surface mass balance of Antarctica database (called the SAMBA-LGGE database) now con-tains 5548 data (Table 2). This database is fully and freely available on the GLACIOLIM-SAMBA Observa-tory website: http://www-lgge.ujf-grenoble.fr/ServiceObs/ SiteWebAntarc/database.php.
2.3 A reliable dataset extracted from the full database A first update and improvement of the V99 database was per-formed by Magand et al. (2007), who focused on a limited part of Antarctica (90–180◦East Antarctic sector). These au-thors applied a quality control to SMB estimates based on objective criteria of reliability, as initially suggested by Bull (1971). We applied the quality rating based on measurement techniques provided by Magand et al. (2007). We do not dis-cuss the quality and reliability of the method here because this has already been done by Magand et al. (2007), but the main explanations for the data rating are summarized in Ta-ble 3. The quality control enaTa-bled us to select only reliaTa-ble SMB values leading to a new subset, hereafter referred to as “A” rated dataset. The measurement techniques we consid-ered very reliable are rated “A”. Techniques considconsid-ered less reliable are provisionally accepted and rated “B”, while those considered unreliable are rated “C” (Table 3). Like Magand et al. (2007), we also rejected data when information that was crucial for the quality control was missing, i.e. location, SMB value and unit, method and period covered (for stake data).
Results rated “A” form a new dataset of 3539 reliable SMB values (Table 2, Fig. 1c). This is about four times more than the 745 reliable data obtained by Lenaerts et al. (2012b), who conducted a similar quality control on the V99 database. Since our aim was to retrieve a high quality dataset, our data filtering may be too restrictive. Note that the fully docu-mented database is available on the GLACIOCLIM-SAMBA (hereafter referred to as GS) website, so that any other con-trol can be applied to the data.
3 Analysis of the “A” rated dataset
The impact of the quality control on the distribution of avail-able data over Antarctica was tested by comparing the full database with the “A” rated dataset (Table 2). The quality control led us to remove data from large areas (Fig. 1c), mainly in West Antarctica. In particular, measurement lacks for a large area between Marie Byrd Land and the coast. This is particularly important because models were initially sus-pected to have common positive biases (i.e., overestimated SMB) compared to surface accumulation compilations (Gen-thon and Krinner, 2001; Van de Berg et al., 2006). Since data for this area are not reliable, it is difficult to know whether the models are correct or not. Data availability is also par-ticularly poor for the region from the Filchner-Ronne ice shelf to the South Pole, and for the Pine Island glacier catch-ment, which was the site of considerable research in the past but where SMB values were usually obtained through snow stratigraphy studies (e.g., Pirrit and Doumani, 1961; Shimizu, 1964). Stratigraphy data are generally assumed to be ambiguous because precipitation is low, presents high an-nual variability, and is affected by strong surface snow meta-morphism, resulting in partial or sometimes total obliteration
Table 1. List of sectors where data are presented separately instead of their average over 20 × 20 km2grid cells given in V99. Number of data in databases
This paper V99 References Comments
South Pole 280 6 Mosley-Thompson et al. (1995, 1999) N.A.
Lambert Glacier 997 73 Higham and Craven (1997) N.A.
Lambert 215 data are not in V99 Ding et al. (2011) Redundant data from (Higham and
(traverse to Dome A) redundant with Craven, 1997) are stakes measurements
Higham and Craven (1997) spanning only 1 yr: these redundant data
disappear after the quality control.
Wilkes Land 394 99 Goodwin (1988) N.A.
Total 1671 178
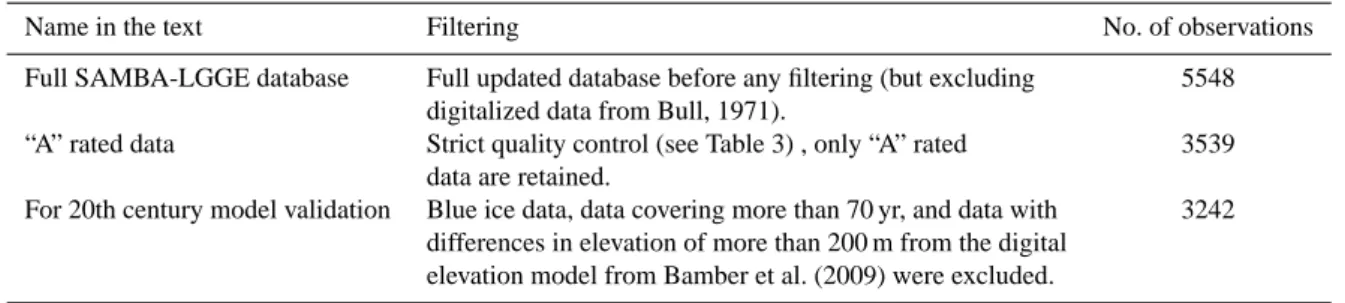
Table 2. SMB datasets, and available data at each step.
Name in the text Filtering No. of observations
Full SAMBA-LGGE database Full updated database before any filtering (but excluding 5548 digitalized data from Bull, 1971).
“A” rated data Strict quality control (see Table 3) , only “A” rated 3539 data are retained.
For 20th century model validation Blue ice data, data covering more than 70 yr, and data with 3242 differences in elevation of more than 200 m from the digital
elevation model from Bamber et al. (2009) were excluded.
of annual layering (e.g., Magand et al., 2007). Other large datasets from traverses to and around the South Pole were also excluded because the data were originally obtained from digitalized maps (e.g., Bull, 1971) or from snow stratigraphy studies (Brecher, 1964). Finally, the quality control resulted in a huge reduction in available SMB values at Siple Coast and on Ross Ice Shelf because the data are mainly stake measurements made over only one year (Bindschadler et al., 1988; Thomas et al., 1984). Because inter-annual variability of snow accumulation is large in Antarctica, a one year SMB estimate cannot be representative of the mean local SMB, and more than 3 yr are required to obtain an accurate esti-mate of the average SMB (Magand et al., 2007). However, this data gap is not as serious because snow accumulation on the Ross Ice Shelf does not affect the grounded ice SMB so that changes in accumulation in this area do not directly affect sea level rise. Nevertheless, surveying possible future melting over the ice shelf is an important scientific concern and obtaining new SMB data there is essential. The prox-imity of the main Antarctic station (McMurdo station) is an ideal opportunity to plan future studies since it is the depar-ture point for scientific research on the Ross Ice Shelf.
The removal of suspicious data considerably has modified the distribution of the SMB. Especially, the SMB–elevation relationship is different when calculated with only the “A” rated dataset or the whole dataset. There is a significant difference between 200 m a.s.l. and 2000 m a.s.l. over East Antarctica (Fig. 2a), because few observations are made over this elevation range and removing incorrect data thus had a
significant impact on the mean SMB. Because large A-rated datasets exist in the high interior of the 0–90◦E sector of Antarctica (Fig. 1), the difference between “A” rated dataset and the whole dataset was limited above 2500 m a.s.l. over the East Antarctic Ice Sheet (EAIS) (Fig. 2a). However, in-accurate observations provide a wet bias at high elevations in the 90–180◦E sector of Antarctica, as already observed by Magand et al. (2007). There was a significant difference at every elevation over West Antarctica (Fig. 2b) because the number of unreliable observations is high for all elevation ranges on this side of the continent. The mean SMB of areas with field measurements (Table 4, see values in italics) over Antarctica differed significantly before (154 mm w.e. a−1) and after the quality control (140 mm w.e. a−1), and the dif-ference was even higher in West Antarctica (238 versus 157 mm w.e. a−1) than in East Antarctica.
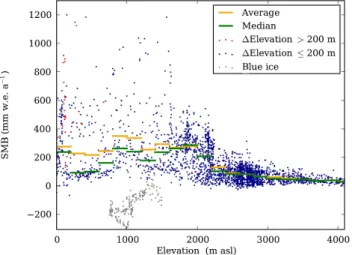
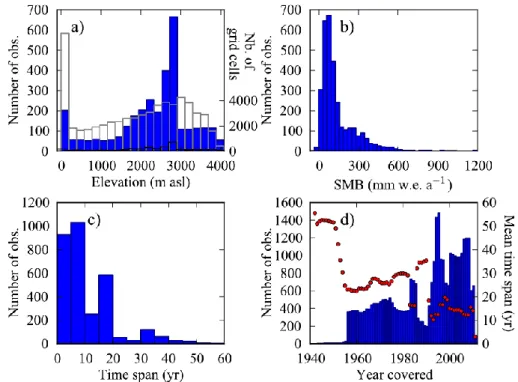
After the removal of unreliable data, the SMB of Antarc-tica can be studied with more confidence. The SMB sig-nificantly increases from 200 m to 1000 m a.s.l., although with marked scattering (Fig. 3). At higher elevations, be-tween 1800 and 4000 m a.s.l., the SMB and its scattering de-creases progressively as the SMB is very low over interior plateaus. The frequency distribution of surface elevation for the entire continent or for only the observation points differs (Fig. 4a), which means that the observations are not equally distributed as a function of altitude. Indeed, the frequency of surface elevations in Antarctica peaks at around 0 m a.s.l. (ice shelves) and at 3200 m a.s.l., with a very broad maximum between 1800 m a.s.l. and 3400 m a.s.l., whereas a narrow
Table 3. Reliability and applicability conditions of SMB measurement methods (see Magand et al., 2007, for details on reliability criteria). Reliabilitya
SMB measurement methods Applicability conditions Annual Multiannual Decadalb Anthropogenic radionuclides Dry snow facies, little mixing, absolute / A A and volcanic horizons calibration and dating tools with reference
horizon levels.
Stake measurements Everywhere, annual and multiyear averaged Cc A A
SMB variability studies.
Natural210Pb Dry snow facies, little mixing, / / Bd
less accurate than anthropogenic radionuclides.
Stable isotope content and Dry snow facies, annual to multiyear averaged / B B chemical markers SMB variability studies, clear observations
difficult in areas with very low SMB values (central Antarctic plateau), subjectivity in counting annual layers.
Snow stratigraphy Dry snow facies, “low” reliability and C C C
accuracy.
Precipitation gauges Unreliable, inaccurate. C C C
aThe methods deemed very reliable are rated “A”, the methods deemed reliable are provisionally accepted (rated “B”), unreliable methods are rated “C”. bOver one or several decades.
cApplicable to single stakes and stake networks.
dThe natural210Pb SMB method is reliable only over 4 to 5 decades (∼ two half life periods)
Fig. 2. Mean SMB computed using field data measured within each 200 m elevation range on the grounded ice sheet, (a) for the eastern Antarctic sector (longitude between 0◦E and 180◦E), and (b) western Antarctic sector (longitude between 0◦W and 180◦W). We first computed the average SMB for each 15 × 15 km2grid cell (values from points located in the same grid cell are averaged), and then the mean SMB every 200 m in elevation assuming that each grid cell had the same weight. Dark green squares are mean SMB computed with the full database, and light green squares are mean SMB computed with “A” rated data only. Gray and black dots are the number of grid cells within each elevation range for the “A” rated data and the complete (“full” SAMBA-LGGE) database, respectively.
maximum appears at 2800 m a.s.l. in the case of SMB mea-surements. Although new data at low elevation were added to this dataset, low elevation areas are not sufficiently docu-mented considering their contribution to the total SMB and to the high spatial variability of their SMB. There is still insuf-ficient available data and measurements were mainly made in East Antarctica. The low density of field measurements is a serious obstacle to accurately assessing the Antarctic SMB (e.g., Van de Berg et al., 2006).
Each SMB value was measured over a different period of time. Ninety percent of the periods covered less than 20 yr and 43 % less than 5 yr (Fig. 4c, d). The covered period is closely related to the method used to estimate the SMB. The major cause of the stair-like distribution of the histogram in
Fig. 4d is the presence of data from very large stake networks (e.g., around Lambert Glacier; Higham and Craven, 1997; Ding et al., 2011), that span only a few years. Dating known horizons in cores or snow pits (volcanic eruptions, nuclear tests) is accurate and provides good estimates of the SMB over long periods (15 to 60 yr). But these observations are isolated because they are difficult to perform at a high spatial density. On the other hand, stake measurements are very use-ful because they are generally made at a high spatial density, which leads to a correct sampling of the actual SMB distri-bution in the field. This is particularly useful in coastal areas, because stake networks provide relevant information over a wide range of elevations, and enable the increase in SMB caused by orographic precipitation to be accurately measured
Table 4. Mean SMB computed from field observations for Antarc-tica, and for the eastern and western parts of Antarctica. Note that these SMB averages are only for areas with observation, and do not represent a mean SMB for the whole continent.
“A” rated data Full database Antarctica 141c(140d) 167 (154) (Grounded area: 12.2 × 10⁶km2) East Antarcticaa 138 (129) 136 (120) (Grounded area: 8.5 × 10⁶kmb) West Antarcticab 149 (157) 218 (238) (Grounded area: 3.7 × 10⁶km2)
aMore precisely, for the 0–180◦E sector of Antarctica. bMore precisely, for the 0–180◦W sector of Antarctica.
cWe first computed the average SMB for each 15 × 15 km2grid cell (values from points located in the same grid cell are averaged), and then computed the mean SMB over Antarctica assuming that each grid cell has the same weight. dWe first computed the average SMB for each 15 × 15 km2grid cell, then we computed a mean SMB for each 200 m elevation range (with the same weight for each grid cell). Finally, the mean SMB for Antarctica was computed by weighting each 200 m elevation range with its area.
Fig. 3. Variation in SMB according to elevation based on reliable data. Data spanning a period of more than 70 yr are not shown. Elevations are from Bamber et al. (2009) digital elevation model (DEM). Blue dots are the selected observations for comparison with ERA-Interim, red dots are observations presenting a difference in elevation greater than 200 m compared with Bamber et al. (2009) DEM, gray dots are data from blue ice areas described in Sinisalo et al. (2003) and Bliss et al. (2011). Horizontal bars are the mean (orange) and 50 % occurrence (green) of blue dots for each 200 m elevation range.
(e.g., Agosta, 2012; Agosta et al., 2012). Stake networks also allow information to be collected on the inter-annual variabil-ity of the SMB. However, acquiring long time series requires the maintenance of a regular stake network with regular re-newal of the stakes and annual assessment of stake height and density, which is difficult over long periods. For this rea-son, stake measurements generally cover periods of less than 10 yr. Hence, stake measurements represent the largest
pro-portion (82 %) of observations, because several large stake networks (containing many stakes) exist, but were measured only a few times. For these reasons, the scientific community cannot rely only on this method to increase data density for continental scale.
4 Comparison of the “A” rated dataset with results of ERA reanalysis
4.1 A subset of data used for the comparison
Regional features like elevation, continentality, location of sites relative to major and minor ice divides, surface slope and so on, clearly impact SMB distribution in Antarctica. However, large-scale features do not have the same conse-quences on SMB distribution, because SMB is more pre-cisely related to how depressions penetrate inland and pro-voke precipitation, and on how the wind affect snow distri-bution. Although perfectible, model outputs are useful here because of their large scale coverage and their ability to pre-dict geographical distribution of the current and future SMB. Thus combining observational data with model outputs is es-sential both to identify biases in the model but also biases due to heterogeneous data coverage.
It is difficult to compare spotty field data and model out-puts on a regular grid. For this reason, we defined a special dataset for a (basic) model validation. Because climatic mod-els generally focus on climatic conditions at the end of the 20th century, we filtered the database for this period, to avoid possible long-term climate variations. Here, we only consid-ered data covering the last 70 yr, leading to a slight reduction in the database (52 data were removed). We are aware that this process does not remove the decadal bias of each da-tum, because data present distinct time coverage. Now, this sub-dataset should be rescaled to a reference time period to produce a homogeneous climatology. But our purpose here was not to provide an accurate SMB map at the scale of Antarctica, but to compare the available field information with ERA-Interim data to judge if their spatial distribution is sufficiently regular and dense to allow model validation. In a future work, data will be rescaled against a common period to remove regional trends caused by heterogeneous coverage of time.
Several data were further left aside because the elevation (as given in published works) differed from the local ele-vation given by the 1 km resolution digital eleele-vation model (DEM) of Bamber et al. (2009). Differences may result from errors in compiling field data (for instance, if an elevation or geographic location was incorrectly estimated in the field). Differences can also be due to the DEM resolution (1 km), because local variations in topography may be smaller than those of the real terrain. A significant error in the DEM which may apply to several points is also possible when the slope is very steep. Consequently, we removed data for which the
Fig. 4. Main characteristics of the reliable SMB data. (a) Comparison between the distribution of elevation in the database (blue histogram, left axis) and the distribution of surface elevation of Antarctica (white histogram, right axis). Black histograms are the same as blue histograms but represented on the right axis. Elevation is deduced from Bamber et al. (2009) DEM and are displayed for elevation ranges of 250 m each. (b) Number of observations as a function of SMB values. (c) Number of observations as a function of time coverage. (d) Variations in the number of observations over time (histogram) and in the time period used for their average since 1940 (red dots).
difference in elevation exceeded a 200 m threshold (Fig. 5). This led to the removal of 44 observations. Finally, when val-idating the climate model, we noted that a few points still require a detailed analysis: 26 observations by Sinisalo et al. (2003) and 164 observations on Taylor glacier by Bliss et al. (2011) were in blue ice areas and should not be in-cluded in a validation process unless the climate model con-cerned took erosion and sublimation processes into account (Fig. 3). Removing these data does not guarantee that snow drift sublimation or transport plays no role at the other points but allows focusing where these processes are not the major ones. These additional removals led to a subset of data to-taling 3242 observations for comparison with model outputs (Table 2).
We also chose to focus on low elevation areas of Antarctica where much of the snow accumulation occurs. Seventy per-cent of the Antarctic SMB accumulates below 2000 m a.s.l., although this elevation range represents only 40 % of the to-tal area of Antarctica. Low elevation areas are those where spatial variability in the SMB is the highest, and where the largest future changes in SMB are expected to occur in the 21st century (e.g., Krinner et al., 2007, 2008; Genthon et al., 2009; Agosta, 2012). Conversely, accumulation over interior plateaus is very low (less than 50 mm w.e. a−1) and rather homogeneous over long distances as the topography is flat. Thus, field observations at low elevation are most
appropri-Fig. 5. Distribution of the difference in elevation between ob-served data and data from the digital elevation model of Bamber et al. (2009). The white lines represent the 200 m threshold which led to the rejection of 44 observations.
ate for model validation, as already demonstrated in coastal Adelie Land, where data from the GS observatory allowed us to identify a number of discrepancies in various models (Agosta et al., 2012). Because low elevation areas (that is, where high SMB values are observed: Fig. 4b) are under-sampled by field observations, a focus on these specific areas is necessary.
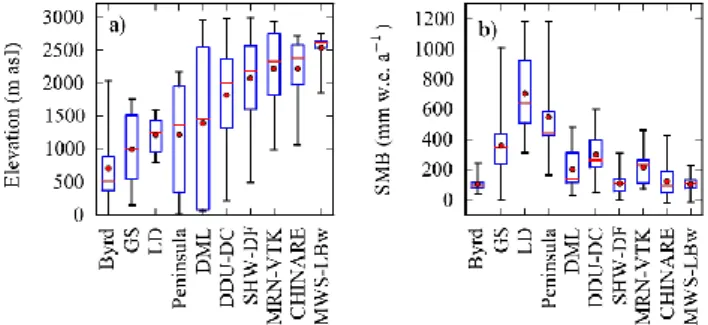
Fig. 6. Boxplot distribution of (a) elevation and (b) SMB values for each selected dataset. Red dots are the mean values. Red lines rep-resent 50 % occurrence, the first and third quartiles are reprep-resented by the box bounds, and the minimum and maximum values by the black lines.
We selected datasets starting from coastal regions and extending inland, in order to include a strong topographic contrast (between 0 m a.s.l. and 2000 m a.s.l., and sometimes extending up to 3000 m a.s.l. when data from a continu-ous traverse were available). These Data cover the periph-eral regions and key catchments of Antarctica. We further selected homogeneous data in terms of temporal coverage and methodology, and gathered data resulting from the same initial publications and origin. This led us to select the 10 datasets listed in Table 5 and shown in Fig. 1c, cor-responding to traverse lines in Adelie Land (GS dataset), around Law Dome, from Zhongshan to Dome A, around the west side of Lambert glacier (above Mawson station), from Mirny to Vostok and from Syowa station to Dome F. Con-sidering the spatial density of measurements, these data are particularly appropriate for model validation in coastal areas. We additionally selected three datasets not from traverses but from points located in Byrd region, along the Antarctic Peninsula and in Dronning Maud Land.
For Dronning Maud Land, Mirny to Vostok and the Penin-sula, these observations cover a wide range of elevations (Fig. 6a) and present a very low spatial density. These val-ues thus provide important information on the regional in-crease in the mean SMB but data are also highly impacted by small scale variability due to local erosion or deposition processes (e.g., Eisen et al., 2009; Agosta et al., 2012). In ad-dition, Byrd, Peninsula and Dronning Maud Land are atypi-cal climate settings, but it is important to study these partic-ular areas because considerable environmental changes are expected to occur there in the future. For instance, the Byrd dataset presents the particularity of low SMB values in low elevation areas (Fig. 6b).
Among these datasets, the GS dataset and the one from Law Dome are particularly appropriate for model vali-dation, because they have a high spatial resolution and cover a long observation period. Data from Zhongshan to Dome A (CHINARE in Fig. 6) and the west side of Lam-bert glacier (above Mawson station) are mainly located above
1500 m a.s.l. (Fig. 6a): this reduces their usefulness for study-ing processes that take place at low elevations. Data from Syowa station to Dome F traverse cover a more interesting range of elevations but 75 % of these observations are also above 1500 m (Fig. 6a), where SMB is low (Fig. 6b).
4.2 Available SMB data from ERA-Interim reanalysis Because reanalysis provide valuable information to study cli-matic features during recent decades, these data were used to study whether the SMB database allows us to reconstruct an accurate description of the main SMB distribution fea-tures in Antarctica. Reanalysis have been largely used to es-timate climatic conditions and the Antarctic SMB (e.g., Mon-aghan et al., 2006; Genthon et al., 2005; Agosta et al., 2012), as well as to force regional circulation models (e.g., Van de Berg et al., 2006; Lenaerts et al., 2012a; Gall´ee et al., 2013). The reanalysis methodology is based on assimilating meteorological observations (e.g., Bromwich et al., 2011), which provides more reliable outputs than classical atmo-spheric models. ERA-Interim (Simmons et al., 2006) likely offers the most realistic depiction of precipitation in Antarc-tica (e.g., Bromwich et al., 2011), which justifies to focus on these data.
In the following section, ERA-Interim SMB values are tested against the SMB values of our database. The aim is to evaluate the accuracy of the ERA-Interim reanalysis data, and conversely, to check whether some areas are insuffi-ciently documented in the database to allow model validation and to evaluate an accurate SMB average. We focused on the datasets for elevations between 0 and 3000 m a.s.l. (Table 5). ERA-Interim is an improved operational analysis: effi-cient four-dimensional variational data assimilation (4D-Var) is performed by taking additional data into account. ERA-Interim data are produced by applying the IFS model (Cy31r2 version), running in spherical harmonic represen-tation (T255, nominal resolution of 80 km). Calculations are performed on 60 vertical levels (hybrid pressure-sigma co-ordinates) from the surface to the mesosphere at 0.1 hPa or 65 km. Here, we used ERA-Interim outputs over the period 1989–2010, even though data are now available for the pe-riod 1979–1988. Data were interpolated over a 15 km Carte-sian grid resulting from a stereographic projection with the standard parallel at 70◦S and the central meridian at 15◦W. The liquid phase (PL and RU; see Sect. 2.1 for abbrevia-tions) is assumed to refreeze entirely. The simulated SMB is thus the balance between precipitation (PS and PL)and sublimation (SU). The model used for ERA-Interim does not account for wind erosion or deposition processes (ER). Snow drift and wind processes are expected to have significant ef-fects on SMB when wind speed is high (e.g., Gall´ee et al., 2013; Lenaerts et al., 2012a). These processes introduce a major uncertainty in SMB computations by ERA-Interim in low elevation areas. Hence, in our study, we did not focus on areas where SMB is controlled by snow erosion over long
Table 5. Description of selected datasets in low elevation areas for comparison with ERA-Interim reanalysis.
Name Location No. of No. of cells Time coverage Mean elevation Mean SMB
observations 15 × 15 km∗ (start–end) (m a.s.l.) (mm w.e. a−1)
Byrd Byrd 143 15 1955–1994 700 100
CHINARE Zhongshan – Dome A 249 40 1994–2008 2216 120
DDU-DC Dumont d’Urville – Dome C 27 18 1955–2009 1815 298
DML Dronning Maud Land 22 21 1948–1999 1385 200
GS Glacioclim – SAMBA 90 11 2004–2010 990 357
LD Law Dome 29 9 1973–1986 1207 704
MNR-VTK Mirny – Vostok 9 8 1955–1998 2215 215
MWS-LBw Mawson – Lambert West 249 40 1990–1995 2531 100
Peninsula Antarctic Peninsula 26 22 1953–1986 1212 546
SHW-DF Syowa – Dome Fuji 245 37 1955–2010 2068 106
∗Number of 15 × 15 km2grid cells containing field measurements.
Fig. 7. Mean SMB over the grounded ice sheet as a function of elevation a) for “A” rated data and b) for non “A” rated data. Pink squares are the mean SMB calculated by ERA-Interim for grid cells containing observations within each elevation range. Red circles are mean SMB calculated by ERA-Interim over each entire range of elevations. Green squares are mean observed SMB from grid cells containing observations within each elevation range. The gray line represents the contribution of areas with observation to the grounded ice sheet area (for each elevation range). The red line represents the contribution of entire elevation range to the grounded ice sheet. Each elevation range is 200 m. RMSE is computed between observations and ERA-Interim for grid cells containing observations by elevation ranges.
distances, in this case, large blue ice areas. However, these data are still available in the full database, and should be included if the atmospheric model or the studied processes include erosion.
To compare simulated and observed SMB values, we ex-tracted grid boxes including at least one field measurement. Each field datum was then compared to the simulated one of the corresponding grid cell. We also calculated the aver-age of all observed values included in the same model grid cell, and compared it to the SMB simulated by ERA-Interim. Observed and modeled data were compared as a function of elevation.
4.3 Comparison between the subset of SMB data and ERA-Interim outputs
Averaging ERA-Interim simulated data over the grounded ice sheet leads to a value of 128 mm w.e. a−1 (4.4 mm a−1 in terms of sea level equivalent). This estimate is among the lowest published values (Monaghan et al., 2006), and is well
below estimates by Vaughan et al. (1999) and Arthern et al. (2006). This low value is mainly due to very low accu-mulation modeled at high elevations (above 2000 m a.s.l..), where ERA-Interim is known to considerably underesti-mate the actual amount of solid precipitation, and also be-low 1000 m a.s.l., where ERA-Interim overestimates abla-tion. The areas located below 1000 m a.s.l. cover a narrow belt around Antarctica, in mountainous regions (the Antarctic Peninsula, in Palmer Land, along the Transantarctic moun-tains at 160◦E and in Mary Byrd Land). This elevation range is crucial for the Antarctic SMB because it concentrates most of the total accumulated SMB.
In grid cells containing measurements, ERA-Interim val-ues are close, although lower, than measurements (Fig. 7a). This shows that SMB measurements are reasonably well re-produced by ERA-Interim. Performing the same comparison with non-“A” rated data (Fig. 7b) shows a lower quality re-lationship between data and model, suggesting that the fil-tering process removed lower accuracy data. Nevertheless,
for “A” rated data, each elevation range between 200 and 1000 m a.s.l., the mean simulated SMB computed over all grid cells is significantly higher than the one computed over grid cells containing measurements (Fig. 7a: red circles ver-sus red squares). With the hypothesis that ERA-Interim out-put is close to the real world also for areas with no ob-servations, this means that field data mainly reflect the low SMB areas and poorly constrain areas where SMB values are high, suggesting that observations do not correctly sample the SMB between 200 and 1000 m a.s.l. (as already suggested in Sect. 3.1). Above 2500 m a.s.l., this discrepancy does not hold, suggesting that the observations may be representative of the entire range of elevations over the icecap. Neverthe-less, large part of the plateaus of the EAIS are characterized by wind-glazed areas where wind and sublimation removes the annual solid precipitation (e.g., Scambos et al., 2012), creating a hiatus in accumulation which is problematic for ice core interpretation. Existing “A” rated data are thus lo-cated only across the wind glazed areas, leading to overes-timates of the net mass accumulation (e.g. Scambos et al., 2012) which may partly justify the wet bias observed accord-ing to ERA-Interim output (Fig. 7).
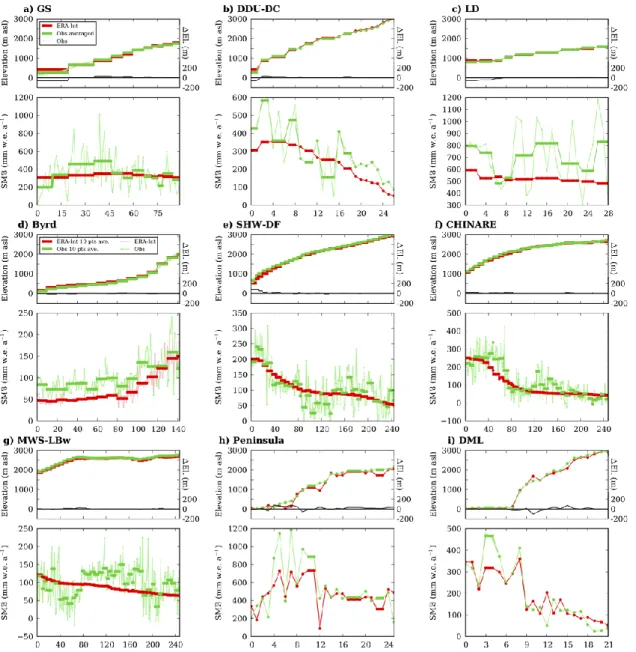
The datasets selected at low elevations also provide inter-esting information. The ERA-Interim simulation fits obser-vations acceptably despite significant differences (Fig. 8). In some cases (in Adelie Land (GS dataset), Syowa station to Dome F, from Zhongshan to Dome A (CHINARE), around Lambert glacier) ERA-Interim misses the mesoscale vari-ability, while in other cases (Law Dome, Byrd, Peninsula) ERA-Interim is mainly too dry. A large proportion of SMB differences is due to biases in the surface elevation used by the model. In fact, temperature and all related energy fluxes directly depend on elevation. However, some of the differ-ences are directly related to the model’s inability to simulate accurate SMB values. For instance, ERA-Interim assumes too low albedo values at low elevations (values between 0.1 and 0.75) and calculates too high runoff and sublimation. Overestimation of melting by ERA-Interim has already been demonstrated (Agosta et al., 2012) and may be accounted for by considering that liquid water entirely refreezes. How-ever, incorrect albedo values have serious consequences for the entire surface energy balance (SEB), for instance on sub-limation. Finally, we observe that SMB variability is very large at the 1 km scale in coastal areas (see GS, Syowa sta-tion to Dome F, and Zhongshan to Dome A traverses, for instance: Fig. 8a, f, e). Using data points every 10 or 50 km (see Law Dome for instance: Fig. 8c) does not distinguish the regional mean from local variability. A survey of dense stake networks is clearly better in such cases. Another way to obtain a better estimate of spatial variability may be to use ground penetration radar (GPR) data to interpolate SMB point estimates from ice cores (e.g., Verfaillie et al., 2012).
5 Discussion and conclusions
In this paper, we present an up-to-date surface mass balance database for the entire Antarctic continent, including relevant information about the data (location, measurement methods, time period covered, specificity of the data, references) and recommendations for the use of data in particular regions. This database was carefully checked with a quality control. This method of selection was designed to keep only highly reliable data. The quality control led to a significant change in data distribution over Antarctica and in mean regional val-ues; although, as already shown by Magand et al. (2007), this process removes suspicious data that could have a major im-pact on any kind of SMB interpolation (e.g., Magand et al., 2007; Genthon et al., 2009; Verfaillie et al., 2012; Lenaerts et al., 2012b).
Inspection of the “A” rated dataset showed that our knowl-edge of SMB distribution is even less than previously sup-posed, because for large areas data are unreliable. This is particularly true in the Antarctic Peninsula, in West Antarc-tica, and along the margins of the ice sheet. Large scale field campaigns in these regions should thus be a scientific pri-ority, with particular focus on elevations between 200 and 1000 m a.s.l., because measurements are currently mainly lo-cated in low SMB areas and no measurements are available in large areas in which a significantly higher SMB is expected. Despite these limitations, the present work provided a new and more reliable database for climate model validation. The datasets described in this paper should make a correct as-sessment of model quality possible in several specific areas (see Table 5). For model validation, similar approaches to those performed by Agosta et al. (2012) with the GS network should be extended to the whole of Antarctica, using any cli-mate model and the selected datasets. In the present study, we demonstrated the interest of comparing field data with ERA-Interim outputs. On one hand, our comparison confirmed that ERA-Interim reasonably fits observations, even though the computed SMB presents significant dry biases. On the other hand, the comparison demonstrated that observations do not correctly sample the SMB between 200 and 1000 m a.s.l., and that very few data are available for high SMB areas. New field data along the AIS margin and new traverses in unex-plored areas are thus still required to validate climate models for Antarctica. To fill the knowledge gap, research should be performed in the Antarctic Peninsula, between Marie Byrd Land and the coast, on Ronne and Ross Ice Shelves, be-cause these are areas where data are less reliable. Important scientific and logistic stations are located in these regions (e.g., McMurdo station, Byrd station), which are ideal oppor-tunities to plan future traverses. Traverses may revisit routes that were already explored during the sixties and seventies, but using current techniques to offer more reliable SMB esti-mates. Explorations should associate GPR studies to pits and ice cores (with absolute dating techniques) to get continuous and accurate SMB data, as suggested by the ITASE program
Fig. 8. Surface elevation (“El”) and variations in the SMB in specific areas and along traverses from the coast to plateaus where field data are available: (a) along the GLACIOCLIM-SAMBA observation transect in Adelie Land, (b) between Dumont d’Urville (DDU) station and Dome C (DC), (c) around Law Dome, (d) in Byrd Station region and on Ross Ice Shelf (Byrd), (e) between Syowa (SHW) and Dome Fuji (DF) (f) along the traverse route from Zhongshan station to Dome A (CHINARE) (g) along the west side of Lambert glacier (LBw) close to Mawson station (MWS) (h) in the Antarctic Peninsula (i) in Dronning Maud Land (DML). For each region, surface elevation values are presented in the upper panel and SMB values in the lower panel. Values calculated by ERA-Interim (thick red line) are compared with the mean of field data included in each EAR-Interim grid cell (thick green line). Point field data before averaging are represented by a thin light green line. The surface elevation of field observations is from Bamber et al. (2009) digital elevation model (DEM). Also shown in the upper panels are the differences in surface elevation between ERA-Interim and Bamber et al. (2009) DEM (1El, black line, right axis).
(e.g., Ansch¨utz et al., 2009, 2011; Fujita et al., 2011; Ver-faillie et al., 2012). Finally, observation should focus where remote sensed data (passive microwave) are not reliable, i.e. in steep slopes, in wind glazed areas and where melting may occur.
The current quality-checked database is now available to assess the temporal and spatial variability of the Antarctic
SMB. First, the dataset can be rescaled to obtain a tempo-rally unbiased SMB climatology for the end of the 20th Cen-tury. This temporal rescaling step may be performed against ERA data. For this task, field data from each specific pe-riod and each region will be rescaled based on the SMB difference given by ERA between this specific period and a reference period. Second, collecting available GPR data in
Antarctica into a similar database is highly relevant and is now timely. This is currently under process at NASA (by the SUMup working Group). When available, the data will be adapted to the current database format and will be in-cluded into the present database. Nevertheless, getting a cor-rect estimate of the Antarctic SMB at a regional scale cannot be done with field measurements only, and cross compari-son with remote sensing data is needed. A step forward is the use of the database to apply the method of Arthern et al. (2006) based on passive microwave. The approach should allow the treatment or removal of serious biases in passive microwave data due to steep slopes, to melting at low ele-vations, and to erosion in wind glazed snow areas. The use of other sources of data (e.g., altimetry) is also highly inter-esting here (e.g., Helsen et al., 2008; Shepherd et al., 2012), even if getting access to density is still an important limita-tion in this case. Finally, assessing the mean Antarctic SMB will need information given by atmospheric models at high resolution (∼ 10–20 km) to correctly account for the effects of local topography on precipitation and ablation processes (e.g., Van de Berg et al., 2006; Monaghan et al., 2006; Krin-ner et al., 2008; Genthon et al, 2009; Lenaerts et al., 2012b). Regional circulation models (e.g., MAR, RACMO2, PMM5) are good candidates for this task. The present database is clearly a relevant tool for model calibration.
This paper presented the most recent updated sur-face mass balance dataset for Antarctica. The database is freely available on the GLACIOCLIM-SAMBA website (http://www-lgge.ujf-grenoble.fr/ServiceObs/ SiteWebAntarc/database.php) for any scientific use. Con-tinuous updating of the database is planned but will require data owners to share their published data. This will also be possible on the GS website.
Acknowledgements. The GLACIOCLIM-SAMBA observatory is supported by IPEV (Institut Polaire Paul-Emile Victor) and INSU (Institut National des Sciences de l’Univers). We acknowledge the ice2sea project funded by the European Commission’s 7th Framework Programme through grant number 226375. We thank J´erˆome Chappellaz, Kenji Kawamura and Kumiko Azuma who helped us contact data owners to obtain new unpublished data. We thank M. Fily and ANR fundings (“VANISH” project no. ANR-07-VULN-013) for providing several new unpublished data around Dome C. We are grateful to O. Magand and P. Smeets who provided partially updated databases, and we particularly thank A. Bliss, M. Ding, and H. Motoyama who gave us access to the full information on published datasets over long traverses. Finally, we thank the two anonymous reviewers for their valuable comments. This is ice2sea manuscript number ice2sea128.
Edited by: M. Van den Broeke
The publication of this article is financed by CNRS-INSU.
References
Agosta, C.: ´Evolution du bilan de masse de surface Antarctique par r´egionalisation physique et cons´equences sur les variations du niveau des mers, Ph.D. thesis, Universit´e Joseph Fourier, France, 134 pp., 2012
Agosta, C., Favier, V., Genthon C., Gall´ee, H., Krinner, G., Lenaerts, J., and Van den Broeke, M. R.: A 40-year accumula-tion dataset for Adelie Land, Antarctica and its applicaaccumula-tion for model validation, Clim. Dynam., 38, 75–86, 2012.
Ansch¨utz, H., M¨uller, K., Isaksson, E., McConnell, J. R., Fischer, H., Miller, H., Albert, M., and Winther, J. G.: Revisiting sites of the South Pole Queen Maud Land Traverses in East Antarctica: Accumulation data from shallow firn cores, J. Geophys. Res., 114, D24106, doi:10.1029/2009JD012204, 2009.
Ansch¨utz, H., Sinisalo, A., Isaksson, E., McConnell, J. R., Ham-ran, S.-E., Bisiaux, M. M., Pasteris, D., Neumann, T. A., and Winther, J.-G.: Variation of accumulation rates over the last eight centuries on the East Antarctic Plateau derived from vol-canic signals in ice cores, J. Geophys. Res., 116, D20103, doi:10.1029/2011JD015753, 2011.
Arthern, R. J., Winebrenner, D. P., and Vaughan, D. G.: Antarc-tic snow accumulation mapped using polarization of 4.3-cm wavelength microwave emission, J. Geophys. Res.-Atmos., 111, D06107, doi:10.1029/2004JD005667, 2006.
Bamber, J.L., Gomez-Dans, J. L., and Griggs, J. A.: Antarctic 1 km Digital Elevation Model (DEM) from Combined ERS-1 Radar and ICESat Laser Satellite Altimetry. National Snow and Ice Data Center, Boulder, Colorado, 2009.
Bindschadler, R. A., Stephenson, S. N., Roberts, E. P., Mac Ayeal, D. R., and Lindstrom, D. R.: Data report for the Siple Coast project, National Aeronautics and Space Administration (NASA Technical Memorandum 100708), 102 pp., Washington, DC, 1988.
Bliss, A. K., Cuffey, K. M., and Kavanaugh, J. L.: Sublimation and surface energy budget of Taylor Glacier, Antarctica, J. Glaciol., 57, 684–696, 2011.
Brecher, H.: Glaciological Observations on the Byrd Station-South Pole Traverse, 1960–1961, J. Glaciol., 5, 339–343, 1964. Bromwich, D. H., Nicolas, J. P., and Monaghan, A. J.: An
Assess-ment of Precipitation Changes over Antarctica and the Southern Ocean since 1989 in Contemporary Global Reanalyses, J. Cli-mate, 24, 4189-4209, DOI: 10.1175/2011JCLI4074.1, 2011. Bull, C.: Snow accumulation in Antarctica, in Research in the
Antarctic, 367–421, Am. Assoc. for the Adv. of Sci., Washing-ton, DC, 1971.
Ding, M., Xiao, C., Li, Y., Ren, J., Hou, S., Jin, B., and Sun, B.: Spatial variability of surface mass balance along a traverse route from Zhongshan station to Dome A, Antarctica, J. Glaciol., 57, 658–666, 2011.
Eisen, O., Frezzotti, M., Genthon, C., Isaksson, E., Magand, O., Van Den Broeke, M. R., Dixon, D. A., Ekaykin, A., Holm-lund, P., Kameda, T., Karlof, L., Kaspari, S., Lipenkov, V.Y., Oerter, H., Takahashi, S., and Vaughan, D. G.: Ground-based measurements of spatial and temporal variability of snow ac-cumulation in east Antarctica, Rev. Geophys., 46, RG2001, doi:10.1029/2006RG000218, 2008.
Frezzotti, M., Pourchet, M., Flora, O., Gandolfi, S., Gay, M., Urbini, S., Vincent, C., Becagli, S., Gragnani, R., Proposito, M., Sev-eri, M., Traversi, R., Udisti, R., and Fily, M.: New estimations of precipitation and surface sublimation in East Antarctica from snow accumulation measurements, Clim. Dynam., 23, 803–813, doi:10.1007/s00382-004-0462-5, 2004.
Fujiwara, K. and Endo, Y.: Traverse Syowa-South Pole 1968–1969, JARE Scientific Reports, Special Issue, 2, 68–109, National In-stitute of Polar Research, Tokyo, 1971.
Fujita, S., Holmlund, P., Andersson, I., Brown, I., Enomoto, H., Fu-jii, Y., Fujita, K., Fukui, K., Furukawa, T., Hansson, M., Hara, K., Hoshina, Y., Igarashi, M., Iizuka, Y., Imura, S., Ingvander, S., Karlin, T., Motoyama, H., Nakazawa, F., Oerter, H., Sj¨oberg, L. E., Sugiyama, S., Surdyk, S., Str¨om, J., Uemura, R., and Wil-helms, F.: Spatial and temporal variability of snow accumula-tion rate on the East Antarctic ice divide between Dome Fuji and EPICA DML, The Cryosphere, 5, 1057–1081, doi:10.5194/tc-5-1057-2011, 2011.
Gall´ee, H., Trouvilliez, A., Agosta, C., Genthon, C., Favier, V., and Naaim-Bouvet, F.: Transport of snow by the wind: a comparison between Observations in Ad´elie Land, Antarctica, and Simula-tions made with the Regional Climate Model MAR, Bound.-Lay. Meteorol., 146, 133–147, 2013.
Genthon, C. and Krinner. G.: Antarctic surface mass balance and systematic biases in general circulation models, J. Geophys. Res.-Atmos., 106, 20653–20664, 2001.
Genthon, C., Kaspari, S., and Mayewski, P. A.: Interannual variabil-ity of the surface mass balance of West Antarctica from ITASE cores and ERA-40 reanalyses, 1958–2000, Clim. Dynam., 24, 759–770, doi:10.1007/s00382-005-0019-2, 2005.
Genthon, C., Magand, O., Krinner, G., and Fily, M.: Do cli-mate models underesticli-mate snow accumulation on the Antarc-tic plateau? A re-evaluation of/from in situ observations in East Wilkes and Victoria Lands, Ann. Glaciol., 50, 61–65, 2009. Goodwin, I. D.: Ice sheet topography and surface characteristics in
Eastern Wilkes Land, East Antarctica, ANARE Res. Notes, 64, 100 pp., Antarctic Division, Australia, 1998.
Helsen, M. M., Van den Broeke, M. R., Van de Wal, R. S. W., Van de Berg, W. J., Van Meijgaard, E., Davis, C. H., Li, Y. H., and Goodwin, I.: Elevation changes in Antarctica mainly determined by accumulation variability, Science, 320, 1626–1629, 2008. Higham, M. and Craven, M.: Surface Mass Balance and Snow
Sur-face Properties from the Lambert Glacier Basin Traverses 1990– 1994, Research report, Antarctic CRC, report no. 9, 129 pp., Uni-versity of Tasmania, Hobart, 1997
Krinner, G., Magand, O., Simmonds, I., Genthon, C., and Dufresne, J. L.: Simulated Antarctic precipitation and surface mass balance at the end of the twentieth and twenty-first centuries. Clim. Dy-nam., 28, 215–230, 2007.
Krinner, G., Guicherd, B., Ox, K., Genthon, C., and Magand, O.: In-fluence of oceanic boundary conditions in simulations of Antarc-tic climate and surface mass balance change during the coming
century, J. Climate, 21, 938–962. doi:10.1175/2007JCLI1690.1, 2008.
Lemke, P., Ren, J., Alley, R.B., Allison, I., Carrasco, J., Flato, G., Fujii, Y., Kaser, G., Mote, P., Thomas, R.H., and Zhang, T.: Ob-servations: Changes in Snow, Ice and Frozen Ground, in: Cli-mate Change 2007: The Physical Science Basis. Contribution of Working Group I to the Fourth Assessment Report of the Inter-governmental Panel on Climate Change, edited by: Solomon, S., Qin, D., Manning, M., Chen, Z., Marquis, M., Averyt, K. B., Tig-nor, M., and Miller, H. L., Cambridge University Press, Cam-bridge, United Kingdom and New York, NY, USA, 2007. Lenaerts, J. T. M., Van den Broeke, M. R., Scarchilli, C., and
Agosta, C.: Impact of model resolution on simulated wind, drift-ing snow and surface mass balance in Terre Adelie, East Antarc-tica, J. Glaciol., 58, 211, 821–829, doi:10.3189/2012JoG12J020, 2012a.
Lenaerts, J. T. M., Van den Broeke, M. R., Van de Berg, W. J., Meij-gaard, E. V., and Munneke, P. K.: A new, high-resolution surface mass balance map of Antarctica (1979–2010) based on regional atmospheric climate modeling, Geophys. Res. Lett., 39, L04501, doi:10.1029/2011GL050713, 2012b.
Magand, O., Genthon, C., Fily, M., Krinner, G., Picard, G., Frez-zotti, M., and Ekaykin, A. A.: An up-to-date quality-controlled surface mass balance data set for the 90◦–180◦E Antarctica sector and 1950–2005 period, J. Geophys. Res.-Atmos., 112, D12106, doi:10.1029/2006JD007691, 2007.
Magand, O., Picard, G., Brucker, L., Fily, M., and Genthon, C.: Snow melting bias in microwave mapping of Antarctic snow ac-cumulation, The Cryosphere, 2, 109–115, doi:10.5194/tc-2-109-2008, 2008.
Monaghan, A. J., Bromwich, D. H., and Wang, S. H.: Re-cent trends in Antarctic snow accumulation from polar MM5 simulations, Philos. T. R. Soc. A, 364, 1683–1708, doi :10.1098/rsta.2006.1795, 2006.
Mosley-Thompson, E., Thompson, L. G., Paskievitch, J. F., Pourchet, M., Gow, A. J., Davis, M. E., and Kleinman, J.: South Pole snow accumulation has increased in recent decades, Ann. Glaciol., 21, 182–188, 1995.
Mosley-Thompson, E., Paskievitch, J. F., Gow, A. J., and Thompson, L. G.: Late 20th Century increase in South Pole snow accumulation, J. Geophys. Res., 104, 3877–3886, doi:10.1029/1998JD200092, 1999.
Motoyama, H. and Fujii, Y.: Glaciological Data Collected by the 38th Japanese Antarctic Research, Expedition During 1997– 1998, Jare data reports, 28, National Institute of Polar Research, Tokyo, 1999.
M¨uller, K., Sinisalo, A., Ansch¨utz, H., Hamran, S.-E., Hagen, J.-O., McConnell, J. R., and Pasteris, D. R.: An 860 km surface mass-balance profile on the east Antarctic plateau derived by gpr, Ann. Glaciol., 51, 1–8, 10.3189/172756410791392718, 2010. Pirrit, J. and Doumani, G. A.: Glaciology, Byrd Station and Marie
Byrd Land Traverse, 1959–1960, Report 968-2, IGC Antarc-tic Glaciological Data Field Work 1959, Ohio State Univ. Res. Found., Columbus, Ohio, 1961.
Rotschky, G., Holmlund, P., Isaksson, E., Mulvaney, R., Oerter, H., Van den Broeke, M. R, and Winther, J. G.: A new surface ac-cumulation map for western Dronning Maud Land, Antarctica, from interpolation of point measurements. J. Glaciol., 53, 385– 398, doi:10.3189/002214307783258459, 2007.
Scambos, T. A., Frezzotti, M., Haran, T., Bohlander, J., Lenaerts, J. T. M., Van den Broeke, M. R., Jezek, K., Long, D., Urbini, S., Farness, K., Neumann, T., Albert, M., and Winther, J.-G.: Ex-tent of low-accumulation “wind glaze” areas on the East Antarc-tic plateau: implications for continental ice mass balance, J. Glaciol., 58, 633–647, doi:10.3189/2012JoG11J232, 2012. Shepherd, A., Ivins, E. R., A, G., Barletta,V. R., Bentley, M. J.,
Bet-tadpur, S., Briggs, K. H., Bromwich, D. H., Forsberg, R., Galin, N., Horwath, M., Jacobs, S., Joughin, I., King, M. A., Lenaerts, J. T., Li, J., Ligtenberg, S. R., Luckman, A., Luthcke, S. B., McMil-lan, M., Meister, R., Milne, G., Mouginot, J., Muir, A., Nicolas, J. P., Paden, J., Payne, A. J., Pritchard, H., Rignot, E., Rott, H., Sørensen, L. S., Scambos, T. A., Scheuchl, B., Schrama, E. J., Smith B., Sundal, A. V., van Angelen, J. H., van de Berg, W. J., van den Broeke, M. R., Vaughan, D. G., Velicogna, I., Wahr, J., Whitehouse, P. L., Wingham, D. J., Yi, D., Young, D., and Zwally, H. J.:: A reconciled estimate of ice-sheet mass balance, Science, 338, 1183–1189, doi:10.1126/science.1228102, 2012. Shimizu, H.: Glaciological studies in West, 1960–1962, in:
Antarc-tic Snow and Ice Studies, Antarct. Res. Ser., 2, edited by: Mellor, M., 37–64, AGU, Washington, DC, 1964.
Simmons, A., Uppala, S., Dee, D., and Kobayashi, S.: ERA-Interim : New ECMWF reanalysis products from 1989 onwards, ECMWF Newsletter, 110, 25–35, 51, 72, 2006.
Sinisalo, A., Moore, J.C., Van de Wal, R. S. W., Bintanja, R., and Jonsson, S.: A 14 year mass-balance record of a blue-ice area in Antarctica, Ann. Glaciol., 37, 213–218, 2003.
Thomas, R. H., Mac Ayeal, D. R., Eilers, D. H., and Gaylord, D. R.: Glaciological studies on the Ross ice shelf, Antarctica, 1973– 1978, Antarct. Res. Ser., 42, 211–53, 1984.
Van de Berg, W. J., Van den Broeke, M. R., Reijmer, C., and Van Meijgaard, E.: Reassessment of the Antarctic sur-face mass balance using calibrated output of a regional at-mospheric climate model, J. Geophys. Res., 111, D11104, doi:10.1029/2005JD006495, 2006.
Vaughan, D. G. and Russell, J.: Compilation of surface mass bal-ance measurements in Antarctica, Internal Rep. ES4/8/1/1997/1, 56 pp., Br. Antarct. Surv., Cambridge, UK, 1997.
Vaughan, D. G., Bamber, J. L., Giovinetto, M., Russell, J., and Cooper, A. P. R.: Reassessment of net surface mass balance in Antarctica, J. Climate, 12, 933–946, 1999.
Verfaillie, D., Fily, M., Le Meur, E., Magand, O., Jourdain, B., Ar-naud, L., and Favier, V.: Snow accumulation variability derived from radar and firn core data along a 600 km transect in Adelie Land, East Antarctic plateau, The Cryosphere, 6, 1345–1358, doi:10.5194/tc-6-1345-2012, 2012.