Université de Montréal
Reactive Hyperemia as endothelial function determinant using
plethysmography methods
By Nina Olamaei
In the
Biomedical Engineering Institute Faculty of Medicine
Presented to the Faculty of graduate studies
in partial fulfillment of the requirements for the degree of Master of applied science in biomedical engineering at Montreal University
Montreal, Quebec, Canada
January 2009
Université de Montréal Faculty of graduate studies
This thesis entitled:
Reactive Hyperemia as endothelial function determinant using plethysmography methods
Presented by: Nina Olamaei
was evaluated by a jury made up of the following people:
Hervé GAGNON President-reporter François HAREL Supervisor Anique DUCHARME Member of jury
Abstract
Atherosclerotic diseases are mainly caused by coronary and peripheral blood vessel disorders. Endothelial dysfunction represents an early phase in these diseases, when patients are generally asymptomatic.
We developed a technique, based on near infrared spectroscopy (NIRS), for measurement of arterial blood flow variations in limbs during reactive hyperemia. The technique allows the study of the level of vascular impairment and probably quantifying the level of endothelial dysfunction at peripheral arteries.
The experiment was performed on two cohorts of 13 and 15 patients and was compared to strain gauge plethysmography (SGP) which is considered as gold standard.
Afterward, we characterized endothelial reaction during reactive hyperemia through blood flow variations by modeling the hyperemic curve. Preliminary studies have shown that the hyperemic response generally adopts a bimodal form. The first peak was attributed to myogenic reaction that is endothelial independent and the second one to local endothelial cells reaction. The quantification of the two hyperemic response components makes it possible to calculate an index of ‘health’ for local endothelial cells, named ηfactor.
The results showed a strong correlation (r = 0.91) of blood flow measurements between the developed method and the gold standard. We concluded that NIRS is a precise technique for non-invasive measurement of blood flow. Moreover, we found a high repeatability (ICC = 0.9313) of the ηfactor in repeated measurements indicating its robustness. Nonetheless, more studies are required to validate the diagnosis value of the defined factor.
Key words: reactive hyperemia, myogenic response, endothelial dependent vasodilatation, nitric oxide, atherosclerosis, near infrared spectroscopy (NIRS)
Résumé
L’atteinte de la fonction endothéliale représente une phase précoce de l’athérosclérose, un stade où les patients sont généralement asymptomatiques. Il existe donc un intérêt certain à détecter la dysfonction endothéliale.
Nous avons développé une technique de mesure des variations de flot artériel au niveau des membres supérieurs, basée sur la spectroscopie proche infrarouge (NIRS). Cette approche permettrait d’étudier le niveau d’atteinte vasculaire et probablement de quantifier le degré de dysfonction endothéliale périphérique lors d’une hyperémie réactive.
L'expérience a été exécutée sur deux cohortes de 13 et de 15 patients et a été comparée à la pléthysmographie par jauge de contrainte (SGP) qui est considérée comme une méthode de référence.
Par la suite, nous avons caractérisé la réponse endothéliale par modélisation de la courbe hyperémique du flot artériel. Des études préliminaires avaient démontré que la réponse hyperémique adoptait majoritairement une forme bi-modale. Nous avons tenté de séparer les composantes endothéliales-dépendantes et endothéliales-indépendantes de l’hyperémie. La quantification des deux composantes de la réaction hyperémique permet de calculer un indice de la ‘santé’ du système endothélial local. Cet indice est nommé le ηfactor.
Les résultats montrent une forte corrélation des mesures de flots entre la technique développée et la méthode de référence (r=0.91). Nous avons conclu que NIRS est une approche précise pour la mesure non-invasive du flot artériel. Nous avons obtenu une bonne répétabilité (ICC = 0.9313) pour le ηfactor indiquant sa robustesse. Cependant des études supplémentaires sont nécessaires pour valider la valeur de diagnostic du facteur défini.
Mots clés: hyperémie réactive, réponse myogénique, oxyde nitrique, athérosclérose, spectroscopie proche infrarouge
Acknowledgments
I would like to express my deepest appreciation to my supervisor, Dr. François Harel, who enabled me the chance to pursue an M.Sc. degree at Montreal University in Canada with financial support. To me, it was a dream come true. I deeply acknowledge his knowledge and review of my data and I am fully aware of his support. I can never thank him enough.
I would like to thank my colleague, Quam Ngo, for his contribution to this project as well as his willingness and friendship. I thank Vincent Finnerty for giving me critical and thoughtful comments and the time that he committed for correction of this thesis report.
I would also like to thank Thanh-Thuy Vo Thang who was concerned about me all the time and provided encouragement and friendship. My colleagues from the Montreal Heart Institute including Maryse Bolduc, Sébastien Authier, Sophie Marcil and Matthieu Pelletier-Galarneau helped me in my research work. I want to thank them for all their help.
Finally, I am grateful of my parents and my dearest friend, Soroush, for their support, love and encouragement.
Table of contents Abstract... i Résumé... ii Acknowledgments... iii Table of contents... iv List of figures... vi
List of tables... vii
List of abbreviations ... viii
Chapter 1: Introduction... 1
Chapter 2: Literature review ... 3
2.1 Blood vessel wall ... 3
2.1.1 Endothelium (intima) ... 4
2.1.2 Smooth muscle cells (media)... 9
2.1.3 Nerve endings (adventitia)... 10
2.1.4 Vascular tone regulation stimuli... 10
2.1.5 Atherosclerosis and endothelial dysfunction ... 15
2.2 Quantification of endothelial function and blood flow measurement ... 16
2.2.1 Non-invasive developed methods... 17
Chapter 3: Methodologies... 27
3.1 Instrumentation ... 27
3.1.1 Oxygenation monitor (NIRO-200) ... 28
3.1.2 Strain gauge plethysmograph ... 31
3.1.3 Electrocardiograph (AccuSync)... 32
3.1.4 Analog to digital converter (ADC) and RS232... 32
3.2 Protocol design... 32
3.3 Experiments setup... 33
3.4 Blood flow measurement ... 36
3.5 Experiment1... 37 3.5.1 Subjects ... 37 3.5.2 Protocol... 38 3.5.3 Setup... 38 3.5.4 Statistical analysis ... 38 3.6 Experiment2... 38 3.6.1 Subjects ... 42 3.6.2 Protocol... 42 3.6.3 Setup... 43 3.6.4 Data analysis ... 43 3.6.5 Statistical analysis ... 44 Chapter 4: Results... 45
4.1 NIRS method vs. gold standard (SGP) ... 45
4.2 ηfactor and repeatability ... 48
Chapter 5: Discussion ... 51
5.1 Oxygenation monitor NIRO-200 ... 51
5.3 Other studies ... 53
5.4 ηfactor and its clinical utility ... 54
5.5 NIRS technique advantages and limitations ... 56
Chapter 6: Conclusion... 58
List of figures
Figure 2-1: Blood vessel wall components: intima, media and adventitia. ... 4
Figure 2-2: Vascular remodeling agents: signals, sensors and mediators [2]... 5
Figure 2-3: The pathway of endothelial derived relaxing factor release [12-14] ... 7
Figure 2-4: Blood flow during reactive hyperemia, following an ischemic condition... 14
Figure 2-5: Stages of endothelial dysfunction in atherosclerosis. ... 16
Figure 2-6: Strain gauge plethysmography... 18
Figure 2-7: Molar absorption coefficients of oxy- and deoxy-hemoglobin in near-infrared region ... 19
Figure 2-8: Light pathlength in a non scattering (a) and a scattering (b) medium. ... 21
Figure 2-9: Forearm near infrared spectroscopy... 22
Figure 2-10: The instrument design of a modular NIRS system by Warier et al. ... 23
Figure 3-1: Schematic of two measurement modality systems. ... 27
Figure 3-2: Niro-200 emission and two-segment detection probe... 30
Figure 3-3: Study protocol timeline... 33
Figure 3-4: Cuffs position on patient arms during the experiment... 34
Figure 3-5: NIRS probe and strain gauge position. ... 35
Figure 3-6: Acquisition interface. ... 36
Figure 3-7: Linear regression application for calculation of arterial inflow with NIRS. ... 37
Figure 3-8: Blood flow variation during RH measured by NIRSP... 39
Figure 3-9: Vasoactivation steps during three stages of the experiment. ... 40
Figure 3-10: Blood flow measurement by NIRSP at three stages of study. ... 41
Figure 3-11: Gamma variate function fitting on the first and second detected peaks. ... 44
Figure 4-1: Left forearm blood flow measurements by NIRS and SGP during three stages of experience ... 45
Figure 4-2: Linear regression between two modalities (SGP and NIRS)... 46
Figure 4-3: Bland-Altman graph of flow measurements with linear regression ... 47
Figure 4-4: Blood flow measurements during RH by SGP and NIRS. ... 47
Figure 4-5: Comparison of flow measurements at baseline and post-RH period using paired student’s test... 48
Figure 4-6: One-way ANOVA test showed that there is no significant difference among three repeated groups of measurements... 49
Figure 4-7: Linear regression between repeated measurements at t=0 and t=24h... 49
Figure 4-8: Linear regression between repeated measurements at t=24h and t=27h... 50
Figure 4-9: No significant difference was shown among the means tPeak... 50
Figure 5-1: Blood volume variations during venous occlusions by SGP and NIRSP. ... 52 Figures 2-1, 2-2, 2-3, 2-5, 2-6, 2-9, 3-1 and 3-9 were produced using Servier Medical Art.
List of tables
Table 2-1: Responses of endothelium to mechanical forces including shear stress and stretch... 8
Table 2-2: Endothelial responses to relatively high and low hemodynamic shear stress ... 12
Table 3-1: Patient population characteristics for experiment1 ... 38
List of abbreviations
AA Arachidonic Acid
ACh Acetylcholine
ADC Analog-to-digital converter
ATP Adenosine triphosphate
CAD Coronary artery disease
cGMP Cyclic guanosine monophosphate
CNS Central nervous system
COX Cyclo oxygenase
DPF Differential pathlength factor
ECG Electrocardiogram
EDHF Endothelial derived hyperpolarizing factors
EDRF Endothelial derived relaxing factors
FMD Flow mediated dilatation
Hb Hemoglobin
ICC Intraclass correlation coefficient
LBNP Lower body negative pressure
LDL Low density lipid
L-NMMA L-NG-monomethyl arginine
NIR Near infrared
NIRS Near infrared spectroscopy
NIRSP Near infrared spectroscopy plethysmography
NO Nitric oxide
NOS Nitric oxide synthase
PGI2 prostaglandin I2
PLA2 Phospholipase A2
RH Reactive hyperemia
sGC Soluble guanylyl cyclase
SGP Strain gauge plethysmography
Chapter 1: Introduction
Atherosclerotic diseases are one of the major causes of death and morbidity. Common conditions such as hypercholesterolemia, hypertension, diabetes, and smoking are associated with endothelial dysfunction. These conditions prompt atherosclerosis, indicating the fact that endothelial dysfunction is a premature stage in atherosclerotic diseases, where patients are generally asymptomatic [1].
Endothelium plays a critical role in modulation of the tone of the underlying vascular smooth muscle cells through release of a variety of autocrine and paracrine substances [2]. Importantly, a healthy endothelium inhibits platelet and leukocyte adhesion to the vascular surface, thereby limiting thrombosis.
Nitric oxide (NO) appears to be a particularly important relaxing factor produced by endothelial cells. NO inhibits adhesion and aggregation, maintaining the balance of prothrombotic activity [3, 4]. In patients with coronary diseases, platelet derived NO production is remarkably reduced. This condition is considered as an independent predictor of acute coronary events [5].
Endothelial function has been assessed largely in terms of endothelial dependent vasodilatation, based on the results showing that this response is impaired in patients with atherosclerosis risk factors. This condition can be assessed in catheterization laboratory by coronary intra-arterial infusion of NO agonists, such as acetylcholine (ACh) [6]. Particularly, stimuli that increase production of endothelium-derived NO are used in evaluation of endothelial dependent vasodilatation in humans. Such stimuli include increased shear stress from increased blood flow and infusion of NO agonists such as acetylcholine, bradykinin, or a neuropeptide known as substance P. Several studies have been developed to assess endothelial function non-invasively in peripheral arteries. It has been established that endothelial function in coronary artery is strongly related to that in a peripheral conduit vessel [7].
Strain gauge plethysmography (SGP) is the gold standard method for non-invasive assessment of endothelial function by intra-arterial infusion of ACh [8]. However arterial catheterization for ACh injection is needed in this method. Reactive hyperemia (RH) is a less invasive method to stimulate endothelial cells activation. The technique is based on creation of an acute increase in the limb blood flow through a temporary ischemic condition. The transition state at the release of ischemia induces remarkable amount of shear stress on vascular endothelium that stimulates
release of NO from endothelial cells [9-11]. We used a near infrared spectroscopy (NIRS) device to monitor tissue oxygenation state during reactive hyperemia. The device provides different parameters such as total hemoglobin variations at relatively high sampling rate (6 Hz). We were interested in the relation between oxygenation state and arterial inflow. We assumed that variations in total hemoglobin in terms of time correlate with total blood volume changes.
It was to our interest to evaluate the endothelial function and particularly the NO dependent vasodilatation by monitoring the peripheral arterial flow variations during the reactive hyperemia. Endothelial function assessment results in identification of a group of patients who are relatively at higher risks for cardiovascular events but yet not qualified for medical therapy according to current medical guidelines. This group of patients would benefit from a more aggressive medical or lifestyle treatment.
The purpose of this study is:
1) Evaluate the ability of the NIRS device to measure forearm blood flow during reactive hyperemia by comparing to SGP;
2) Characterize the function of blood flow variations measured by NIRS plethysmography (NIRSP), during reactive hyperemia.
Chapter 2: Literature review
Heart and blood vessels form the cardiovascular system. Blood vessels play an important role in initialization and development of atherosclerotic vascular diseases. They consist of three different layers through which vascular tone is controlled. Each layer contributes to vascular tone through different mechanisms. Endothelium, which is the inner most layer of blood vessels, has a significant contribution to this regulation.
This chapter presents a brief introduction on different mechanisms of vascular tone regulation along with their effect on blood flow variation. Afterwards, non-invasive methods of blood flow measurement are presented.
2.1 Blood vessel wall
Blood vessels transport blood throughout the whole body. There are three general types of blood vessels: arteries, veins and capillaries. Arteries carry blood away from the heart while the veins carry it back to the heart. Arteries and veins are connected by capillaries, where the exchange of nutrients and chemical wastes is carried out.
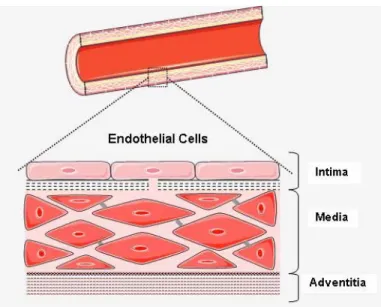
Except for capillaries, the two other types of blood vessels consist of three layers: intima, media and adventitia (Figure 2-1).
The intima is a fine layer of endothelial cells in direct contact with circulating blood. Endothelial cells are oriented along the axis of the blood vessels and blood flow. This specific orientation streamlines the endothelial cells to decrease the resistance of the vessels to blood flow.
The media includes smooth muscle cells and is composed of collagen and elastin. It contains terminal nerve endings in some parts, particularly in veins.
The adventitia which is the outermost layer of blood vessels is a fiber elastic layer and it contains terminal nerve endings as well.
Capillaries consist of a layer of endothelial cells surrounded by pericytes that control the vessel diameter.
Figure 2-1: Blood vessel wall components: intima, media and adventitia.
2.1.1 Endothelium (intima)
Endothelium is a fine layer of cells in direct contact with circulating blood. It has functional characteristics of an organ as it controls different functions:
1) Blood pressure control (through vasoconstriction and vasodilatation), 2) Blood fluidity,
3) Angiogenesis,
4) Synthesis and degradation of extra cellular matrix, 5) Inflammation.
The healthy endothelium mediates endothelial dependent vasodilatation along with suppression of thrombosis and vascular inflammation. Therefore, the healthy layer of endothelium is crucial for normal operation of vessels. Endothelium is located strategically to serve as a sensory cell. They participate in vascular remodeling and activation of substances in response to different kinds of physical and chemical stimuli. The pathways mediating the response of endothelium to stimuli are complicated and yet to be fully understood.
The endothelial surface is constantly exposed to two categories of stimuli:
- Chemical substances such as neurotransmitters and inflammatory mediators; - Hemodynamic forces such as shear stress.
There are a variety of receptors on the surface of endothelial cells to detect physical and chemical stimuli (Figure 2-2). The detected signal is then relayed within the cells and to adjacent cells. In response, endothelial cells release activation substances that influence the cell growth and death, vasodilatation, vasoconstriction and extra cellular matrix composition.
Figure 2-2: Vascular remodeling agents: signals, sensors and mediators [2].
Endothelial cells, as well as smooth muscle cells, are connected via gap junctions.
Endothelial dependent vasodilatation
As vasodilator substances, endothelium releases either relaxing factors, called endothelial dependent relaxing factors (EDRF), or hyperpolarizing factors, called endothelial dependent hyperpolarizing factors (EDHF). Both categories of substances lead to vasodilatation but through different pathways.
Endothelial dependent vasodilatation is triggered by either chemical substances such as acetylcholine, or hemodynamic stimuli such as shear stress. The result is release of EDRF. Nitric oxide (NO) appears to be a particularly important relaxing factor produced by endothelial cells. It is a mediator of endothelium dependent vasodilatation as well as having anti-inflammatory and antithrombotic effect. NO is highly reactive with a half life in the order of a few seconds (2-5 s)
and it diffuses rapidly through cell membranes [3]. Therefore its chemical characteristics make it an excellent agent for short-term and localized responses. NO is synthesized from L-arginine (L-Arg), an amino acid, and oxygen in the presence of enzyme NO synthase (NOS) [4].
Ohno et al. verified the signal transduction pathway of flow induced release of EDRF [12]. Shear stress or the agents with vasoactive properties interact with specific receptors that are located on endothelial cells surface. Consequently, intracellular calcium concentration in endothelial cell increases. Calcium activates NOS, an enzyme that is necessary for NO synthesis. NO reaches other endothelial and smooth muscle cells in the neighborhood. NO in smooth muscle cells stimulates another enzyme sGC (soluble guanylyl cyclase) that synthesizes cyclic guanosine monophosphate (cGMP). Cyclic GMP acts as a second messenger and it activates intracellular protein kinases that mediate smooth muscle cells relaxation and vasodilatation (Figure 2-3). However, the pathway by which protein kinases mediates smooth muscle relaxation remains to be fully understood.
There are other endothelial dependent vasodilator agents other than NO, such as prostacyclin (PGI2) (Table 2-1).
PGI2 is another relaxing and anti-thrombosis agent that is released from endothelial cells. Increased calcium activates NOS and phospholipase A2 (PLA2) as well. Activated PLA2 forms prostacyclin metabolism of arachidonic acid (AA) and cyclo oxygenase, (COX)-1.
Mitchell et al. showed that prostacyclin and NO are coreleased from endothelial cells and they act in synergy to inhibit platelet activation and limiting thrombosis [4].
Figure 2-3: The pathway of endothelial derived relaxing factor release [12-14].
There is another relaxant pathway mediated by endothelial cells. EDHF, whose chemical composition is unknown, causes arterial vessels to dilate while NO and prostacyclin productions are inhibited. Potassium channels blocker stops the vasodilatory effect of EDHF, indicating their involvement in the mechanisms of EDHF-mediated vasodilatation. The contribution of EDHF mediated response seems to be greater in smaller vessels [13]. EDHF is known to be released by endothelial cells in response to shear stress but little is known about its mechanism. It seems that the presence of shear stress causes the increase of intracellular calcium concentration in endothelial cells which activates calcium dependent potassium (KCa) channels. Opening of the endothelial KCa channels causes potassium ions to be accumulated in the intracellular space between endothelial cells and smooth muscle cells. Increase in myo-endothelial potassium concentration induces hyperpolarization of vascular smooth muscle cells [13]. Table 2-1 summarizes some of the known responses of endothelium to mechanical forces [15].
Mechanical force effects Significance Response time
Release of NO Vasodilatation secs Release of acetylcholine and
substance P
Neurotransmitter release secs Activation of adenylate cylase Vasodilatation mins Release of prostacyclin (PGI2) Vasodilatation and antithrombotic regulation < 2 min Release of EDHF Vasodilatation unknown
Release of endothelin Vasoconstriction 2-4 h Angiotensin II Vasoconstriction unknown
Decrease of intracellular pH Modulation of ionic
balance > 3 h Cell alignment in direction
of flow
Minimizes drag on endothelial cells
> 6h LDL metabolism stimulation Endothelial cholesterol
balance
24h Mechanical stiffness of cell
surface
Deformability decrease 24 h
Table 2-1: Responses of endothelium to mechanical forces including shear stress and stretch [15].
Endothelium response to physical and chemical stimuli in subjects with and without atherosclerotic diseases has been studied by many researchers. Anderson et al. compared the endothelial dependent vasodilatation in brachial and coronary arteries in the same patients with various degrees of coronary atherosclerosis [7]. They found that brachial artery is an accessible indicator of endothelium health and the risk of coronary atherosclerosis.
Gokce et al. determined that non-invasive detection of endothelial dysfunction in the brachial artery provides independent prognostic information [16]. They examined flow mediated dilatation (FMD) in patients who were supposed to undergo cardiac surgery up to 1 month before the surgery. They showed that patients with post operative events had significantly lower flow mediated dilatation. They concluded that endothelial dysfunction is an independent predictor of
post operative cardiovascular events and non-invasive assessment of endothelial function in a peripheral artery provides prognostic information.
2.1.2 Smooth muscle cells (media)
The contraction of smooth muscles is mediated through an actin-myosin sliding mechanism that is initiated by calcium binding to myosin. The energy of the process is provided by the hydrolysis of ATP. Vascular smooth muscle contraction and dilatation is responsible for blood volume changes and thus local pressure control. Since arteries carry the blood away from the heart to all the organs, they have more smooth muscle fibers within their walls. Vascular smooth muscle is innervated by the sympathetic nervous system. Three types of receptors (α1, α2, β2) are located within vascular smooth muscle cells that cause either vasodilatation or vasoconstriction.
Myogenic response
Vascular smooth muscles are responsible for the establishment of basal vascular tone and autoregulation of blood flow through reaction to chemical and physical stimuli. The myogenic response has been found in all types of vessels. Itis most pronounced in arteries but it can be present in venules and veins. It is established that myogenic response is endothelial independent and depends mainly on smooth muscle cells reaction. It has been suggested that pressure-induced changes of vessel wall tension, and not the pressure itself, is the stimulus for myogenic response [14].
Rapid increase in transmural pressure induces an increment in vessel wall tension. Stretch activated cation channels on the surface of smooth muscle cells detect the increase in wall tension and produce membrane depolarization. Depolarization lead to calcium influx and initialization of actin-myosin sliding mechanisms [14, 17].
Calcium influx following an increase in pressure was still present with the removal of the endothelium in a rat experience, indicating the existence of the endothelial independent pathway of vasoconstriction [18]. Pressure step causes the arterioles diameter to decrease and rapidly return to baseline diameter [17, 18].
Another pathway, other than physical stimulus, for vascular smooth muscle cells stimulation are exogenous donors of NO such as sodium nitroprusside and nitroglycerine [7, 16, 19, 20]. Sublingual application of nitroglycerine is widely used in myogenic response studies as an exogenous donor of NO that causes vasodilatation and acts directly on smooth muscle cells.
Anderson et al. demonstrated that coronary response to nitroglycerin was not significantly different between the group of patients with various degrees of coronary atherosclerosis and the control group [7]. Gokce et al. also observed no relationship between nitroglycerine dependent vasodilatation and cardiovascular events [16].
2.1.3 Nerve endings (adventitia)
Adventitia is the outermost layer of blood vessels, innervated by the central nervous system (CNS) that is responsible for several homeostatic mechanism regulations in the human body. The smooth muscles cells activity is controlled via vasomotor neurofibers of the sympathetic nervous system (SNS). The SNS is always active at a basal tone and causes vasodilatation or vasoconstriction according to the organ needs. The transmitters released from nerve endings, such as noradrenalin and adrenaline, bind to adrenergic receptors and alter vascular basal contraction level. The adrenergic receptors of type α1 and α2 cause the smooth muscle cells to contract while the receptors of type β2 cause the muscle cells to dilate. González et al. verified the effect of adventitia removal on vascular function modulation. They demonstrated that contraction capacity of endothelium was reduced by adventitia removal [21]. Hijmering et al. studied the interaction between endothelium dependent vasodilatation and the sympathetic system using lower body negative pressure (LBNP) technique. They found the sympathetic stimulation could impair flow-mediated endothelial-dependent dilatation through a mechanisms caused by adrenergic receptors of type α [19]. They concluded that released transmitters from nerve endings are important modulators of endothelial function and myogenic response.
2.1.4 Vascular tone regulation stimuli
Vascular endothelial cells create an interface between circulating blood and vessel wall. They are exposed continuously to a variety of hemodynamic factors and chemical mediators. The structure and function of blood vessels are influenced by long term exposure to these factors.
1- Shear stress
Shear stress arises from the pulsatility of blood pressure that creates a radial velocity gradient of blood flow through a blood vessel. The velocity of blood particles is at its minimum at the wall of the blood vessels. The shear stress exerted on the vessels walls is function of the velocity profile slope at the wall.
( )
wall dV y dy ητ
= ⋅ (2.1)whereτ is the shear stress, η is the blood viscosity,V y
( )
is the velocity profile along the radial axis y and dV y( )
/dy represent the wall shear rate (sec-1). The blood is considered a Newtonian fluid with constant viscosity. In microvessels, where flow rates are relatively steady, shear stress could be expressed as [11, 22]: 8 wall V D ητ
= × × (2.2) 2 Flow V= ×πr (2.3)where V is the blood velocity and r and D are the blood vessel radius and diameter respectively. Shear stress is expressed in dyne/cm2. The level of wall shear stress varies in different parts of blood circulation. It varies from 1 to 6 dyne/cm2 in the venous system and from 10 to 70 dyne/cm2 in the arterial system.
The nature of shear stress exerted on endothelial cells is a function of blood flow pattern that is itself influenced by cardiac cycles. Therefore, endothelial cells experience a pulsatile shear stress with fluctuation in magnitude. Greater positive shear stress is exerted on endothelial cells surface while the magnitude of fluctuations increase.
The endothelial cells, exposed to positive shear stress, reorient along the longitudinal axis of the vessel wall. This reorientation acts as a negative feedback helping to decrease the vessel resistance and the shear stress [10]. In contrast, in the areas with low mean shear stress, endothelial cells fail to maintain contact with each other and they would be randomly oriented. Malek et al. studied the effect of fluid shear stress on transformation of endothelial cells [23]. They showed that bovine aortic endothelial cells exposed to shear stress of approximately 15 dyne/cm2 align in the direction of blood flow while those exposed to lower shear stress (0 – 4 dyne/cm2)were likely to orient randomly.
Ku et al. have measured blood flow velocity and shear stress at the human carotid bifurcation by laser Doppler and under pulsatile flow condition [24]. The medial wall of carotid bulb experiences a higher shear stress compared to the lateral wall. Their study confirmed that plaques tend to form more in the areas experiencing lower shear stress.
Indeed, at the sites with less shear stress, an increase in leukocytes uptake and adhesion on the endothelial cells surface is observable. Steady laminar shear stress causes the endothelial cells to release antithrombotic and antimigration agents. In contrast, reversal flow and lower shear stress promote the release of prothrombotic and pro-apoptosis. Moreover, it is a weaker inducer of NOS. In this condition the production of NO and prostacyclin decreases while the production of endothelin, which is an effective vasoconstrictor, increases [2, 10].
The shear stress effect is exerted through the activation of NOS enzyme and the production of NO. The mechanism involves potassium channels activation as mechanosensory transducer of the shear stress [2, 12]. Table 2 summarizes endothelial response to hemodynamic shear stress based on the Malek et al. study.
Endothelium response Shear stress > 15 dyne/cm2 Shear stress ≈ 0-4 dyne/cm2
Vasoconstrictors Endothelin Angiotensin Low High Vasodilators NO Prostacyclin High Low Antioxidant enzymes
(COX)-1 High Low
Inflammatory mediators Monocyte chemotactic peptide Low High Thrombosis Low High Endothelial proliferation
and apoptosis Low High
Reactive hyperemia
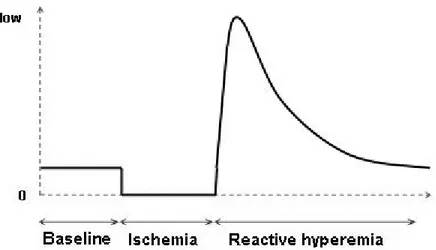
The creation of shear stress in accessible human blood vessels is a method for endothelial dysfunction evaluation. Reactive hyperemia is a transient increase in blood flow following a period of ischemia. The transition state at the release of ischemia induces a remarkable amount of shear stress on a blood vessels walls (Figure 2-4). Increases in shear stress trigger rapid activation of NOS. This is a widely used method to evaluate the autoregulation capacity of vessel endothelium to return the increased blood flow to the baseline [7, 9, 16, 25]. It has been established that the nature of shear stress is affected by the duration of ischemia. Leeson et al. verified the relation of endothelial dependent vasodilatation and the duration of ischemia. They induced reactive hyperemia with cuff occlusion of 0.5, 1.5, 2.5, 3.5, 4.5 and 8 min. They found that 4.5 minute of cuff occlusion is required to induce a maximal vessel dilatation that arrives one minute after release of cuff occlusion [26]. Mullen et al. demonstrated that L-N-methyl-Arginine (L-NMMA.), the competitive antagonist of NO synthesis, attenuated FMD after a 5 minute occlusion time while after 15 minutes of occlusion, no effect on FMD was observed [27]. It indicates that 5 minute occlusion time induce an endothelial dependent vasodilatation while increasing the duration of ischemia results in an endothelial independent vasodilatation. Another study by Pyke et al. shows that by increasing the duration of shear stress, the FMD response is no longer NO or PGI2 dependent [11]. Therefore reactive hyperemia created by appropriate ischemia duration induces NO dependent vasodilatation and seems to be an appropriate physical stimulus to evaluate endothelial function.
Figure 2-4: Blood flow during reactive hyperemia, following an ischemic condition.
2- Transmural pressure
Transmural pressure is the pressure across the blood vessel walls. In many organs, the blood flow remains at a constant level despite big variations in blood pressure. This vascular autoregulation is mainly due to a pressure induced myogenic response. It is established that in low pressure ranges, 10-40 mmHg, passive distention causes vessel diameters to increase. However, at higher transmural pressures, 60-100 mmHg, active myogenic response results in vessel diameter decrease and vasoconstriction [14]. The sensors that detect the variations of wall tension are stretch activated cation channels. Their activation results in smooth muscle cells membrane depolarization and an increase in calcium influx. Therefore, a steep increase in transmural pressure from 0 to mean arterial pressure, which is the case at the onset of reactive hyperemia, causes an increase in vessel diameter followed by a decrease in diameter due to myogenic response.
3- Agonist agents
There are agonist mediators other than physical stimulus that induce a vasodilatation response. ACh, bradykinin or substance P are endogenous donors of NO that bind to specific receptors on the endothelial cells surface and cause the release of vasodilatory agents such as NO, EDHF and prostacyclin.
Nitroglycerine and sodium nitroprusside are exogenous donor of NO. They convert to NO in the body and they bypass the effect of endothelial cells, thereby inducing direct vasodilatation. Injection of acetylcholine in the arterial vessels and sublingual use of nitroglycerine are widely used methods to evaluate endothelial-dependent and endothelial-independent vasodilatation responses respectively [7]. Eskurza et al. demonstrated that there was a poor correlation between ACh-mediated vasodilatation and shear stress mediated vasodilatation indicating that they provide different information on the endothelial function [28]. It seems that ACh triggers the release of EDHF rather than EDRF (such as NO).
2.1.5 Atherosclerosis and endothelial dysfunction
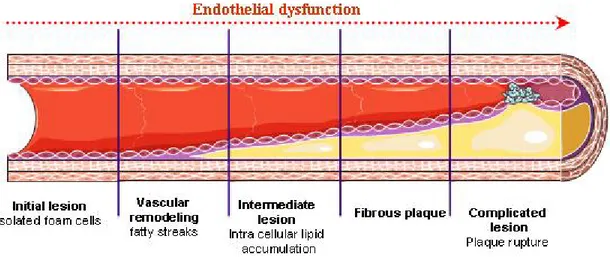
Atherosclerosis is a chronic inflammatory disease. Atherosclerotic lesions occur principally in elastic and muscular arteries. They develop when low density lipoprotein (LDL) molecules becomes oxidized by oxygen free radicals, which are highly present in arterial blood vessels. The immune system tries to repair the damage created by LDL, by sending leukocytes to the damaged location. However, macrophage blood cells are not able to absorb LDL and they cause extra amount of LDL and leukocyte accumulation within the arterial intima. This process leads to cholesterol plaque creation, remodeling of the artery, decreases of blood flow and shear stress (Figure 2-5).
Accumulation of oxidized LDL in vessel wall results in production of reactive oxygen species. These species are able to rapidly inactivate the production of NO. Most cardiovascular risk factors such as hypercholesterolemia, smoking and hypertension are associated with an increase in oxidative agents, damaging endothelial cells and reduced NO bioactivity [29].
Another important factor in initiation of atherosclerotic lesions is low levels of shear stress at blood vessel wall. The shape and orientation of endothelial cells is influenced by blood flow and shear stress at both intracellular and ultra structural levels. The most important structural manifestation of endothelial cells is their alignment in the blood flow direction. The F-actin filaments are band shaped microfilaments around the periphery of endothelial cells, which are called stress fibers. They are quite important to endothelial cells as they control cells adhesion and shape maintenance. In the region with high levels of shear stress, the stress fibers are aligned with those of neighboring cells. This alignment acts like a single large microfilament extended
on the adjacent endothelial cells able to distribute the shear stress throughout the cells, thereby limiting endothelial cells deformation. These microfilament bundles increase in number when the endothelial cells are exposed to relatively high level of shear stresses. However, in the sites with lower levels of shear stress due to decreased blood flow, endothelial cells adopt a relatively random shape and orientation and show an increase uptake of lipoproteins and leukocytes adhesions on the surface [10, 30].
Uematsu et al. demonstrated a positive correlation between wall shear stress and the extent of microfilament bundle distributions [31]. Their study suggests that low levels of shear stress decrease the formation of microfilament bundles leading to initiation of atherosclerosis.
Figure 2-5: Stages of endothelial dysfunction in atherosclerosis.
It is established that endothelial dysfunction is present at very early stages of atherosclerosis and before the disease becomes symptomatic.
2.2 Quantification of endothelial function and blood flow measurement
Reduced bioactivity of NO and enhanced activity of vasoconstrictor agents, in presence of atherosclerotic risk factor, are the main reasons for impaired vasodilator capacity of blood vessels. Vasodilator capacity of endothelial cells could be assessed by measurement of cells response to physical or chemical stimulation that trigger endothelium activation. Endothelium
activation in a healthy vascular system ends up with release of vasodilator agents such as NO and prostacyclin. However, in the presence of atherosclerosis risk factors or an established coronary heart disease, endothelial cells fail to normally respond to an increase in shear stress or endothelial receptors stimulation through releasing relaxing factors.
Several studies have been developed to evaluate endothelial function in patients at high risk for atherosclerosis as well as in patients with already established atherosclerotic disease. A number of invasive and non-invasive methods have been developed. The stimulation of endothelial cells is performed through:
- Agonist receptors stimulation by intra arterial infusion of nitric oxide;
- Shear stress elevation on blood vessel wall through creation of reactive hyperemia. Vasodilator effect of endothelium on blood vessel wall is evaluated through:
- Measurement of blood flow variations;
- Measurement of flow mediated dilatation (FMD); - Imaging techniques.
2.2.1 Non-invasive developed methods
In actual clinical situations, coronary endothelial function is assessed using coronary angiography by measuring vasomotor responses to an intra arterial infusion of ACh. However, arterial catheterization limits clinical application of this method in patients with low incident of coronary arterial diseases. Therefore applicable non-invasive methods in patients without known coronary artery seem to be essential in clinical situation. A number of non-invasive techniques with comparable results to invasive methods have been developed. In this section, various non-invasive methods of assessing endothelial function with peripheral arterial vasomotor responses are described.
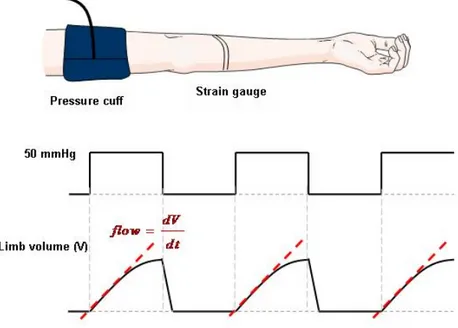
2.2.1.1 Strain gauge plethysmography (SGP)
Plethysmography is a method to measure volume changes within an organ. Strain gauge plethysmography involves measuring blood volume changes of a limb using a strain gauge. This is an extensively used and accepted method to quantify endothelial function non-invasively, through blood flow measurement [8]. A strain gauge is a stretchable silicone tube containing a
liquid metal such as mercury. The principle of blood volume measurement is based on the theory that the electrical resistance of the mercury filled silicone is directly proportional to its length which varies as forearm circumference change as a response to limb blood volume variations. Venous outflow is periodically halted and restarted through an inflatable cuff positioned on the upper limb. The cuff is inflated to 50 mmHg to prevent venous outflow without affecting arterial inflow. Consequently the limb swells as the arterial inflow accumulates in venous reservoir and results in an increase of limb volume during cuff inflation. Changes in limb volume are detectable via stain gauges that are placed on the limb. The upslope values of limb volume increase during cuff occlusions and are proportional to the arterial inflow (Figure 2-6).
Figure 2-6: Strain gauge plethysmography.
In many reactive hyperemia studies, this technique is used to measure forearm blood flow since it is considered a gold standard method [25]. Measurements are based on the assumption that increment in forearm volume is directly related to limb blood flow. The method is simple and inexpensive which makes its usage feasible for clinical applications. However, it does not provide regional information and should be recorded only in static situation since the technique is very sensitive to any movement of the limb. Therefore, the application of the method in blood flow measurements in dynamic conditions is limited.
2.2.1.2 Near infrared spectroscopy (NIRS)
Near infrared spectroscopy is the measurement of near infrared light (800-2500 nm) intensity and wavelength, absorbed by a sample such as human tissue. NIR light can penetrate relatively far into a sample (up to 6 cm in muscle). Biological tissue is a weak absorber and relatively strong scatterer of NIR light. The absorbed and transmitted light through human tissue contains information about sensitive chromophores (compounds which absorb light in the spectral region of interest) such as hemoglobin and myoglobin molecules, thus permitting the study of physical changes over time.
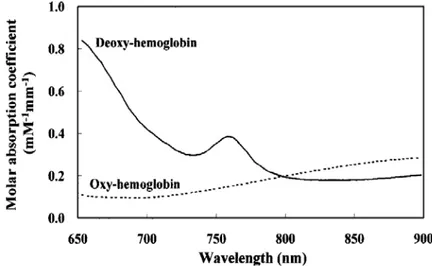
Each chromophore has its own particular absorption spectrum which describes the level of absorption at each wavelength (Figure 2-7).
Figure 2-7: Molar absorption coefficients of oxy- and deoxy-hemoglobin in near-infrared region measured by Yamashita et al. [32].
Wavelengths within the near infrared region seem to be suitable for the measurement of hemoglobin due to their relatively deep penetration. The wavelength region of 750 – 850 nm is widely used for non-invasive measurement of oxy and deoxy hemoglobin concentration since the two spectra intersect around a wavelength of 805 nm that provides a measurement independent of the degree of hemoglobin oxygenation allowing total hemoglobin concentration measurement [32]. The variations in the total hemoglobin reflect variations in the blood volume. Therefore, blood flow can be calculated by relative changes of total hemoglobin from the baseline at a given time. NIRS monitors oxygen asa tracer.
The principle of measurement
The relation between light absorption and chromophore concentration in a non scattering medium is described by Beer Lambert law:
0
log
I A d Iα
c
⎛ ⎞ = ⎜ ⎟ = ⋅ ⋅ ⎝ ⎠ (2.4)where A is light attenuation, I and I0 are incident and transmitted light intensities respectively, α
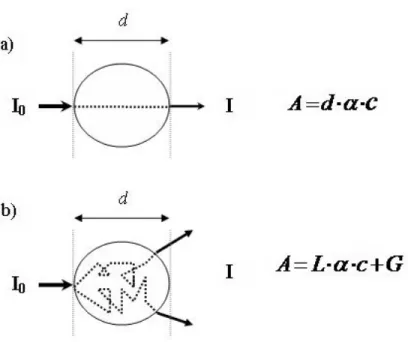
is the absorption coefficient, c is the chromophore concentration and d is the distance that light travels through the sample (physical distance between light emitter and detector). However, in a scattering medium such as biological tissue, light do not travel in a direct path and thus light attenuation is a complex function of tissue geometry, absorption and scattering coefficients. Therefore, the modified Beer Lambert law is expressed to take these variables into account:
0
log
I
A
L
G
I
α
⋅c
⎛ ⎞
=
⎜ ⎟
= ⋅
⎝ ⎠
+
(2.5)where L is the actual light pathlength which is not straight due to scattering (L>d), G is the light attenuation due to scattering that is an unknown parameter. Because of the later factor (G), the equation can not be solved to yield an absolute concentration of the chromophore. However, if G is considered as a constant parameter in terms of time, it is possible to measure relative variations of the chromophore concentration, oxy and deoxy hemoglobin (Figure 2-8).
A L
α
⋅c
Δ = ⋅ Δ
(2.6) Changes in C can be calculated relative to a starting point considered as zero.Figure 2-8: Light pathlength in a non scattering (a) and a scattering (b) medium.
The differential pathlength factor (DPF), which indicates light pathlength through tissue is measured by time resolved spectrometry method that is based on the measurement of time of ultrasound pulses flight through a tissue.
c t L
n ⋅
= (2.7) where c is sound speed and n is refractive index of tissue.
The modified Beer Lambert law is used for the measurement of relative variations in oxy and deoxy hemoglobin. The variations in total hemoglobin concentration correlate with variations in total blood volume, an assumption required for the measurement of blood flow [33].
NIRS probes have a special optical design. The emission probe radiates laser beams in NIR region and the detection probe detects attenuated light that has passed through the tissue of interest. The emission probe is made of fiber optics and the detection probe is a photodiode sensor (light to current converter) which is placed some centimeters apart from the emission probe. The emitted light illuminates the tissue in a ‘banana-shaped’ distribution providing information from relatively deep tissue layers. In human oxygenation measurements, the detection probe is usually placed on the same side and not on the opposite side. In this particular case, it detects a part of the diffused and reflected light (Figure 2-9).
Figure 2-9: Forearm near infrared spectroscopy.
The distance between emitter and detector is a compromise between received light intensity and deeper light traveling. In fact when the emitter-detector separation increases, the detected light intensity decreases while it carries more information from deeper layers of tissue. Therefore, specific emitter-detector separation provides information from specific layer of the tissue of interest. This separation is usually chosen to be between 2 and 3 cm [34, 35].
Yu et al. studied the dynamics of muscle blood flow during reactive hyperemia using NIRS [36]. They tried different source-detector separation configurations. They found that increase in source-detector separation causes an increase in blood flow and blood oxygen saturation overshoots following cuff occlusion while oxygen saturation undershoot during ischemia decreased.
Wariar et al. constructed a modular NIRS system for clinical measurement of impaired skeletal muscle [37]. Their system design leads to an understanding of the basis of an NIRS system. Elements of their systems are showed as a block diagram in Figure 2-10.
Figure 2-10: The instrument design of a modular NIRS system by Wariar et al. BPF represents band-pass filter [37].
They calculated variations in optical absorption at each wavelength from the logarithm of the measured output voltages ratio:
( )
log(
)
log o( )
dark o dark b dark V t V A t V V V V − Δ = −Δ − = − − (2.8)where Vdark is voltage output without any illumination source and Vb is voltage of forearm at rest
before any occlusion or activity. Changes in absorption are then converted to changes in concentration of oxy- and deoxy- hemoglobin.
A
λα
λc
d
Δ =
∑
⋅Δ ⋅
(2.9) 2.2.1.3 Other methodsPulsed Doppler Ultrasound
This echography approach provides both blood vessel image and the velocity of the blood in the artery. Volume blood flow can be measured in deep abdominal vessels using this technique [38, 39]. The technique is based on the Doppler effect which corresponds to an alteration in sound
wave frequency resulting from the motion of red blood cells. The velocity of red blood cells is given by: max 2 cos f c V f
θ
Δ ⋅ = × ⋅ (2.10)where f is the transmitted frequency, c is the sound speed and θ is the angle between the sound beam and the blood flow direction. The volume flow rate is calculated by:
Flow V A= ⋅ (2.11)
where V is the mean velocity and A is the cross-sectional area of the blood vessel determined from the ultrasonic image of the blood vessel. The penetration depth of ultrasound waves is a function of incident wave frequency. For example, 8 MHz probe provides penetration depth of 4 cm for ultrasound wave. Therefore, superficial structures are imaged at a higher frequency (8-18 MHz) while deeper structures are imaged at a lower frequency (1-7 MHz).
Shear stress and flow mediated dilatation (FMD) that describes the vasodilatory response of a vessel to blood flow elevations are measured using the ultrasound image of the vessel as following:
( )
% DF BL BL D D FMD D − = (2.12) 8 BL V SS Dμ
= × × (2.13)where DBL and DDF represent brachial artery diameters at baseline and post-deflation phases
respectively, SS represents shear stress, V is blood flow velocity and µ is blood viscosity. The technique provides flow changes measurement in deeper tissue layers. However, it is not sensitive to blood flow in small vessels such as capillaries and arterioles and it does not provide continuous measurement.
Laser Doppler
This is a non-invasive technique for measurement of red blood cells perfusion in tissue [40]. A percentage of light beam incident in tissue is scattered by moving red blood cells that results in a frequency shift of the light. The light which is backscattered by red blood cells, as well as by static tissue, is detected by a photodetector. The emitted and returned light are then compared to
extract the Doppler shift caused by moving red blood cells. The Doppler shift is proportional to the flux of red blood cells.
The technique provides a continuous recording at the region of interest. However, it is only able to measure flow changes at the surface level since the penetration depth of the laser beam is no greater than 500 μm [41].
Magnetic resonance imaging (MRI)
MRI is an extremely versatile technique that provides anatomical and functional information on a body region of interest. The technique has wide applications in quantitative assessment of blood flow and blood oxygenation [42, 43]. Oxygenated and deoxygenated hemoglobin are diamagnetic (negative magnetic susceptibility) and paramagnetic (positive magnetic susceptibility) respectively. Increase in blood flow is accompanied with an oxy-hemoglobin concentration increase and a deoxy-hemoglobin concentration decrease. Therefore, the magnetic susceptibility decreases resulting in MRI signal intensity enhance.
The technique provides high temporal and spatial resolution images. However, the large size and high cost of MRI systems restrict their clinical applicability in reactive hyperemia studies.
Positron emission tomography (PET)
PET is a nuclear medicine imaging technique which provides a map of metabolic process in the body that allows the study of biochemical changes in terms of time. The technique is used for assessment of blood flow in peripheral vascular disease. After intravenous bolus injection of 15 O-water (H215O) radioactive molecules, a dynamic PET scan is acquired. Time-activity curves in blood and tissue reflect different regional blood flow [44]. Compared to MRI, the technique provides poor spatial and temporal resolution while it is also costly.
Radionuclide plethysmography
Radionuclide plethysmography is a recently developed and validated method by Harel et al. in the nuclear department of Montreal Heart Institute [45, 46]. Radionuclide plethysmography uses gamma detector probes to detect radioactivity variation during repeated venous occlusions. The method uses technetium-99m (99mTc) labeled autologous red blood cells as radioactive tracers to measure the radioactivity variations. The 99mTc compound with red blood cells can be used to
map circulating blood in an organ such as the forearm. Measurements performed with this method were highly correlated with those performed with SGP. However, intra arterial injection of a radioactive tracer is needed.
Chapter 3: Methodologies
We designed two experiments to test our hypotheses. The first experiment (Experiment1) was designed to test the ability of NIRS to measure blood flow variations in the forearm during reactive hyperemia. The second experiment (Experiment2) was designed to characterize the contribution of endothelium in vascular tone regulation during reactive hyperemia. Instrumentation, protocol designs and setup as well as the method of blood flow calculation that are common to both experiments are described in sections 3.1 to 3.4. Analyses that are specific to each experiment are described in sections 3.5 and 3.6.
3.1 Instrumentation
Figure 3-1 shows the schematic of all instruments including a strain gauge plethysmograph system, an NIRS system, an occlusion system, an electrocardiograph, an A/D converter and a computer.
3.1.1 Oxygenation monitor (NIRO-200)
The Niro-200 is a tissue oxygenation monitor based on near infrared spectroscopy. It provides continuous, non-invasive and real-time measurement of tissue oxygenation with a sampling rate of 6 Hz. The device is useful in clinical studies such as metabolism and function of brain as well as the study of muscle tissue oxygenation. Niro-200 is a two-channel oxygenation monitor allowing simultaneous measurement at two sites. It provides six parameters:
- Changes of oxygenated hemoglobin (ΔO Hb2 ) - Changes of deoxygenated hemoglobin (ΔHHb) - Changes of total hemoglobin (ΔcHb)
2
( ) ( ) ( )
cHb t HHB t O Hb t
Δ = Δ + Δ (3.1) - Ratio of oxygenated to total hemoglobin in percentage (TOI)
2 ( ) ( ) 100 ( ) O Hb t TOI t cHb t = × (3.2) - Relative value of total hemoglobin (THI)
( ) ( )
THI t = ×k cHb t (3.3)
k: a constant that is determined by the light scattering property in the measured tissue
- Normalized THI by the initial value (nTHI) ( ) ( ) (0) THI t nTHI t THI = (3.4)
The light source is a pulsed laser diode with a pulse duration of approximately 200 ns and a frequency of 2.7 kHz. The detection probe is a photodiode. Optical fiber bundles transfer the light produced by the light source to the emission probe and a multiwired shielded cable carries back the detected light to the device for analysis.
Measurement principle
The modified Beer Lambert law is used for the measurement ofΔO Hb2 , ΔHHbandΔcHb. The light attenuation variations at three wavelengths (775, 810, 850 nm) are calculated for
measurement of three unknown parameters:ΔO Hb2 , ΔHHb and pathlength (L). In fact the calculation of the three parameters is based on light attenuation in terms of time.
( )
( )
( )
( )
( )
( )
1 2 2 2 3 2 ( ) [ 1,1 2,1 ] ( ) [ 1, 2 2, 2 ] ( ) [ 1,3 2,3 ] A L a O Hb a HHb A L a O Hb a HHb A L a O Hb a HHb λ λ λ Δ = × × Δ + × Δ Δ = × × Δ + × Δ Δ = × × Δ + × Δ (3.5)where ( , )a i j represents molar extinction coefficient of HHb and O2Hb (i=1, 2) at wavelengths (λ1, λ2 and λ3). If the pathlength is known in the above equations, ΔO Hb2 andΔHHb are calculated as absolute concentration changes (Δμmol). It seems to be established that if physical distance between emitter and detector (d) is more that 3 cm, the pathlength is proportional to the distance by a constant called differential pathlength factor (DPF).
L DPF d= × (3.6)
The NIRO-200 operation manual provides typical DPF values for different parts of the body such as the forehead, the forearm and the calf in males and females. Since the value of physical distance (d), between detector and emitter for Niro-200 is 4 cm, it is possible to estimate the pathlength and input it into the device setting function.
(
)
3.59 4 14.36L forearm = × cm= cm
TOI and THI are measured using spatially resolved spectroscopy method. In this method, light attenuation is measured along distance
(
∂ ∂A ρ)
. The Niro-200 employs a two segment photodiode chip to measure light attenuation along the distance between the two segments (Figure 3-2).Figure 3-2: Niro-200 emission and two-segment detection probe.
The value of ∂ ∂A ρ is calculated at three wavelengths by an equation derived from the photon diffusion principle.
( )
( )
( )
( )
( )
( )
2 2 2 ( 1) 2 { 1,1 1, 2 } ( 2) 2 { 1, 2 2, 2 } ( 3) 2 { 1,3 3, 2 } A k a O Hb a HHb d A k a O Hb a HHb d A k a O Hb a HHb d λ ρ λ ρ λ ρ ∂ = ⋅ × + × + ∂ ∂ = ⋅ × + × + ∂ ∂ = ⋅ × + × + ∂ (3.7)where k is the unknown parameter determined by light scattering properties.
Light pathlength
Adequate infrared light penetration into tissue is an important issue. The depth of light penetration depends on optical tissue properties as well as source-detector separation. The muscle layer lies generally under the skin and adipose tissue (upper layer). The thickness of the upper layer is in the order of a few millimeters.
It has been established that signal from short source-detector separation (0.5-1 cm) are derived mainly from upper layers whereas signals detected from detector separated more than 2 cm from the source are mostly due to the muscle layer [36]. However, there is always a contribution from the upper layers to the detected signal. The distance between the Niro-200 emission and
detection probes (4 cm) seems to be sufficient to make the infrared light travels deep enough in the tissue to remove the contamination from the superficial layer.
3.1.2 Strain gauge plethysmograph
A venous occlusion plethysmograph system consists of the following parts: - Limb strain gauge
- Plethysmograph - Rapid cuff inflator - Cuff inflator air source - Pressure cuffs
In our experiments, strain gauge plethysmography was performed using a dual-channel plethysmograph (Hokanson EC-4, D.E. Hokanson Inc). The plethysmograph is able to detect very small changes in limb volume, providing precise monitoring of forearm blood volume variations. On the other hand, its sensitivity makes the signals vulnerable to artifacts. The analog output of the plethysmograph is transferred to a PC via an analog to digital (A/D) converter.
Different forearm gauge sizes from 16 to 32 cm are available to accommodate the patient’s forearm size. The gauges are placed on the forearm 5 cm below the elbow. They have double rubber loops, filled with mercury that wrap in parallel around the limb. As the volume of the limb changes, the gauge tube is stretched and the electrical resistance varies proportionally to the volume size. Resistive variations are processed and displayed as waveforms expressed in mL·dL
-1·min-1
The Hokanson E20 rapid cuff inflation system was used to inflate the pressure cuffs, used for venous and arterial occlusions. It can inflate and deflate the vascular cuff in less than 0.3 seconds over a range of 0 to 300 mmHg as well as maintaining the pressure for as long as the protocol requires. The E20 digital readout displays cuff pressures within 1 mmHg over a range of 0 to 300 mmHg. The E20 requires a source of pressurized air provided by the Hokanson AG101.
3.1.3 Electrocardiograph (AccuSync)
A 3 lead ECG trigger monitor (AccuSync 7, Medical Research Corporation, Milford) displays the ECG of the patient and automatically detects the R waves. The ECG signal and R triggers are recorded on the computer for further analysis of a patient’s cardiac rhythm variation during the experience.
3.1.4 Analog to digital converter (ADC) and RS232
The SGP and ECG signals are transferred to the computer via an A/D device (Dataq, model DI-148U, DATAQ Instruments, Inc., Akron, Ohio) at 250 Hz. The 8 channel ADC power is derived from the PC through the USB interface. The voltage resolution of the converter is ±19.5 mV (10 bits) with a full scale measurement range of -10 to +10 volts. The maximum sampling frequency of the ADC is 14,400 Hz. In addition, the NIRS signal is transferred to the computer via an RS232 port.
3.2 Protocol design
In both experiments, the protocol included three consecutive stages (Figure 3-3). - Baseline or pre-ischemic period (3 min),
- Ischemic period (5 min),
Figure 3-3: Study protocol timeline (SP represents systolic pressure).
The blood flow measurements were made by successive cycles of venous occlusion and release during the experiment. At the baseline, flow measurements were performed with 20 seconds occlusion-deflation cycles (10 sec occlusion time followed by a 10 sec deflation time). The pressure was applied through a pressure cuff (venous cuff) connected to the pneumatic cuff inflator. Nine measurements were obtained during 3 minutes of pre-ischemic period.
After this period, a suprasystolic pressure was applied through another cuff (arterial cuff), on the left arm for 5 minutes to halt forearm blood circulation. During the ischemia period, 15 flow measurements were obtained. After 5 minutes of ischemia, arterial cuff was released to evoke hyperemic response on the left forearm. Successive cycles of venous cuff occlusion-deflation were decreased to 10 seconds for the first 2 minutes post-ischemic to obtain a higher temporal resolution. During the post ischemic period, 27 inflation-deflation cycles were performed resulting in 27 flow measurements.
3.3 Experiments setup
The experiment was carried out in a quiet room with a temperature of 24º C. Patients sat in supine position on a recliner chair with arms prone and above heart level in order to facilitate the venous outflow. Venous cuffs were placed around distal parts of left and right upper arms to
perform repetitive venous occlusions. Both cuffs were connected to a pneumatic cuff inflator set to 50 mmHg. This cuff pressure is sufficient to occlude completely the venous outflow without affecting arterial inflow [47].
Figure 3-4: Cuffs position on patient arms during the experiment.
The Arterial cuff was placed on the proximal part of the left upper arm (Figure 3-4). The cuff was inflated to a pressure of 50 mmHg above systolic pressure. The duration of arterial occlusion is an important issue for inducing maximum endothelial cells stimulation and as a result, vessel dilatation. It has been shown that maximum arterial response is reached after 4.5 min of occlusion [26]. Occlusion cuff position is also an important determinant of the magnitude of brachial artery flow-mediated dilatation. It seems to be established that upper arm cuff placement yields greater hyperemic response compared to wrist cuff placement [48, 49]. Therefore, upper arm occlusion is more suitable for detection of subtle differences between groups of patients.
Strain gauges were placed around the largest part of the left and right forearms (about 5 cm below the elbow crease) and were connected to the plethysmograph. NIRS sensors were placed on the anterior parts of the left and right forearms adjacent to the strain gauge in a longitudinal
orientation and at approximately the same distance from elbows. They have auto-adhesive surface to hold firmly on the forearm skin and preventing any displacement (Figure 3-5).
The electrocardiogram (ECG) was recorded using 3 leads throughout the experiment to detect any cardiac cycle variations during different phases of the experience.
Figure 3-5: NIRS probe and strain gauge positions.
All signals including blood volume variations in mL/100mL/min by SGP, total hemoglobin variations in μmol/L by NIRS and electrocardiograph with time based control codes were recorded on a personal computer by a custom acquisition program designed with the MATLAB®® programming language (Figure 3-6). For an online signal quality monitoring, the signals were plotted in real time throughout the experiment.
Figure 3-6: Acquisition interface.
3.4 Blood flow measurement
The increase in blood volume generated by the application of repeated venous occlusions, allows the computation of the arterial inflow. It is defined as:
( )
d Volume flow
dt
= (3.8)
The arterial inflow was calculated for each venous occlusion by computing the upslope value on the ascending part of blood volume variations. Repetitive venous cuff inflation and deflation caused slight movements of forearms all throughout the experience. These movements affect SGP signal through sharp rises at the onset of cuff inflation (cuff jump). In order to avoid blood flow overestimation, we excluded the first 2 sec of SGP signal from upslope calculation. We applied a linear regression model on the next 3 seconds period of the signal to calculate the rate of blood volume increase at the onset of each venous occlusion (Figure 3-7). Although the NIRSP signal was almost unaffected by the mentioned artifact, we considered the same period of time as SGP for the flow measurement.
Figure 3-7: Linear regression application for calculation of arterial inflow with NIRS.
The SGP measures blood relative volume variations in limbs (in mL of blood/100mL of tissue). The application of linear regression provides the rate of relative blood volume variations thus the arterial inflow in mL·100mL-1·min -1.
By NIRSP, we are able to indirectly measure arterial inflow. The NIRS device provides total hemoglobin variations in μmol/L, which is proportional to blood volume variations. Upslopes were calculated using a linear regression model. Therefore, we obtained arterial inflows in μmol/L/min. In order to provide arterial inflow measurements in the same units as SGP (mL/100mL/min), we applied a calibration factor on the flow measures by NIRSP. A linear regression between blood flow measurements during reactive hyperemia, by SGP in mL/100mL/min and NIRS in μmol/L/min was performed. The Slopes of the regression fit was used as the calibration factor.
3.5 Experiment1 3.5.1 Subjects
After the protocol approval by the research and ethics committees of the Montreal Heart Institute, 13 healthy volunteers with a low likelihood of coronary artery disease (CAD) were recruited for the experiment (Table 3-1) [50].
![Figure 2-2: Vascular remodeling agents: signals, sensors and mediators [2].](https://thumb-eu.123doks.com/thumbv2/123doknet/2174477.10220/15.918.240.732.292.637/figure-vascular-remodeling-agents-signals-sensors-and-mediators.webp)
![Figure 2-3: The pathway of endothelial derived relaxing factor release [12-14].](https://thumb-eu.123doks.com/thumbv2/123doknet/2174477.10220/17.918.228.744.117.575/figure-pathway-endothelial-derived-relaxing-factor-release.webp)
![Table 2-2: Endothelial responses to relatively high and low hemodynamic shear stress [23]](https://thumb-eu.123doks.com/thumbv2/123doknet/2174477.10220/22.918.163.809.408.953/table-endothelial-responses-relatively-high-hemodynamic-shear-stress.webp)
![Figure 2-10: The instrument design of a modular NIRS system by Wariar et al. BPF represents band-pass filter [37]](https://thumb-eu.123doks.com/thumbv2/123doknet/2174477.10220/33.918.178.789.133.468/figure-instrument-design-modular-nirs-wariar-represents-filter.webp)