Evaluating depth perception of 3D stereoscopic videos
Texte intégral
Figure
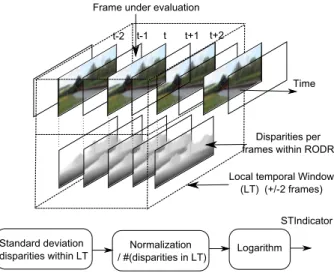
![Figure 3: Depth contrast perception in function of the visualization distance. Results from [6]](https://thumb-eu.123doks.com/thumbv2/123doknet/11497351.293408/5.918.113.451.771.975/figure-depth-contrast-perception-function-visualization-distance-results.webp)
Documents relatifs
The other transfer modes (Block, Compressed) do not close the connection to indicate the end of file. They have enough FTP encoding that the data connection can
that abstract results in C ∗ -algebra theory can be applied to compute spectra of important operators in mathematical physics like almost Mathieu operators or periodic magnetic
Dad hasn’t moved the lawn (tondre la pelouse ) Andrew has taken the dog out for a walk?. Maria has finished cleaning
La thèse a été menée dans deux villages d’éleveurs mbororo (Laïndé Ngobara, Ndiam Baba) situés à proximité de Garoua. Quatre niveaux d’analyse sont pris en compte :
Our main objectives are: (1) to evaluate the performance of existing 3D mesh quality metrics in the terms of correlation with the human vision on perceiving local distortions; (2)
With these strengths, helicity has become widely applied to topics as diverse as magnetohydrodynamic ( MHD ) turbulence, magnetic dynamos, magnetic reconnection, turbulent relaxation
To address this challenge, the Fifty-first and the Fifty-fourth Sessions of the Regional Committee for the Eastern Mediterranean adopted – in October 2004 and 2007, respectively
Last year, a state legislator in North Carolina and anti-fracking campaigner inadvertently made the practice legal by pressing the wrong button while voting at the end of
