HAL Id: hal-02615317
https://hal.archives-ouvertes.fr/hal-02615317
Submitted on 22 May 2020
HAL is a multi-disciplinary open access
archive for the deposit and dissemination of
sci-entific research documents, whether they are
pub-lished or not. The documents may come from
teaching and research institutions in France or
abroad, or from public or private research centers.
L’archive ouverte pluridisciplinaire HAL, est
destinée au dépôt et à la diffusion de documents
scientifiques de niveau recherche, publiés ou non,
émanant des établissements d’enseignement et de
recherche français ou étrangers, des laboratoires
publics ou privés.
Millimeter-Wave Propagation Measurements at 60 GHz
in Indoor Environments
Marwan El Hajj, Gheorghe Zaharia, Ghais El Zein, Hanna Farhat, Sawsan
Sadek
To cite this version:
Marwan El Hajj, Gheorghe Zaharia, Ghais El Zein, Hanna Farhat, Sawsan Sadek. Millimeter-Wave
Propagation Measurements at 60 GHz in Indoor Environments. 2019 International Symposium on
Sig-nals, Circuits and Systems (ISSCS), Jul 2019, Iasi, Romania. pp.1-4, �10.1109/ISSCS.2019.8801751�.
�hal-02615317�
Millimeter-Wave Propagation Measurements at 60
GHz in Indoor Environments
Marwan El Hajj
1, Gheorghe Zaharia
1, Ghais El Zein
1, Hanna Farhat
2, Sawsan Sadek
21 INSA Rennes, CNRS, IETR, UMR 6164, F 35000, Rennes, France 2 Lebanese University, Faculty of Technology, Saida, Lebanon
Marwan.el-hajj@insa-rennes.fr
Abstract—This paper presents the results obtained from 60 GHz
propagation measurement campaigns in indoor environments. These measurements are performed in the frequency domain and are based on the use of a vector network analyzer (VNA). The analysis of the results makes it possible to characterize the propagation channel. In first measurement campaign, we show the influence of different types of antennas on the path loss characteristics in a hallway, while in the second campaign results highlight the effect of the type of antenna of the access point (AP) and its position on the angular impulse response of the channel inside a meeting room. All of these results are intended to lead to rules for the deployment of wireless high-speed local and personal area networks (WLANs/WPANs).
I. INTRODUCTION
Recently, a huge research activity is focused on the definition and designs of future communication systems envisioned for next generation cellular networks (5G) [1] and wireless local and personal area networks (WLAN/WPAN) [2]. These systems must simultaneously meet several requirements in terms of throughput, quality of service and energy saving. The usage of millimeter bands is considered essential and has proven to be an attractive solution for transmitting high data rates (Gbit/s) for short-distance applications for instance indoor environments. In this context, the 60 GHz band became a promising subject in the future for wireless broadband communication systems. At this stage, it is necessary to study the propagation at 60 GHz to obtain more knowledge about the channel characteristics at this frequency band. The propagation depends on several factors: frequency, environment, position and type of antennas used. Some studies were performed at 60 GHz in indoor static environment such as typical residential environment [3], and others executed in conference rooms [4].
However, millimeter waves are extremely vulnerable to propagation loss and to different obstacles such as human blockage, furniture and walls. The attenuation due to human body blockage was observed at level of about 25 - 30 dB [4] [5], but it depends on the antenna’s height [6] and the person’s position. Also, the effects of different antenna types should be considered at mm-wave bands. For narrow beam width and high antenna gain, the human body can adequately degrade the signal power by dramatically shadowing the main paths between transmitter and receiver [7] [8].
Therefore, it is a big challenge to maintain the stability of the communication in case of blocking the direct path due to
moving objects or human bodies. However, at higher elevations of AP, the received signal power had shown less variation for stationary users. According to previous study [9], the path gain can be improved approximately from 10 dB to 15 dB by expanding the elevation angle of incidence for near body user equipment’s.
The present study is a part of the FUI OptimiSME project, which aims to optimize the deployment of multi-band radio networks for small businesses. In this work, we studied the propagation with measurements in two environments. The first measurement campaign is carried out, in a hallway to evaluate the influence of different types of antennas on the path loss characteristics. The second campaign takes place in a meeting room and focuses on the spatial and temporal response of the channel. In this case, the objective is to highlight the effect of the type of antenna of the AP and its position (omnidirectional placed in the center of the table or directional raised in corner of the room).
The paper is organized as follows: Section II describes the channel sounding equipment and the measurement environment scenarios. Section III presents the measurement results and discussions. Finally, Section IV sums up conclusions.
II. MEASUREMENT SET-UP AND SCENARIOS
A. Measurement Set-Up
The measurement system includes a vector network analyzer (VNA) operating at center frequency of 3.5 GHz with 2 GHz bandwidth over 401 sub-carriers sequentially with 5 MHz frequency spacing. The transposition to 60 GHz is provided by radio frequency modules (up and down converters) using standard components such as multipliers and mixers. Two types of antennas were used as access points (Tx1 and Tx2). Tx1 is an omnidirectional antenna (SAGE Millimeter 5836230230-15-S1) in the azimuth plane, with HPBW of 30° in elevation plane and 2 dBi gain according to the antenna datasheet. Tx2 horn antenna has a 100° at 6 dB beam width in both E and H planes (Orange Labs conception) with 7.3 dBi gain. Both are vertically polarized and operating between 58 and 62 GHz. At the receiver (Rx), a 22.5 dBi gain horn antenna (QUINSTAR TECHNOLOGY QWH-1500 -AA) was used with 10° and 13° HPBW in E and H plane are respectively with 22.5 dBi gain. Before starting measurements, a calibration full two ports was made to remove the losses of the cables, and a back to back test, to remove the influence of the up/down converters from the
frequency response channel. The transmitted power at 60 GHz was 0 dBm.
B. Measurement Scenarios
1) Hallway Scenario: The receiver Rx is fixed in front of the door of the hallway (14 x 2 x 3m) in IETR laboratory (Fig 1). The transmitter Tx is placed in 12 positions located on the axis of the hallway for a maximum distance of 14 m. Both Rx and Tx were placed at same height of 1.3 m.
Figure 1. Measurement environment (hallway).
In order to analyze the effect of the type of antenna on the power loss parameters, we measured the power loss for three different types of antennas.
To evaluate the power loss according to the distance between the antennas, we used the following model:
PL (d) [dB] = PL (d0) [dB] + 10 n log10 (d/d0) + Xσ [dB] (1)
where PL(d0) is the path loss at reference distance d0 = 1 m
from Tx, n is the path loss exponent and Xσ is a normal variable
with zero mean and standard deviation σ that represents the range of deviation of the measured values from the predicted mean.
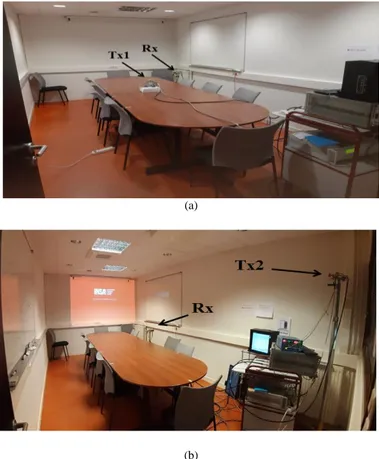
2) Meeting Room Scenario: Channel characterization also focused on its angular impulse response in a meeting room. All the measurements in this section have been carried out in a typical meeting room (6.58 x 3.18 x 2.48 m) in IETR laboratory (Fig. 2). In this case, the objective is to highlight the effect of the type and the position of AP Tx antenna on the spatial and temporal response of the channel. Therefore, two configurations where considered. First, the Tx1 omnidirectional Antenna was placed at 1 m height in the center of the table (Fig. 2a). Then, the Tx2 horn antenna was raised at 1.9 m height in a corner of the room (Fig. 2b).
The receiver antenna is a horn with 13° narrow beam width set at 1 m height. The goal is to perform rotations by 6° azimuth steps on the receiver side using a positioner and to collect the channel frequency response for each 6° step using a PC that commands the VNA and the controller with a LabVIEW program. In both configurations, the transmitter antenna was connected to the VNA through an 8 m coaxial cable while the receiver is connected via a 2 m cable.
(a)
(b)
Figure 2. Measurement campaign in meeting room (a) with Tx1, (b) with Tx2.
On the received side, 10 positions were chosen around the table instead of every chair (Figs. 3 and 4). When using Tx2, its central axis was pointed towards the main diagonal of the room (dashed line) without tilt, as shown in Fig. 4.
Figure 3. Meeting room plane with Tx1 in center.
All measurements have been made in an empty environment (no people), with typical furniture (table, chairs, two metallic boards) and closed wooden door.
Figure 4. Meeting room plane with Tx2 in the corner.
III. MEASUREMENT RESULTS AND DISCUSSIONS
A. Path Loss Results
The results in Table I show the parameters of the path loss model for all three cases, without considering the gain of the antennas. The parameters of the derived path loss models are determined through linear regression analysis. The exponent n is less than 2 (free space case), which indicates the presence of a guided wave effect in the three cases due to constructive multipath. We had noticed a decrease of n till 1.64 when using a large antennas aperture (Omni – Horn 100°) which increases slightly the guided wave effect due to the multipath reflections in the hallway. This observation is consistent with the results of previous studies [9] [10], while σ decreases when the antenna aperture is narrower. This remark indicates that the path loss model has more accuracy using a narrower aperture antenna. In fact, a very close variation of σ between (Horn 13° – Horn 100°)
and (Omni 360° – Horn 13°) is noted, due to the limited beam width. ρ represents high correlation coefficient between the measurements and the model in the three cases.
TABLE I. PATH LOSS PARAMETERS MODEL
Rx Antenna Tx Antenna PL(d0) (dB) n σ (dB) ρ Horn 13° Horn 100° 70 1.80 0.49 0.99 Omni 360° Horn 13° 67.36 1.72 0.44 0.99 Omni 360° Horn 100° 69.28 1.64 1.05 0.97
B. Meeting Room Results
When analyzing all Rx positions (Figs. 3 and 4), we observed the presence of a significant path in the direction of the access point with multiple reflections depending on the position and the receiver rotation angles. Several remarkable reflections were detected, caused by the metallic boards such as Rx7 and Rx2, and others from surrounding walls such as Rx10. For Tx1 scenario (Fig. 3), the main path detected for each Rx position is collinear with the line of sight (LOS) with Tx1. This configuration is favorable to maintain a stable communication. Only some personal items (e.g., books, mugs, bag ...) can partially affect the signal. For Tx2 scenario (Fig. 4), the LOS can be blocked with human people, especially for the nearest positions to the AP (Rx5 and Rx6). We noticed also for Rx4
that the reflection from metallic board is more significant than that from the nearest wall.
Fig. 5 represents the received power at Rx10 according to the angle of rotation without considering the gain of Tx and Rx antennas for 0 dBm transmitted power. Figs. 5 (a) and 5(b) show a strong path when Rx10 is oriented through Tx1 or Tx2, and two significant reflections at 36° and 264° (Fig. 5.a) and at 294° and 138° (Fig. 5.b). As example we plotted the channel impulse responses for Rx10 (Tx2 transmitter) using IFFT function on MATLAB.
(a) (b)
Figure 5. Received power function of angle of rotation for Rx10 with Tx1 in (a) and Tx2 in (b).
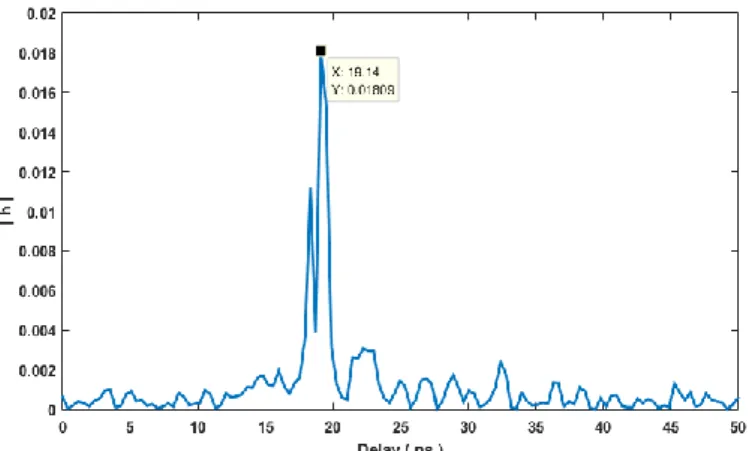
Fig. 6 represents the impulse response when Rx10 is aligned with Tx2. The detected main path arrives at 16.02 ns which correspond to a distance of 4.8 m.
Figure 6. Impulse response of Rx10 at angle 0° with Tx2 transmitter.
With simple geometry calculation using the image theory and the received power according to the angle of arrival at Rx10, a plot of the first reflection in Fig. 7 had manifested a distance equal to 5.78 m, which is the nearest to the theory 5.74 m. This calculation indicates that the first reflection performed attained additional 0.98 m compared to the main path 4.8 m (Fig. 6).
The second reflection (Fig. 8) corresponds to a distance equal to 8.20 m, and by theory to 8.27 m which is very close. The second reflection performed 3.40 m more than the direct path. These two reflections were plotted on the room plane on Fig. 4.
Figure 7. Impulse response of Rx10 at angle 294° with Tx2 transmitter.
Figure 8. Impulse response of Rx10 at angle 138° with Tx2 transmitter.
Table II summarizes the path loss values for the strongest paths. PL1 (dB) is the path loss when the receiver is oriented towards the AP. PL2 (dB) and PL3 (dB), correspond to the first and second reflected paths. We can notice that for Tx2 and the following receiver positions Rx4, Rx7, Rx8 and Rx 9, PL2 was less attenuated than PL1. This can be explained by the fact that during the measurements, the main lobe of the Tx2 radiation pattern was affected by the proximity of the VNA, which increases PL1. On the other hand, the metallic board creates only one specular reflection corresponding to a lower PL2.
TABLE II. PATH LOSS FUNCTION OF RX LOCATIONS
Tx1 Tx2 PL1(dB) PL2(dB) PL3(dB) PL1(dB) PL2(dB) PL3(dB) Rx1 72.63 89.08 92.09 90.94 94.34 95.58 Rx2 68.57 81.39 86.6 89.16 93.71 96.38 Rx3 64.43 87.91 91.28 89.09 91.61 101.3 Rx4 65.62 85.22 88.05 93.32 90.84 96.94 Rx5 68.81 81.14 85.78 89.20 91.82 101.7 Rx6 74.91 89.80 94.15 94.11 97.44 100 Rx7 70.81 85.77 89.94 92.34 87.54 100 Rx8 66.13 87.39 92.87 89.16 87.25 98.88 Rx9 64.94 87.62 93.35 89.33 87.51 97.61 Rx10 69.09 80.73 87.75 91.01 96.66 98.34 IV. CONCLUSION
In this paper, the radio propagation at 60 GHz has been investigated by measurements conducted in two indoor environments. In hallway, we analyzed the effects of using three different types of antennas on the power loss parameters. We showed that for antennas with large aperture, the guided waves effect is more significant than with narrower aperture antennas. The path loss model was more accurate using narrow aperture antennas. In meeting room, we studied the influence of two access points according to their locations and the type of antennas. Measurement results show that it is better to place the AP using an omnidirectional antenna in the center of the table than in the corner of the room. This position can also reduce the shadowing effect due to human obstructions. Moreover, the presence of some significant reflections can be exploited by beamforming when the direct path is obstructed. These results can be used to define practical rules for the deployment of the new wireless local and personal area networks.
ACKNOWLEDGMENT
This work is a part of the French project FUI22 OptimiSME, and the ARED CAMOPROM, and financially supported by Région Bretagne and Rennes Métropole.
REFERENCES
[1] T. S. Rappaport, G. R. MacCartney, S. Sun, H. Yan, S. Deng, Small-Scale, ‘‘Local Area, and Transitional Millimeter Wave Propagation for 5G Communications,’’ IEEE Trans. on Ant. and Prop, vol. 65, no. 12, pp. 6474 – 6490, 2017.
[2] P. Zhou, K. Cheng, X. Han, X. Fang, Y. Fang, R. He, Y. Long, Y. Liu “IEEE 802.11ay-Based mmWave WLANs: Design Challenges and Solutions,” IEEE Comm Surveys & Tutorials, vol. 20, no. 3, pp. 1654 – 1681, 2018.
[3] M. Kacou, V. Guillet, G. El Zein, G. Zaharia, “Coverage and Throughput Analysis at 60 GHz for Indoor WLAN with Indirect Paths,” 29th IEEE International Symposium on Personal, Indoor and Mobile Radio Communications (PIMRC 2018), Bologne, Italy, Sep 2018.
[4] S. Collonge, G. Zaharia, G. El Zein, “Influence of the Human Activity on Wide-band Characteristics of the 60 GHz Indoor Radio Channel,” IEEE Transactions on Wireless Communications, vol. 3, no. 6, pp. 2396-2406, Nov, 2004.
[5] V. Semkin, A. Karttunen, J. Jarvelainen, S. Andrreev, Y.Koucherayavy, “Static and Dynamic Millimeter-Wave Channel Measurements at 60 GHz in a Conference Room,” in 12th European Conf. on antennas and
Propagation (EUCAP), London, United Kingdom, April, 2018.
[6] L. Zhang, A. McKernan, S. L. Cotton, and W. G. Scanlon, “The Influence Of Elevation Angle on 60 GHz Near-Body Path Gain,” in 12th
European Conf. on antennas and Propagation (EUCAP), London, United Kingdom, April, 2018.
[7] C. Gustafon and F. Tufvesson, “Characterization of 60 GHz shadowing by human bodies and simple phantoms,” in 6th European Conf. on
antennas and Propagation (EUCAP), 2012, pp. 473-477.
[8] M. Fakharzadeh, J. Ahmadi-Shokouh, B. Biglarbegian, M. Nezhad-Ahmadi, and S. Safavi-Naeini, “The effect of human body on indoor radio wave propagation at 57-64 GHz,” in IEEE Intl.Symp. on Antennas and Propagation (APSURSI), 2009, pp. 1-4.
[9] P. F. M. Smulders, “Statistical Characterization of 60 GHz indoor radio channels,” , IEEE Trans. on Ant. and Prop, vol. 57, no. 10, pp. 2820 – 2829, October 2009.
[10] S. Geng, J. Kivinen, X. Zhao, and P. Vainikainen, “Millimeter-Wave Propagation Channel Characterization for Short-Range Wireless Communications,” IEEE Trans. On vehicular technologiy, vol 58, no. 1, pp. 3-13, January 2009.