Science Arts & Métiers (SAM)
is an open access repository that collects the work of Arts et Métiers Institute of
Technology researchers and makes it freely available over the web where possible.
This is an author-deposited version published in:
https://sam.ensam.eu
Handle ID: .
http://hdl.handle.net/10985/11660
To cite this version :
Yuchen ZHAO, L LE JONCOUR, Andrzej BACZMANSKI, E GADALISKA, Sebastian WRONSKI,
B PANICAUD, M FRANÇOIS, Chedly BRAHAM, T BUSLAPS - Stress distribution correlated with
damage in duplex stainless steel studied by synchrotron diffraction during plastic necking
-Materials & Design - Vol. 113, p.157–168 - 2017
Any correspondence concerning this service should be sent to the repository
Stress distribution correlated with damage in duplex stainless steel
studied by synchrotron diffraction during plastic necking
Y. Zhao
a,⁎
, L. Le Joncour
a, A. Baczma
ński
b, E. Gadali
ńska
c, S. Wro
ński
b, B. Panicaud
a, M. François
a,
C. Braham
d, T. Buslaps
ea
ICD-LASMIS, Université de Technologie de Troyes (UTT), UMR CNRS 6281, 12 rue Marie Curie, CS 42060, 10004 Troyes, France bAGH- University of Science and Technology, Faculty of Physics and Applied Computer Science, al. Mickiewicza 30, 30-059 Krakow, Poland cInstitute of Aviation, Materials and Structures Research Center, al. Krakowska 110/114, 02-256 Warszawa, Poland
d
PIMM, Arts et Métiers ParisTech (ENSAM), 151 Bd de l'Hôpital, 75013 Paris, France e
ESRF, 6, rue J. Horowitz, 38500 Grenoble Cedex, France
H I G H L I G H T S
• Relaxation of stress in ferrite indicates damage initiation in this phase for a large deformation of duplex steel. • The stress relaxation in ferrite depends
on the grain orientation and position in the neck.
• Heterogeneous lattice strains and three-axial heterogeneous stresses are pres-ent in the necking zone.
• The softening/damage process in ferrite depends on the value of equivalent von Mises stress. G R A P H I C A L A B S T R A C T
a b s t r a c t
a r t i c l e i n f o
Article history: Received 15 January 2016Received in revised form 23 September 2016 Accepted 7 October 2016
Available online 10 October 2016
The goal of this work was the determination of lattice strains distribution in two phases of duplex steel during plastic necking. Subsequently, the stress heterogeneity in the neck was studied in order to determine the reason for the damage initiation and to verify the hypothesis that the damage begins in the ferritic phase. To do this, X-ray synchrotron radiation was used to scan the‘in situ’ variation of the interplanar spacings along the necking zone for samples subjected to tensile loading. A self-consistent model and FEM simulation were applied for the experimental data interpretation.
It was found that for advanced necking the phase lattice strains, especially those measured at some distance from the neck centre, show a large inversion of the loads localised in both phases compared to the undamaged state (the lattice strains in the ferrite become smaller than in the austenite). This effect indicates stress relaxation in the ferrite which is connected with the damage phenomenon. Correlation of the experimental results with the modelling shows that the value of von Mises stress is responsible for the initiation of the ferritic phase softening. Keywords: Elastoplastic deformation Necking Damage Polycrystalline material Self-consistent model Synchrotron diffraction 1. Introduction
Duplex stainless steel was discovered by Hochmann[1] during
intergranular corrosion tests. This type of steel combines an excellent
⁎ Corresponding author.
resistance to corrosion with high mechanical strength due to the high content of chromium and nitrogen. The duplex steel studied in this work consists of ferrite (α phase) having a bcc crystal structure and aus-tenite (γ phase) exhibiting an fcc structure. Both phases possess good corrosion resistance. While the ferritic phase increases the value of yield stress, the austenitic phase improves the ductile response of the material.
Several studies of cast duplex stainless steel used in the cooling sys-tem of a nuclear power plant have been published[2,3]. This steel is sub-jected to a slow thermal ageing at a working temperature of 320 °C, which causes an embrittlement of the ferritic phase[4,5]. It is well-known that at temperatures below 475 °C, the spinodal decomposition of ferrite occurs[6–8].
During the deformation of duplex steel, the plastic strains are ho-mogenous in the austenitic and more localised in the ferritic phase, where fewer slips, but with a higher magnitude, are observed[2,9– 11]. SEM measurements performed for cyclic loadings show that the slip systems in the austenitic phase are activatedfirst i.e. before the glides in the ferrite[11]. In the case of the aged duplex steel, Bugat et al.[2]observed the slip lines in the ferrite to be tortuous (following the {112}〈111〉 slip system and twinning along the same slip systems). Due to the above-mentioned mechanisms, the damage process in aged duplex stainless steel is initiated mainly in ferrite, where cleavage micro cracks perpendicular to the loading direction have been shown in previous works[2,3,10]. The damage appears mainly in the regions where the strain incompatibles are high (double or triple grain bound-aries in the austenite) and/or in the intersection of the strain modes (slipping and twinning in the ferrite). The nucleation of cleavage cracks is a continuous and stable phenomenon that accelerates with the strain. The study of damage in polycrystalline materials is usually based on a direct observation of the cracks' initiation and evolution using electron microscopy[12–14]or X-ray tomography[14]. Using electron micros-copy (EBSD, TEM and SEM techniques) the initiation of cracks due to a cyclic loading of duplex steel was seen in the ferritic phase[12,14]. Re-cently, the effect of significant lattice strain release in damaged ferrite grains was confirmed by Istomin et al.[13]using X-ray synchrotron diffraction.
To observe the mechanical behaviour inside both phases during the damage process, diffraction measurements combined with an in situ tensile test were performed[15–25]. The main advantage of the diffrac-tion methods is that the measurements are performed selectively only for the crystallites contributing to the measured diffraction peak. When several phases are present in the sample, measurements of a sep-arate diffraction peak allows for investigating the behaviour of each phase independently[15–25]. A comparison of the diffraction data with micromechanical models is very convenient for the study of elastoplastic properties at micro and macro scales. Both selectivity and scale considerations determine the use of diffraction technique in the present study. An analysis of the experimental data using model predic-tions enables understanding of the physical phenomena which occur during a sample's deformation. Moreover, the micro and macro param-eters of the elastoplastic deformation can be experimentally identified. The damage processes initiated on slip planes or particular crystallo-graphic planes, as suggested in many works[3,26–29], may be respon-sible for the relaxation of the grain stresses, depending on the orientation of the crystallographic lattice. This effect was also observed by measuring lattice strains in both phases of duplex steel using the neutron diffraction method[17,20].
In this work, the effect of stress partition between phases inside and outside the necking area in plastically deformed duplex steel is studied for thefirst time using synchrotron radiation. An interpretation of the results was performed with help of the Finite Element Method (FEM) and elastoplastic self-consistent modelling. The FEM simulation was ap-plied to determine the influence of the neck shape on the stress distri-bution, while the self-consistent model was used to predict elastoplastic deformation of the undamaged state of the material and
to show the difference between this state and the behaviour of the dam-aged material. In particular, a tendency of lattice strains evolution was studied and then compared with the experimental results obtained for the deformation neck.
The present work is a continuation of our previous investigation[17, 20]in which the damage process occurring in the neck was studied using neutron diffraction. Previously, the measurements of lattice strains were performed for both phases and compared with a self-con-sistent model accounting for the damage process. It was found that re-laxation of stresses in the ferritic phase and the load transfer to the austenite occurred in the deformation neck. The observed phenomenon was explained by a model, but due to relatively large gauge volume the stress/strain heterogeneity was not studied. In the previous study[29]
the preliminary results of synchrotron measurements before the sample fracture under the applied load were also presented, but the strains het-erogeneity in the neck was not investigated.
The present experiment was performed using synchrotron diffrac-tion during a tensile test for which the sample strain was controlled. Due to a small gauge volume enabling high spatial resolution of the measurements, the lattice strains were scanned along the deformation neck created during the tensile test. The main goal of this work was to observe the stress partitioning between the phases at various positions in the necking zone. As a result, the relaxation of the stress in the ferritic phase was studied and the heterogeneity of the damage within the de-formation neck was described.
2. Experimental
2.1. Material characterisation
The present study examined an austenitic-ferritic duplex stainless steel UR45N, which was previously investigated in[17,29]. The micro-structure of the studied material is constituted of a ferritic phase and austenitic phase in approximately equal volume proportions (50% aus-tenite and 50% ferrite). EBSD maps show the elongated grains of the austenite (γ phase) evenly embedded in the ferritic (α phase) matrix
(see[17,29]). The grains of the austenite are divided into smaller
crys-tallites with different orientations, while the grains of the ferrite possess nearly the same crystal orientation resulting from the rolling process
[29]. The Orientation Distribution Function (ODF, shown in[30]) of each phase was determined from the experimental polefigures {110}, {200}, {211} and {111}, {200}, {220} measured respectively for the fer-rite and the austenite, using Cr radiation on a Seifert four circles diffrac-tometer[29].
2.2. Measurement configuration and treatment of the 2D diffraction patterns
The tensile tests combined with in-situ X-ray synchrotron diffraction measurements were performed in a transmission mode on the beamline ID15B at ERSF (Grenoble, France), using a monochromatic X-ray radiation with the wavelengthλ = 0.14256 Å, which was deter-mined from a preliminary calibration performed on the CeO2reference
powder[29]. The configuration of the experimental setup is shown in
Fig. 1a. The diffraction pattern, recorded by a Thales 2D Pixium 4700
CCD detector[31],is presented inFig. 1b. A Pico1 detector was placed in front of the outgoing beam in order to measure the intensity of the beam passing straight through the sample (Fig. 1a). The measurements were performed using a beam size of 100μm × 100 μm for ‘dog-bone’ shape samples having a cross section of 1.5 mm × 1.5 mm in the region studied by diffraction. The samples were named respectively‘sample TD’ and ‘sample ND’. Sample TD was manufactured so that the trans-verse direction (TD) was perpendicular to the sample surface, which means that the incident X-ray beam was parallel to the TD direction during the tensile test[29]. Sample ND was machined with the normal direction (ND) perpendicular to its surface, allowing measurement with
the incident X-ray beam parallel to the ND. The load was applied along the RD for both samples (Fig. 1a).
The recorded images were handled using diffraction patterns treat-ment by FIT2D[32]and Multifit[33]software. FIT2D was used to con-vert the received two-dimensional images into one-dimensional spectra (intensity vs. scattering angle 2θ), while the Multifit program was applied to determine the 2θ positions of the diffraction peaks by fitting with the pseudo-Voigt function[34](the examples are shown
inFig. 1c). Finally, the interplanar spacingbdN{hkl}was computed from
the peak positions using the Bragg's law.
To calculate the values of 2θ angle, a simple relation tan2θ ¼r lwas used, where r is the measured radius of diffraction ring acquired on the 2D detector and l is the distance between the sample and the detec-tor (Fig. 1a). The l distance was measured comparing the radiuses of the diffraction rings recorded at two different positions of the detector, which was shifted by a known distance. Such a preliminary measure-ment was done for each samplefixed in the loading rig, prior to the ten-sile test. During the experiment the detector and sample were kept in a fixed position i.e. l was equal to 899.1 mm and 901.0 for the ND and TD samples, respectively. It should be emphasised that the
above-Fig. 1. Experimental setup showing orientations of the samples during experiment (a), the image recorded on the 2D detector for the initial sample (b), and the integrated 1D diffraction peaksfitted by pseudo-Voigt function (c).
mentioned methodology is not dedicated to determining the absolute values of the interplanar spacings or lattice parameters and that the fur-ther analysis performed in this work was based on the relative changes ofbdN{hkl}for different sample orientations (measurement of initial
deviatoric stresses) or relative lattice strains with respect to the unloaded sample (in situ tensile test). Therefore, even if the value of l is measured approximately, the uncertainty of this value does not in flu-ence the relative changes of r and corresponding relative shifts of peak positions vs. 2θ angle or d - spacing.
Analysing the diffraction patern obtained for the initial material (cf.
Fig. 1b) and the patterns measured during the tensile test, it can be
con-cluded that the studied samples exhibit a strong crystallographic tex-ture for both phases (see also the ODFs presented in[17,29]). It was found that the positions of texture maxima does not change signifcantly during the tensile test, even during necking. The diffraction rings ob-tained for the initial sample are composed from dots representing coarse grains (the size of the grains is comparable with the size of the beam, cf.[29]). During plastic deformation the grain size (i.e. the dimen-sion of coherent domain) decreases and the dislocation density in-creases, leading to smoother and more broader diffraction lines. Also, it was noticed that the crystallographic texture becomes more pro-nounced, causing an increase of the highest peaks and a vanishing of the lower ones. Due to the variation of peak intensity, reliable analysis was only possible for a limited number of reflections, decreasing with the progress of deformation. The reflections used in the analysis at dif-ferent stages of the experiment are listed inTable 1.
2.3. Determination of the initial stresses
The X-ray Elastic Constants (XEC) of the studied material were cal-culated using the Eshelby-Kröner approach[35–37]from the measured ODFs, as well as the single crystal elastic constants of each phases given by Simons et al.[38]and Inal et al.[15]. The values of C11, C12and C44for
the austenite are: 198 GPa, 125 GPa, 122 GPa, and the ferrite: 231 GPa, 134 GPa, 116 GPa. The average initial residual stresses present in each phase of the studied material were determined using the multi-re flec-tion method described by Baczmanski et al. and Wronski et al.[35,36]. The interplanar spacingsbdN{hkl}required for stress analysis were
mea-sured on the initial state of the studied samples. In the case of sample TD, the measurements for two different sample orientations with re-spect to the experimental setup were performed (i.e. the TD or ND was parallel to the incident beam, as shown inFig. 1a). The spacings bdN{hkl}were determined in 24 different orientations of the scattering
vectors by integrating the 2D pattern with a step of 15° over the whole range of 360° for the azimuth angleα. Then, arithmetical mean bdN{hkl}spacings were calculated for symmetrically equivalentαnand
αn+ 180° angles[29]and the deviatoric part of stress tensor was
deter-mined for each phase (to do this, the precise values of the d0,{hkl}stress
free spacings are not necessary[35,36]). InTable 2, three principal stresses measured for the initial sample TD are presented (this initial sample was measured for two orientations with respect to the experi-mental setup;Fig. 1a), while only one stress component was deter-mined for the sample ND (the latter sample was measured at one orientation i.e. for the ND parallel to the incident beam;Fig. 1a).
The same types of initial stress tensors were determined in the phases of the not loaded sample TD as in our previous neutron diffrac-tion study[29]for a similar material, but the values of the components
determined from the synchrotron experiment are significantly larger
(Table 2). Moreover, a different stress state was found in sample ND.
The possible reason for such disagreements is the heterogeneity of the thermal treatment leading to different initial residual stresses (heterogonous stress can be created, especially during cooling). It should also be stated that the previous neutron study was performed with a larger size of the beam, averaging the information for a large vol-ume (ca. 4 mm × 4 mm × 8 mm[29]). To the contrary, the present re-sults of the synchrotron experiment are much more sensitive to spatial heterogeneities because of the small gauge volume (ca. 0.1 mm × 0.1 mm × 1.5 mm). Despite the spatial variation of the stresses in the initial sample, all the components of the stress tensor fulfil the equilibrium rule i.e. the stress component for the ferrite is opposite to the corresponding one in the austenite and both components exhibit similar absolute values. Thus, the mean stress over both phases (volume fractions 50%:50%) is close to zero, as expected in the case of the non-loaded sample.
2.4. In-situ tensile test during diffraction measurements
In our previous work[29]the lattice strains were measured during a tensile test performed applying the required values of the external load (the load control mode) to the sample. However, during such a test the increasing concentration of stress in the appearing deformation neck leads to an instability of deformation and an immediate fracture of the sample. Therefore, the lattice strains in the neck were not scanned with a synchrotron beam. In the present work, the sample TD and sam-ple ND were measured in the strain control mode with strain rates re-spectively equal to 2.8 × 10⁻⁴ s−1 and 2.4 × 10⁻⁴ s−1 before an appearance of necking, and then the necks were scanned for given con-stant sample strains. The strain control mode enables a measurement also during a heterogonous deformation when the deformation neck is created. In this case, during a progressively increasing sample strain, the loading of the sample decreases, preventing a concentration of the large stress in the narrowest section of the neck.
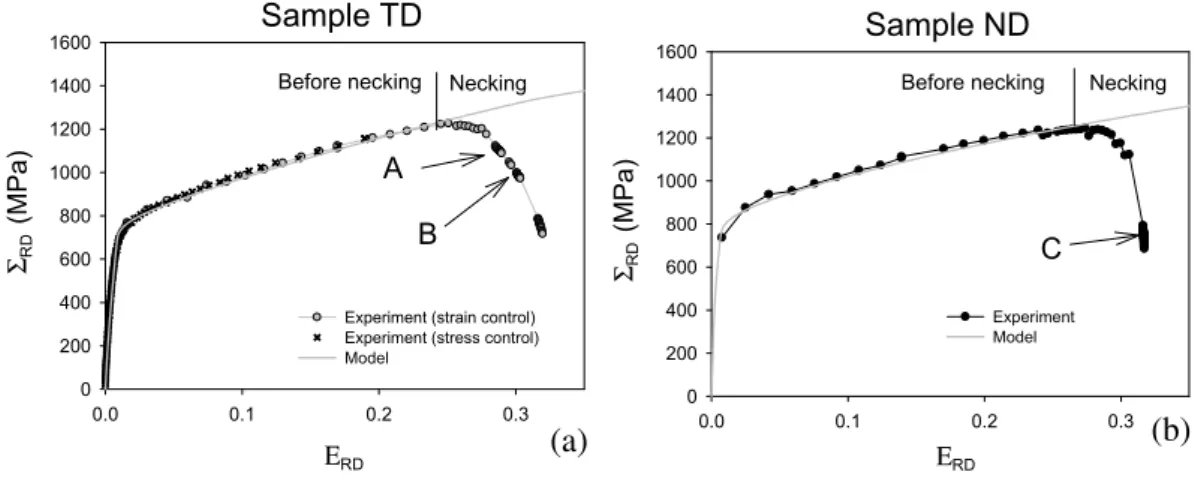
During measurements the position of grip was measured and the force subjected to the sample along RD was determined using a load cell. Then, the true stress was calculated accounting for the sample cross section evolution and the rig elasticity was taken into account in the calculation of true strain. Plots of true stress (ΣRD) vs. true strain
(ERD) are reported respectively for the two studied samples inFig. 2a
and b. In the case of sample TD the measurements were made only dur-ing an advanced plastic deformation includdur-ing the neckdur-ing process and theΣRDvs. ERDplot was completed by our previous results obtained for
an identical sample (studied in[29]) but for the elastoplastic range until the appearance of necking (Fig. 2a). The curves obtained in both exper-iments perfectly overlap in the range of the sample strain 1.5 %bERDb20%. As shown inFig. 2a and b, an important reduction of
the applied stress occurred at about ERD≈25% until the end of the test,
i.e. up to the sample fracture. This stress reduction indicates appearing of a deformation neck which was seen through an optical lunette during measurements. It should be stated that starting from ERD≈25% the true
stress as well true strain cannot be correctly estimated because of a het-erogeneous sample deformation and a significant difference between the cross section within the neck and outside this region (i.e., the exper-imental stress from this threshold indicates relaxation of applied stress
Table 1
Available reflections used in the analysis performed for different stages of the experiment. Determination of initial
stresses
In-situ tensile test and scanning of the necking zone Ferrite 110, 200, 211, 220, 310 110, 200, 211, 220 Austenite 111, 200, 220, 311, 222, 400 111, 200, 311, 222 Table 2
Initial deviatoric residual stresses measured in each phase of the studied UR45N aged sam-ples (in the case of sample TD, the stress tensor is the same as determined in[29]).
σRD(MPa) σTD(MPa) σND(MPa) Sample TD Austenite 134 ± 15 84 ± 15 −218 ± 15
Ferrite −155 ± 19 −44 ± 19 199 ± 18 Sample ND Austenite −34 ± 11 Not measured Not measured
during the sample deformation, but the valuesΣRD, ERDdo not have a
correct physical meaning).
When the neck was noticed, the sample was shifted (together with the rig) to the position enabling a diffraction measurement within the necking region (Fig. 1a). Subsequently, the scans along the necking re-gion were performed for the stages indicated inFig. 2a and b. In the case of the sample TD and sample ND, a few diffraction measurements were made for the early stages of the sample deformation. During ten-sile tests the diffraction pattern were recorded with an exposure time of 40 s separated by 15 s intervals (for which the reflected intensities were not measured). In the case of the neck scans the exposure time was equal to 10 s separated by intervals of 12 s.
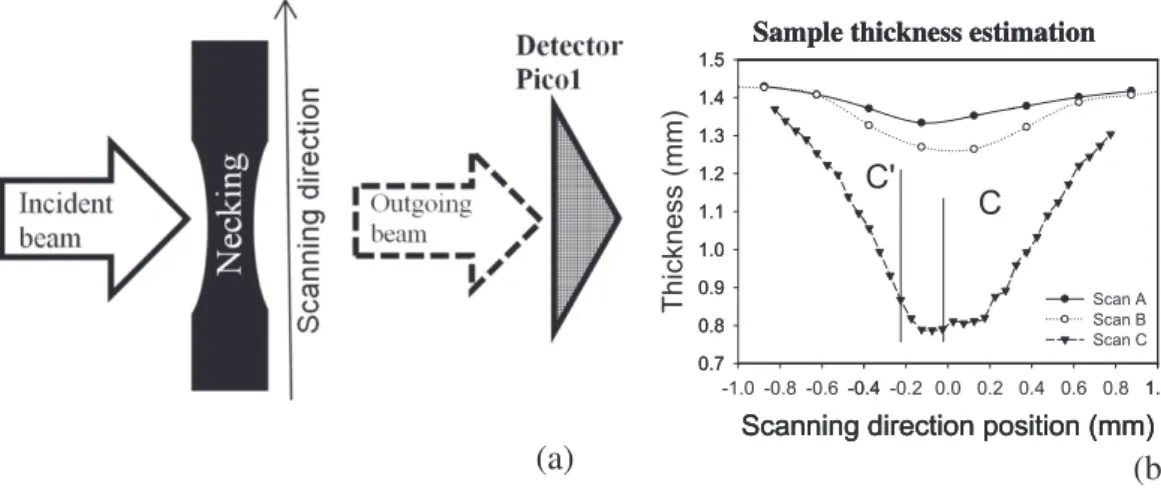
Three scans of the neck were carried out at the sequence of three necking stages A, B and C, as indicated inFig. 2, which represent differ-ent stages of evolution of the ductile damage process for the two studied samples. The scans were performed along the necking zone N (cf.Fig. 3b), while the X-ray beam was parallel to the TD in the case of sample TD (stages A and B) and to the ND in the case of sample ND (stage C),
cf.Fig. 2. The estimation of sample thickness along the necking was
based on the comparison of the outgoing beam intensity received by the Pico1 detector for the neck and for the reference sample having a known thickness equal to 1.4 mm. A schematic drawing of the setup used with the Pico1 detector is presented inFigs. 1a and4a. The absorp-tion law was used to evaluate the variaabsorp-tion of the sample thickness:
I¼ I0e−μd ð1Þ
where: I0and I are the measured intensities of the incident and outgoing
beams, d is the thickness of the sample in the scanned area, andμ = 0.29 cm−1is the linear absorption coefficient of iron for a synchrotron X-ray energy of 87 KeV[39].
The spatial evolutions of the sample thickness along the necking zone estimated for the two samples are presented inFig. 4b. However, the curves determined for the A and B stages cannot be compared with the one for stage C because the measurements were performed for different orientations of the incident beam with respect to the sam-ple (TD or ND). Comparing the thickness of the deformed necks in two
directions (after tensile tests), we found that the reduction of sample thickness in the necking region was more significant in the ND than in the TD. This phenomenon can be explained by the strong crystallo-graphic texture in both phases of the studied steel, leading to anisotropy of macroscopic plastic deformation (the elliptical cross section of the neck is shown in[17]for the round sample).
3. Results and discussion
3.1. Interpretation of diffraction measurements during the tensile test The interplanar spacings were determined for the direction along the applied load (RD,αn= 0° and 180°) for both the studied samples.
For this purpose, the intensities of the diffraction rings were integrated within‘cake shape’ sectors defined by αn± 7.5° and the meanbdN{hkl}
spacings were calculated for symmetrically equivalentαn= 0° and
αn= 180° angles (Fig. 1b). Next, the elastic lattice strainsbεN{hkl}
corre-sponding to different hkl reflection were determined from the equation
bεRDNfhklg¼bd Σ RDNfhklg−bd0RDNfhklg bd0 RDNfhklg ð2Þ
where: bdRDΣ N{hkl}is the interplanar spacings measured along the
loading direction (RD) at different loads (applied stressesΣ11), while
bdRD0 N{hkl}is the initial interplanar spacing measured without external
load.
It should be noted that the strains considered in this work were cal-culated relative to the initial values of the interplanar spacingsbdRD0 -{hkl} measured for the unloaded sample. In this way we avoided
determination of the stress free interplanar spacings d0 , {hkl}for each
phase which, in fact, could not be done due to the presence of the high initial stresses between the phases. Therefore, the further analysis presented in this work is based on the comparison of the elastic strain evolution occurring in the two phases, and the absolute strains or lattice spacings are not determined. Finally, the arithmetic averagesbεRDNphase
over the lattice strains of individual hkl reflections were determined for
Sample TD
Ε
RD 0.0 0.1 0.2 0.3Σ
RD(MPa)
0 200 400 600 800 1000 1200 1400 1600Experiment (strain control) Experiment (stress control) Model
A
B
Before necking Necking
Sample ND
Ε
RD 0.0 0.1 0.2 0.3Σ
RD(MP
a
)
0 200 400 600 800 1000 1200 1400 1600 Experiment ModelC
Before necking Necking
(b)
(a)
Fig. 2. Plots of true stress vs. true strain for the measured sample TD and sample ND. The indicated A, B and C points represent the stages for which scanning of necking zone was performed.
the sample TD (the available reflections are listed inTable 1). The mean lattice strains vs. the applied true stress are shown inFig. 5, separately for the ferritic and austenitic phases (in the case of sample TD the results of the previous experiment performed until necking[29]are also in-cluded inFig. 5a).
The self-consistent model of elastoplastic deformation elaborated by Lipinski and Berveiller[40,41,43,44]was used to interpret the experimental results as well as to determine the parameters of Voce law[29,42]in each phase of the studied duplex steel. In these calculations the initial orientations of crystallites, corresponding to the experimental textures [29], single crystal elastic constants given inSection 3.2(the same as for the XEC calculation) and the initial stresses (listed inTable 2) were used as the input data for each phase. Simulations were performed for 2000 spherical grains belonging either to the ferrite (50%) or to the austenite (50%) phases. The elastic lattice strainsbεRDNphase, and the total sample strainΣRD
vs. the applied stress ERDwere calculated for different tensile loads
corresponding to the experimental ones.
The lattice strainsbεRDNphasesimulated by the self-consistent
model werefitted to the experimental data (Fig. 5, part before neck-ing), and as a result the values of the critical resolved shear stress were identified for both phases. Thus, the two thresholds Γ and Ω, defined by Baczmański and Braham[16]and Baczmanski et al.[17, 29], were identified as the yield points for the austenitic phase and for the ferritic phase, respectively. Adjusting the model results si-multaneously to the experimental lattice strains and to theΣRDvs.
ERDfunction (Fig. 2), the critical resolved shear stresses (CRSS)
τ0phase and parameters τ1phase, θ0phase, θ1phase characterising work
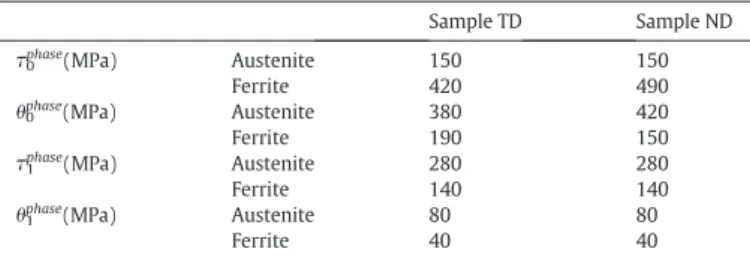
hardening for each phase were determined (for details see[29]). A very good agreement between the macroscopic behaviour predicted by the model and the experimental results was observed in the mea-suring range of the homogenous deformation i.e. up to about 25% of the sample strain (at this strain an unstable process caused by the necking phenomenon begins). Moreover, a good accordance be-tween the theoretical and experimental data was obtained for the measured lattice strains (Fig. 5, part before necking). These results prove that the model correctly predicts the partition of the stresses between both phases. The parameters of Voce law determined for ferrite and austenite are presented inTable 3.
Analysing results for the aged UR45N samples, it can be concluded that the value of yield stress of the aged ferrite is much higher than that of the austenite. Thermal ageing causes the precipitation of second-ary phases and spinodal decomposition of the ferrite (intoα and α′ phases) and consequently a significant increase of the hardness of the ferrite, while the mechanical properties of the austenite remains un-changed. The latter conclusions agree with those previously drawn from the diffraction study performed on a similar material[17,29].
As mentioned above, the small gauge volume measured using a syn-chrotron beam enables determination of a variation of lattice strain in different parts of the sample during a heterogeneous macroscopic de-formation, as was done for samples TD and ND. Before the appearance of the necking phenomenon, a homogenous deformation can be as-sumed at the macroscopic scale. After the necking occurrence, the true stress in the measured region cannot be calculated any more due to the heterogeneous narrowing and unknown evolution of the sample cross section. Therefore, a calibration of the macrostress in the
Thickness (mm)
0.7 0.8 0.9 1.0 1.1 1.2 1.3 1.4 1.5Sample thickness estimation
Scanning direction position (mm)
-1.0 -0.8 -0.6 -0.4 0.7 0.8 0.9 1.0 1.1 1.2 1.3 1.4 1.5Sample thickness estimation
Scanning direction position (mm)
-0.4 -0.2 0.0 0.2C
C'
Sample thickness estimation
Scanning direction position (mm)
0.4 0.6 0.8 1.0 Scan A Scan B Scan C 1.0(a)
(b)
Fig. 4. Schematic drawing of the setup used for scanning of the necking zone N (a). The estimated sample thickness along the necking zone determined from scans A, B and C (b). The abscissa represents the positions of measurement in the scanning direction.
Calibrated ΣRD(MPa) 0 200 400 600 800 1000 1200 1400 1600 1800 2000
<ε
RD>
phase 0.000 0.002 0.004 0.006 0.008 0.010 0.012 A B Before and beginningof necking (out of neck)
Center of neck Calibrated ΣRD (MPa) 0 200 400 600 800 1000 1200 1400 1600 1800
<ε
RD>
au ste n it e-
<ε
RD>
fe rr ite -0.006 -0.004 -0.002 0.000 0.002 ModelExperiment 2 (strain control) Experiment 1 (stress control)
A B Center of neck Before and beginning of necking (out of neck)
(a) (b)
Fig. 5. The evolution of phase lattice strains vs. calibrated sample stress before the beginning of necking and in the centre of the neck for the samples TD (a), deformed in the load control mode (exp. 1) and in the strain control mode (exp. 2). The difference between lattice strains in the austenite and the ferritebεRDNAus−Feris also shown (b). The experimental results (point) are compared with the model (lines).
diffraction volume proposed by Baczmanski et al.[17]was introduced in this study. The calibrated macrostress was determined as:
ΣCalibrated
RD ¼ kbεRDNAusþFermean ð3Þ
where: k is a scalar coefficient describing the relationship between macrostress ΣRDCalibrated in the diffraction gauge volume and the
macrostrainbεRDNmeanAus + Fer, which is equal to the mean strain for both
phases: bεRDNAusþFermean ¼ bε
RDNFerþ bεRDNAus
2 ð4Þ
The real macrostress in the necking area is assumed to be propor-tional to the average elastic macrostrainbεRDNmeanAus + Ferin both the
elastoplastic stage and large deformation stage, even in the damage stage. Therefore, the value ofΣRDCalibratedcan be calculated for the gauge
within the neck from the measuredbεRDNmeanAus+Ferif the value of the k
co-efficient is known. This coefficient can be determined from the
pnecking stages (preferable elastic range) of the sample using linear re-gression [17]. The inter-phase and inter-granular stresses were neglected in the stress calibration because the calculation of the average elastic macrostrainbεRDNmeanAus+Ferwas made considering a large number
of grains having various orientations. The global inter-granular and inter-phase stress, defined as the deviations from macroscopic stress, must cancel each other out and sum to zero over a diffracted volume. This assumption was confirmed in a previous work using a self-consis-tent model by Le Joncour[45]and Baczmanski et al.[17].
InFig. 5a the lattice strains in both phases are presented during the
homogenous plastic deformation for the two samples TD (thefirst
was measured in load control mode until failure, while the second one was measured during a large deformation and the necking process in the strain control mode). When the neck was created, a few measure-ments were made outside the neck and, next, for the point in the centre (at two states of deformation). Moreover, the difference between the mean lattice strain in the austenitebεRDNAusand the ferritebεRDNFeris
presented inFig. 5b. This difference is defined by the equation:
bεRDNAus−Fer¼ bεRDNAus−bεRDNFer ð5Þ
A very good agreement between the experimental data for both samples and model results was obtained for the pre-necking, as well as for the centre of the neck. This proves that the calibration method en-abled the determination of the macrostresses in the gauge volume. It was found that the tendency of the phase strains/stresses evolution de-termined for the pre-necking stages continues in the centre of the neck. It should be noted that before necking as well as in the centre of the neck, the mean lattice strains in the ferrite are larger than the strains in the austenite (a negative value ofbεRDNAus−Fer). This difference is
Calibrated ΣRD (MPa) 0 200 400 600 800 1000 1200 1400 1600 1800 2000
<ε
RD>
phase 0.000 0.002 0.004 0.006 0.008 0.010 0.012 Ferrite exp. Austenite exp. Ferrite model Austenite model Before and beginning of necking (out of neck) Spring back Calibrated ΣRD (MPa) 0 200 400 600 800 1000 1200 1400 1600 1800 2000<ε
RD>
Aus -Fer -0.003 -0.002 -0.001 0.000 0.001 0.002 0.003 0.004 ModelExperiment before necking
Experiment out of neck (during necking)
Spring back Calibrated ΣRD (MPa) 0 200 400 600 800 1000 1200 1400 1600 1800 2000
<ε
RD>
p hase 0.000 0.002 0.004 0.006 0.008 0.010 0.012 Ferrite exp. Austenite exp. Ferrite model Austenite model Before necking In the neck C C' C' Calibrated ΣRD (MPa) 0 200 400 600 800 1000 1200 1400 1600 1800 2000<ε
RD>
Aus-Fer -0.003 -0.002 -0.001 0.000 0.001 0.002 0.003 0.004 Model Experiment Before necking In the neck C C'(c)
(d)
(a)
(b)
Fig. 6. The variation of phase lattice strains (a) and (c) and the difference between the lattice strain in the austenite and the ferritebεRDNAus−Fer(b) and (d) for the sample ND. The evolutions out of the neck (a) and (b) and in two positions in the neck (c) and (d) are shown (cf.Fig. 2b). The model's results are presented (black lines) for the pre-necking stage, while the grey lines connect the strains at the end of the pre-necking stage with the strains in the neck (for a better visualisation).
Table 3
Parameters of plastic deformation determined for the studied samples.
Sample TD Sample ND τ0phase(MPa) Austenite 150 150
Ferrite 420 490
θ0phase(MPa) Austenite 380 420
Ferrite 190 150
τ1phase(MPa) Austenite 280 280
Ferrite 140 140
θ1phase(MPa) Austenite 80 80
caused due to a lower yield stress of the austenitic phase, as explained in
[17,29].
Next, the sample ND was measured during a tensile test and a differ-ent evolution of the phase strains was observed in comparison with the samples TD (cf.Fig. 6). In the calculations the mean lattice strains were calculated for the available reflections presented inTable 1. The initial diffraction pattern allowed us to determine one component of the initial stress tensor (along the RD, cf.Table 2). This component is different and has an opposite sign when compared with the sample TD. The model calculations were performed for the sample ND accounting for the ini-tial stresses (Table 2) and a very good agreement between the model and the measured lattice strains was also obtained (Fig. 6). As can be seen inFig. 2, the macroscopic dependence of a true stress vs. measured true strain was also correctly predicted by the model until the necking phenomenon. In simulations the same value ofτ0phasefor the austenite
and the higher valueτ0phasefor the ferrite in comparison with the sample
TD (Table 3) were used.
If we analyse the necking stage, we can notice the elastic spring backs of the lattice strains/stresses, determined in both phases outside of the neck i.e. in the zone O indicated inFig. 3b. During spring back, the strains decrease linearly with the deformation progress (this effect is well observed inFig. 6a). Simultaneously, the difference between the strains in both phasesbεRDNAus−Ferstabilises - as shown inFig. 6b.
This means that during the necking stage the sample loading decreases in the zone O (out of the neck) and a plastic deformation is terminated in this region. The experimental strains for both phases, as well as the differences between them, were correctly predicted by the self-consis-tent model.
On the contrary, the stress in the neck does not decrease due to a narrowing of the sample section, leading to stress concentration in
Scan A
Scanning direction position (mm)
-1.0 -0.5 0.0 0.5 1.0
<ε
RD>
ph ase 0.003 0.004 0.005 0.006 0.007 0.008 0.009 Ferrite AusteniteScan A
Scanning direction position (mm)
-1.0 -0.5 0.0 0.5 1.0<ε
RD>
Aus-Fer -0.003 -0.002 -0.001 0.000 0.001 0.002 0.003Scan B
Scanning direction position (mm)
-1.0 -0.5 0.0 0.5 1.0
<ε
RD>
ph a s e 0.003 0.004 0.005 0.006 0.007 0.008 0.009 Ferrite AusteniteScan B
Scanning direction position (mm)
-1.0 -0.5 0.0 0.5 1.0<ε
RD>
Aus-Fer -0.003 -0.002 -0.001 0.000 0.001 0.002 0.003Scan C
Scanning direction position (mm)
-1.0 -0.8 -0.6 -0.4 -0.2 0.0 0.2 0.4 0.6 0.8 1.0<ε
RD>
pha s e 0.004 0.005 0.006 0.007 0.008 0.009 0.010 0.011 Ferrite AusteniteC
C'
Scan C
Scanning direction position (mm)
-1.0 -0.8 -0.6 -0.4 -0.2 0.0 0.2 0.4 0.6 0.8 1.0<ε
RD>
au st e nit e-<
ε
RD>
fe rrite -0.003 -0.002 -0.001 0.000 0.001 0.002 0.003C
C'
(a)
(c)
(b)
Fig. 7. The evolution of phase lattice strains (left) and the difference between strains in the austenite and the ferritebεRDNAus−Fer(right) as a function of position in the neck. The results for the scans in the A, B stages (sample TD) and C (sample ND) are shown respectively in panels (a), (b) and (c).
this region. As shown inFig. 6c and d, the volumes in the centre of the neck (point C) and close to the centre (point C′) are subjected to a higher loading than in the pre-necking stage (both points C and C′ are localised in the zone N, cf.Fig. 4b). The lattice strains in the neck centre (point C) follow the tendency of evolution before necking (Fig. 6c), and the difference between lattice strains in both phasesbεRDNAus−Fer
ap-proaches to zero value (Fig. 6d). In point C′, close to the centre and still in the N zone (Fig. 3b), the lattice strain is much smaller in the fer-rite in comparison to that in the austenite (Fig. 6c), hence the difference between these strainsbεRDNAus−Feris large and positive (Fig. 6d). The
significant heterogeneity of the stresses in the necking region will be discussed in the next section.
3.2. Mechanical behaviour inside the necking zone
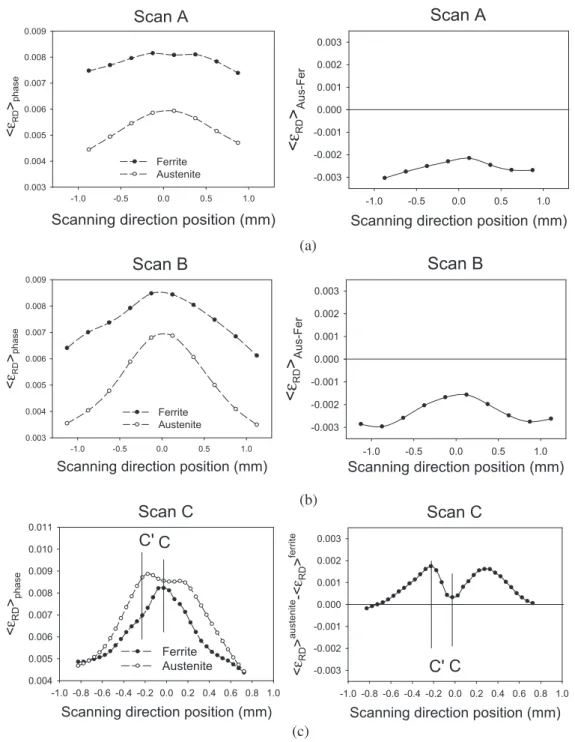
Interesting evolutions of the lattice strains along the neck were ob-served analysing the diffraction data obtained from the three scans per-formed in the direction shown inFig. 3a. The scans were performed for the deformation stages A, B and C as defined inFig. 2. InFig. 7the lattice strains in both phases and the difference between strains in the austen-ite and in the ferrausten-itebεRDNAus−Fer(Eq.(5)) are shown as a function of
position in the neck. In the case of the scans done for the successive de-formation stages A and B, the lattice strain in the ferrite is larger than in the austenite for the entire necking zone (negative value ofbεRDN Aus−-Fer). It can also be observed that in the centre of the neck the difference
between the strains in both phases i.e. the absolute value ofbεRDN Aus−-Fer) decreases faster with deformation than for the other positions in the
sample (compare the subsequent A and B stages inFig. 7). This phenom-enon can be easily explained due to the highest stress concentration as well as through the most advanced plastic deformation in the central re-gion of the neck. Indeed, before the necking appearance the differences between the phase strains decreased for increasing applied stress and progressing sample deformation, as shown inFigs. 5 and 6.
To the contrary, an unexpected evolution of the difference between phase strains vs. position in the neck was determined for the scan C, for which the necking process was more advanced than in the case of stages A and B (cf.Fig. 2). The lattice strains in the centre of the neck (point C) are almost equal for both phases, while in the positions out of the centre (point C′) a significant inversion of the phase strains occurred i.e. a much higher value of the strain was measured in the austenite than in the ferrite (Fig. 7c, on the right). Such strain inversion occurred over al-most the whole necking zone, as was also observed by Baczmański et al.
[29], when the measurements were conducted using neutron diffrac-tion for a large volume of the neck. The transidiffrac-tion of the load from the ferritic phase to the austenitic phase was explained by the possible damage process initiated in the ferrite. Hence, the information obtained previously from neutron diffraction measurement was confirmed using
a synchrotron measurement performed with a much better spatial resolution.
It is also interesting to discover if all the grains in the ferrite are re-sponsible for the observed strain/stress inversion between phases. To this end, the lattice strainsbεN{hkl}measured using different hkl re
flec-tions for both phases are presented inFig. 8. As can be seen, the evolu-tion ofbεN{110}in the ferrite and all the strains in the austenite exhibit
a similar variation vs. the position in the neck, while for the 211 and 200 reflections a sharp decrease of the bεN{211}andbεN{200}strains
with an increasing distance from the centre is observed. This again con-firms the results obtained with a neutron beam for which the important decrease of the lattice strains in the ferrite was observed for the 211 and 200 reflections close to the fracture of the sample, while the experimen-tal lattice strains for the 110 reflection did not change significantly (cf.
Fig. 10in[29]).
It can be concluded that the ferritic grains having particular orienta-tions and contribute to the 211 and 200 reflections, behaving differently to the other grains in the sample. As suggested in[29], the softening of the damaged grains leads to a reduction of the localised stresses and causes a transfer of the load to the other grains in the sample (mostly in the austenitic phase). However, as shown using synchrotron diffrac-tion, this process depends on the position in the neck, therefore the rea-son of the determined spatial evolution of the strains in both phases should be explained.
In order to study the influence of the neck geometry on the stress and strain distributions, an FEM simulation was carried out with Abaqus CAE 6.13 software. The three-dimensional geometric model was built on the basis of the shape and dimensions of the necking zone deter-mined for the deformed and broken sample (Fig. 7b). The simulation was performed within the elastic deformation stage of the studied material using anisotropic overall elastic constants previously determined by a self-consistent model. The overall stiffness tensor (given inTable 4) was calculated from single crystal elastic constants of each phase and accounting for the crystallographic texture.
Dynamic implicit analysis with a step time of 100 s was applied in
the FEM calculations. A homogeneous uniform pressure of P =−
80 MPa was imposed on the two end sections of the sample (as shown inFig. 9) to simulate the stress imposed by external loading dur-ing the tensile test. In order to balance the computation speed and the accuracy of the FEM simulation, two different mesh sizes were applied.
Table 4
Anisotropic elastic matrix determined using self-consistent method for experimental tex-tures[17,29]and single crystal elastic constants given inSection 2.3.
C11 [GPa] C22 [GPa] C33 [GPa] C12 [GPa] C13 [GPa] C23 [GPa] C44 [GPa] C55 [GPa] C66 [GPa] 261 265 252 99 112 108 84 88 74
Scanning direction position (mm)
-1.0 -0.8 -0.6 -0.4 -0.2 0.0 0.2 0.4 0.6 0.8 1.0 0.002 0.004 0.006 0.008 0.010 0.012 0.014 Ferrite {200} Ferrite {211} Ferrite {110}
C
C'
Scanning direction position (mm)
-1.0 -0.8 -0.6 -0.4 -0.2 0.0 0.2 0.4 0.6 0.8 1.0
<ε
RD>
{hkl} 0.000 0.002 0.004 0.006 0.008 0.010 0.012 0.014 austenite {200} austenite {311} austenite {111}C
C'
(a)
(b)
On the out-necking area, the mesh with free structured tetrahedral ele-ment was used and the eleele-ment seeds were assigned every 0.5 mm along the edge of the model. The same type of element was applied for the mesh of the in-necking area, but the distance between the ele-ment nodes was reduced to 0.05 mm in order to acquire a more accurate result along the necking zone. The macroscopic elastic tensor of the studied duplex steel was introduced into the model to account for elas-tic anisotropy of the sample. In the simulation performed in this work, mainly the influence of the neck shape on stress distribution was stud-ied (a two-phase structure was not considered in the calculations).
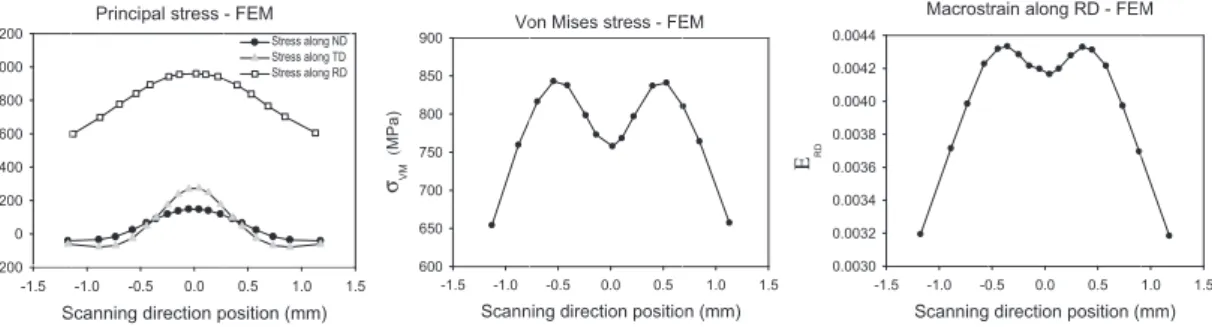
The evolutions of the simulated principal stressesσRDFEM,σTDFEMandσNDFEM
(shear stresses were negligible), longitudinal strainεRDFEMin the direction
of the applied load and von Mises stressσVMFEMas a functions of position
along the neck are plotted inFig. 10. Analysing the above plots it can be concluded that due to three-axiality of the stresses in the necking region, the maximum von Mises stressσVMFEMand strainεRDFEMare not concentrated
in the narrowest part of the neck but in the same distance from that place. ComparingFigs. 9 and 10an interesting correlation was found between the difference between phase strainsbεRDNAus−Ferdetermined from
dif-fraction measurement and the value of von Mises equivalent stressσMisesFEM
obtained from the FEM simulation. Both quantities decrease significantly in the centre of the neck. The value of the difference between phase strainsbεRDNAus−Ferincreases and reaches a maximum at the distance
of approximately 0.3 mm from the centre, and also the value of von Mises equivalent stressσMisesFEM increases up to a maximum but at the
dis-tance of about 0.5 mm from the centre. Despite some disagreement concerning positions of the maxima, a good qualitative correlation be-tween the measuredbεRDNAus−Ferand simulatedσMisesFEM vs. position in
the neck, indicates that the equivalent von Mises stress plays an impor-tant role in the softening of the ferrite and probably leads to the initiation of the damage process in this phase. The value of the von Mises macrostress increases at some distance from the neck centre due to three-axiality of the macrostress leading to more advanced evolution pro-cesses occurring in the phases.
Analysing the results obtained for different groups of diffracting grains, a good correlation can be seen between the lattice strains mea-sured with all reflections available for the austenite, 110 reflection for the ferrite and calculated von Mises stressσVMFEMas well as longitudinal
sample strainεRDFEM(cf.Figs. 9 and 10). Therefore, the stress distribution
in the grains contributing to the above-mentioned reflections is charac-teristic for the shape of the deformation neck under the tensile load and can be explained by a geometrical effect, as predicted by the FEM calcula-tions. However, the dependence of the lattice strains measured in the fer-rite using 211 and 200 reflections exhibit a different dependence on the scanning position compared with the calculated von Mises stressσVMFEM
and strainεRDFEM. In this case, the highest measured strain is concentrated
in the narrowest part of the neck and significantly decreases with the dis-tance from this region. As previously mentioned, this effect can be caused by the damage occurring in the groups of grains contributing to the 211 and 200 reflections in the ferrite, as was previously observed using neu-tron diffraction[29].
4. Conclusions
The main original issue of this work was the study of the stress and strain partitioning between the phases in duplex stainless steel, correlated with the damage process during the necking phenomenon. To do this, the lattice strains were scanned along the neck using in situ synchrotron dif-fraction during the tensile test and the experimental data were analysed using the self-consistent model and FEM simulation. A special high reso-lution of the synchrotron diffraction (small gauge volume) allowed study-ing the lattice strains evolution within the neck.
As a result, it was confirmed, that the elastoplastic deformation occurs differently for both phases of the aged UR45N stainless steel i.e. the yield stress for the austenite is much lower than for the ferrite (cf.[29]). It was found that the difference between the phase yield stresses strongly depends on the initial stresses in the phases. The initial stresses are heterogeneous in the studied material, as it was observed comparing the results obtained for the different samples.
On the basis of the performed study, the following conclusions concerning damage heterogeneity correlating with stress distribution in the deformation neck can be drawn:
1) For early stages of necking, the difference between the lattice strains in the austenite and the ferrite evolves more significantly in the neck centre (compared to beyond the centre) leading to an increase of
S -1.5 σRD , σ TD and σND (MP a) -200 0 200 400 600 800 1000 1200 Principal stress Scanning direction p -1.0 -0.5 0.0 - FEM position (mm) 0.5 1.0 1.5 Vo Scann -1.5 -1.0 σVM (MPa ) 600 650 700 750 800 850 900 on Mises stress - FE
ning direction positio
-0.5 0.0 0.5 EM on (mm) 1.0 1.5 Ε RD 0 0 0 0 0 0 0 0 Macrost Scanning -1.5 -1.0 -0 0.0030 0.0032 0.0034 0.0036 0.0038 0.0040 0.0042 0.0044
train along RD - FEM
direction position (m 0.5 0.0 0.5
M
mm) 1.0 1.5
Fig. 10. Dependence of the principal stresses (a) von Mises stress (b) and longitudinal strain (c) on the position along the neck.
strains in the austenite and a decrease of strains in the ferrite. This ten-dency agrees with the evolution observed before necking and can be explained by the stress concentration in the narrowest region of the neck.
2) In the case of an advanced necking process, the mean strains in the ferrite decrease more significantly in the positions out of the neck centre, causing a load transfer to the austenite. As the result, the strains in the ferrite become lower than in the austenite for all posi-tions measured along the neck, and the inversion in the strain partitioning between the phases is much more important than that extrapolated from the tendency before necking. These observation confirms the results obtained previously with neutron diffraction
[29]and is explained by the damage process initiated in the ferritic phase.
3) It was observed that a stress relaxation process occurs mostly in the ferritic grains contributing to 200 and 211 reflections, and this con-clusion also agrees with the previous neutron experiment[29]. Good spatial resolution of the synchrotron diffraction experiment enabledfinding out that the maximum decrease of the lattice strains occurred at the distance 0.3 mm from the neck centre. This means that damage initiation depends both on the position in the neck and orientation of the grain lattice with respect to the applied load. 4) The spatial evolution of the lattice strains along the neck was com-pared with FEM simulations. A qualitative correlation between the variation of macroscopic von Mises stress and the difference be-tween lattice strains in both phases suggest that the equivalent von Mises stress could be responsible for the processes occurring in the phases, especially for the softening (or damage) of particular grains in the ferrite.
Acknowledgements
The work was supported partly by the Regional Council of Cham-pagne-Ardenne [Conseil régional de ChamCham-pagne-Ardenne]; the Nation-al Science Centre (Narodowe Centrum Nauki - NCN), Poland, grants: No. UMO - 2011/03/N/ST8/04058 and DEC - 2013/11/B/ST3/03787; and partly by the Ministry of Science and Higher Education (Ministerstwo Nauki i Szkolnictwa Wyższego - MNiSW), Poland. We also acknowledge the European Synchrotron Radiation Facility (ESRF) for the use of their synchrotron radiation facilities.
References
[1] A. Desestret, J. Charles, Les aciers inoxydables austéno-feritiques, in: P. Lacombe, B. Baroux, G. Beranger (Eds.), Les Aciers Inoxydables, Les Editions de la Physique, Les Ulis, France 1990, pp. 631–678.
[2] S. Bugat, J. Besson, A.F. Gourgues, F. N'Guyen, A. Pineau, Microstructure and damage initiation in duplex stainless steel, Mater. Sci. Eng. A 317 (2001) 32–36.
[3] L. M'Cirdi, J.L. Lebrun, K. Inal, Experimental approach of a crystallographic cleavage criterion in a cast aged duplex stainless steel, Acta Mater. 29 (2001) 3879–3887.
[4] P.H. Pumphrey, K.N. Akhurst, Aging kinetics of CF3 steel in range 300–400 °C, Mater. Sci. Technol. 6 (1990) 211–219.
[5] S. Bonnet, J. Bourgoin, J. Champredonde, D. Guttmann, M. Guttmann, Relationship between evolution of mechanical properties of various cast duplex stainless steels and metallurgical and aging parameters: outline of current EDF programmes, Mater. Sci. Technol. 6 (1990) 221–229.
[6] P. Lacombe, B. Baroux, G. Beranger, Les Aciers Inoxydables, Les Editions de la Phy-sique, Les Ulis, France, 1990.
[7] A. Mateo, L. Llanes, M. Anglada, A. Redjaimia, G. Metauer, Characterization of the in-termetallic G-phase in an AISI 329 duplex stainless steel, J. Mater. Sci. 32 (1997) 4533–4540.
[8] C.J. Park, H.S. Kwon, Effects of aging at 475 °C on corrosion properties of tungsten containing duplex stainless steels, Corros. Sci. 44 (2002) 2817–2830.
[9] C. Duval, Contribution à l'étude de l'endommagement des aciers austéno-ferritiques viellis. PhD thesis, Ecole Centrale de Paris, 1992.
[10] P. Joly, Etude de la rupture d'aciers inoxydables fragilisés par vieillissement à 400 °C. PhD thesis, Ecole Nationale Supérieurdes Mines de Paris, 1992.
[11]A. El Bartali, V. Aubin, V. Degallaix, Fatigue damage analysis in a duplex stainless steel by digital image correlation technique, Fatigue Fract. Eng. Mater. Struct. 31 (2008) 137–151.
[12] R. Strubbia, S. Hereñú, A. Giertler, I. Alvarez-Armas, L.U. Krupp, Experimental charac-terization of short crack nucleation and growth during cycling in lean duplex stain-less steels, Int. J. Fatigue 65 (2014) 58–63.
[13] K. Istomin, B. Dönges, N. Schell, H.-J. Christ, U. Pietsch, Analysis of VHCF damage in a duplex stainless steel using hard X-ray diffraction techniques, Int. J. Fatigue 66 (2014) 177–182.
[14] U. Krupp, O. Düber, H.J. Christ, B. Künkler, A. Schick, C.P. Fritzen, Application of the EBSD technique to describe the initiation and growth behaviour of microstructurally short fatigue cracks in a duplex steel, J. Microsc. 213 (3) (2004) 313–320.
[15] K. Inal, P. Gergaud, M. Francois, J.-L. Lebrun, X-ray diffraction methodologies of macro and pseudo-macro stress analysis in a textured duplex stainless steel, Scand. J. Metall. 28 (1999) 139–150.
[16] A. Baczmański, C. Braham, Elastoplastic properties of duplex steel determined using neutron diffraction and self-consistent model, Acta Mater. 52 (2004) 1133–1142.
[17] A. Baczmanski, L. Le Joncour, B. Panicaud, M. Francois, C. Braham, A.M. Paradowska, S. Wronski, S. Amara, R. Chiron, Neutron time-of-flight diffraction used to study aged duplex stainless steel at small and large deformation until sample fracture, J. Appl. Crystallogr. 44 (2011) 966–982.
[18]N. Jia, Z.H. Cong, X. Sun, S. Cheng, Z.H. Nie, Y. Ren, P.K. Liaw, Y.D. Wang, An in situ high energy X-ray diffraction study of micromechanical behavior of multiple phases in advanced high-strength steels, Acta Mater. 57 (2009) 3965–3977.
[19]M.R. Daymond, H.G. Priesmeyer, Elastoplastic deformation of ferritic steel and ce-mentite studied by neutron diffraction and self-consistent modeling, Acta Mater. 50 (2002) 1613–1623.
[20] M.L. Young, J.D. Almer, M.R. Daymond, D.R. Haeffner, D.C. Dunand, Load partitioning between ferrite and cementite during elasto-plastic deformation of an ultrahigh-carbon steel, Acta Mater. 55 (2007) 1999–2011.
[21] D. Gloaguen, G. Oum, V. Legrand, J. Fajoui, S. Branchu, Experimental and theoretical studies of intergranular strain in an alpha titanium alloy during plastic deformation, Acta Mater. 61 (2013) 5779–5790.
[22] E.M. Francis, B.M.B. Grant, J. Quinta da Fonseca, P.J. Phillips, M.J. Mills, M.R. Daymond, M. Preuss, High-temperature deformation mechanisms in a polycrystal-line nickel-base superalloy studied by neutron diffraction and electron microscopy, Acta Mater. 74 (2014) 18–29.
[23] A.A. Saleh, D.W. Brown, E.V. Pereloma, B. Clausen, C.H.J. Davies, C.N. Tomé, A.A. Gazder, An in-situ neutron diffraction study of a multi-phase transformation and twinning-induced plasticity steel during cyclic loading, Appl. Phys. Lett. 106 (2015) 171911.
[24] V. Hounkpati, S. Fréour, D. Gloaguen, V. Legrand, J. Kelleher, W. Kockelmann, S. Kabra, In situ neutron measurements and modelling of the intergranular strains in the near-β titanium alloy Ti-β21S, Acta Mater. 109 (2016) 341–352.
[25]V. Taupin, R. Pesci, S. Berbenni, S. Berveiller, R. Ouahab, O. Bouaziz, Lattice strain measurements using synchrotron diffraction to calibrate a micromechanical model-ing in a ferrite–cementite steel, Mater. Sci. Eng. A 561 (2013) 67–77.
[26] P. Haušild, C. Berdina, P. Bomparda, N. Verdièrec, Ductile fracture of duplex stainless steel with casting defects, Int. J. Press. Vessel. Pip. 78 (2001) 607–616.
[27] M. Balbi, M. Avalos, E. Bartali, I. Alvarez-Armas, Microcrack growth and fatigue be-havior of a duplex stainless steel, Int. J. Fatigue 31 (2009) 2006–2013.
[28] J. Prahl, A. Machová, A. Spielmannová, M. Karlík, M. Landa, P. Haušild, P. Lejček, Duc-tile-brittle behavior at the (110)[001] crack in bcc iron crystals loaded in model, Eng. Fract. Mech. 77 (2010) 184–192.
[29] A. Baczmański, Y. Zhao, E. Gadalińska, L. Le Joncour, S. Wroński, C. Braham, B. Panicaud, M. François, T. Buslaps, K. Soloducha, Elastoplastic deformation and dam-age process in duplex stainless steels studied using synchrotron and neutron dif-fractions in comparison with a self-consistent model, Int. J. Plast. 81 (2016) 102–122.
[30] H.J. Bunge, Texture Analysis in Material Science: Mathematical Methods, Butterworth, London, 1982.
[31]J.E. Daniels, M. Drakopoulos, High-energy X-ray diffraction using the Pixium 4700 flat panel detector, J. Synchrotron Radiat. 6 (2009) 463–468.
[32]A.P. Hammersley, S.O. Svensson, M. Hanfland, S.O. Fitch, D. Häusermann, Two-di-mensional detector software: from real detector to idealised image or two-theta scan, High Pressure Res. 14 (1996) 235–248.
[33] S. Merkel, Multifit/Polydefix Polycrystal Deformation using X-rays, https:// code.google.com/p/multifit-polydefix2011.
[34]P. Thompson, D.E. Cox, J.B. Hastings, Rietveld refinement of Debye-Scherrer syn-chrotron X-ray data from Al2O3, J. Appl. Crystallogr. 20 (1987) 79–83.
[35] A. Baczmański, C. Braham, W. Seiler, Microstresses in textured polycrystals studied by multireflection diffraction method and self consistent model, Philos. Mag. 83 (2003) 3225–3246.
[36] S. Wroński, A. Baczmański, R. Dakhlaoui, C. Braham, K. Wierzbanowski, E.C. Oliver, Determination of stressfield in textured duplex steel using TOF neutron diffraction method, Acta Mater. 55 (2007) 6219–6233.
[37]S. Fréour, D. Gloaguen, M. François, R. Guillén, Modelling and simulation of multi-phase effects on X-ray elasticity constants, Phys. Status Solidi B 239 (2003) 297–309.
[38] G. Simoms, H. Wang, Single Crystal Elastic Constants and Calculated Aggregate Prop-erties: A Handbook, 2nd edition The M.I.T. Press, Cambridge, Massachusetts and London, 1971.
[39] J.H. Hubbell, S.M. Seltzer, Tables of X-ray mass attenuation coefficients and mass en-ergy-absorption coefficients 1 keV to 20 MeV for elements Z = 1 to 92 and 48 additional substances of dosimetric interest, Naadditional Inst. of Standards and Technology -PL, Gaithersburg, MD (United States), Ionizing Radiation Div, 1995.
[40]P. Lipinski, M. Berveiller, Elastoplasticity of micro-inhomogeneous metals at large strains, Int. J. Plast. 5 (1989) 149–172.
[41] P. Lipinski, M. Berveiller, E. Reubrez, J. Morreale, Transition theories of elastic-plastic deformation of metallic polycrystals, J. Arch. Appl. Mech. 65 (1995) 291–311.
[42]C. Tome, G.R. Canova, U.F. Kocks, N. Christodoulou, J.J. Jonas, The relation between macroscopic and microscopic strain hardening in f.c.c. polycrystals, Acta Metall. 32 (1984) 1637–1653.
[43] G. Franz, F. Abed-Meraim, M. Berveiller, Strain localization analysis for single crystals and polycrystals: towards microstructure-ductility linkage, Int. J. Plast. 48 (2013) 1–33.
[44] G. Franz, F. Abed-Meraim, M. Berveiller, Effect of microstructural and morphological parameters on the formability of BCC metal sheets, Steel Res. Int. 85 (2014) 980–987.
[45] L. Le Joncour, B. Panicaud, A. Baczmański, M. Francois, C. Braham, A. Paradowska, S. Wroński, R. Chiron, Damage in duplex steels studied at mesoscopic and macroscopic scales, J. Mech. Mat. 42 (2010) 1048–1063.
![Fig. 1b) and the patterns measured during the tensile test, it can be con- con-cluded that the studied samples exhibit a strong crystallographic tex-ture for both phases (see also the ODFs presented in [17,29])](https://thumb-eu.123doks.com/thumbv2/123doknet/7321830.210838/5.892.453.829.129.206/patterns-measured-tensile-studied-samples-exhibit-crystallographic-presented.webp)
![Fig. 10 in [29]).](https://thumb-eu.123doks.com/thumbv2/123doknet/7321830.210838/10.892.157.746.76.317/fig-in.webp)