HAL Id: hal-01631306
https://hal.archives-ouvertes.fr/hal-01631306
Submitted on 9 Nov 2017
HAL is a multi-disciplinary open access
archive for the deposit and dissemination of
sci-entific research documents, whether they are
pub-lished or not. The documents may come from
teaching and research institutions in France or
abroad, or from public or private research centers.
L’archive ouverte pluridisciplinaire HAL, est
destinée au dépôt et à la diffusion de documents
scientifiques de niveau recherche, publiés ou non,
émanant des établissements d’enseignement et de
recherche français ou étrangers, des laboratoires
publics ou privés.
Towards HMD-based Immersive Analytics
Grégoire Cliquet, Matthieu Perreira, Fabien Picarougne, Yannick Prié, Toinon
Vigier
To cite this version:
Grégoire Cliquet, Matthieu Perreira, Fabien Picarougne, Yannick Prié, Toinon Vigier. Towards
HMD-based Immersive Analytics. Immersive analytics Workshop, IEEE VIS 2017, Oct 2017, Phoenix,
United States. �hal-01631306�
Towards HMD-based Immersive Analytics
Gr ´egoire Cliquet* READi Design lab l’ ´Ecole de Design Matthieu Perreira† LS2N UMR6004 CNRS University of Nantes Fabien Picarougne‡ LS2N UMR6004 CNRS University of Nantes
Yannick Pri ´e§ LS2N UMR6004 CNRS
University of Nantes
Toinon Vigier¶ LS2N UMR6004 CNRS
University of Nantes
Figure 1: Three decades of various immersive analytics systems using CAVE [43], stereoscopic [4], or Head Mounted [15] Displays.
ABSTRACT
Advances in 3D hardware and software have led to increasingly cheaper and simple-to-use immersive virtual reality systems that can provide real-time interactive 3D data representation. The immersive analytics field is developing as the newest avatar of 3D visual analyt-ics, which may relaunch the long enduring 2D vs 3D visualization debate. However, the terms of the debate have changed: leveraging 3D human perception within virtual environments is now easier, and the immersive quality of today’s rendering is sufficient enough for researchers to concentrate on testing and designing immersive data representation and interaction rather than on technological problems. In this position paper we propose a short historical perspective on the use of immersive technologies for visual analytics and on the 2D vs 3D debate. We stress out five principles that we think should be followed to explore the HMD-based visual analytics design space, before introducing ongoing work within the IDEA project. CCS CONCEPTS
• Human-Centered Computing → Virtual Reality;Visual Analyt-ics;Information visualisation
1 INTRODUCTION
Within the research fields concerned with visual analysis of abstract data, Visual Data Mining [51] focuses on computer mining pro-cesses and the visualization of their results, while Visual Analytics is more concerned with the human analyst who has to ”get a feeling for the data, detect interesting knowledge, and gain a deep visual understanding of the data set” [6]. The advent of lab accessible 3D technologies in the 1990’s developed research on the contribution of 3D to visual analytics. Indeed, researchers argued that taking
*e-mail: [email protected] †e-mail: [email protected] ‡e-mail: [email protected] §e-mail: [email protected] ¶e-mail: [email protected]
advantage of human capabilities for 3D perception and spatial cog-nition would considerably improve knowledge discovery through visual representations adequate for rapid information recognition and pattern detection [9]. However, these lines of work seem to have been depreciated by a probably biased debate between 2D and 3D enthusiasts, and a widely-shared though not clearly stated consensus amongst the datavis community on the supposed non-utility of the use of 3D technologies for data visualization and analytics.
One of the caveats of this debate may be that 3D has not been well defined. Indeed, 3D human perception implies a lot of depth cues that can only be satisfied by the use of dedicated equipment, such as those used in Virtual Reality: CAVE, HMD, spatial tracking, etc. But the difficulty to access to or implement such complex technical solu-tions, has often limited experiments to use 2D flat display, largely jeopardizing the possibility to design useful 3D systems. Moreover, recent advances in 3D related hardware and software have led to increasingly cheaper and simple-to-use Head-Mounted Displays (HMD) that provide consumer with real-time tracking and interac-tive 3D data representation. Sustained by the equivalent maturing of consumer grade Augmented Reality (AR) technology, researchers and industrial are once again getting involved in designing 3D-based data exploration tools, and the newly named ”Immersive analytics” field [11] is developing along various seminars, scientific workshops, startups, and community building initiatives. Indeed, the terms of the 2D/3D debate have changed, as the quality of consumer-grade immersive systems has now reached a sufficient level to allow de-signers to concentrate on the design and the test of immersive data representation and interaction.
In the first part of this paper we propose a perspective on the use of immersive technologies for visual analytics, and further discuss the 2D/3D debate. The second part is dedicated to stressing out five principles that we think should be followed for HMD-based visual analytics studies. We then rapidly present the research directions we are following in our IDEA (Immersive Data Exploration and Analysis) interdisciplinary group.
2 IMMERSIVE TECHNOLOGIES FOR VISUAL ANALYTICS 2.1 Depth cues for 3D visual perception
3D human visual perception is mainly related to the ability of our brain to discern depth. Several factors (depth cues) are involved in this perception mechanism. They have been widely studied in the lit-erature [14,30] and come from different stimuli: ocular (accommoda-tion and vergence), pictorial (shading, size and occlusion), dynamic (motion cues) and stereopsis (binocular disparity). While the relative importance of the different depth cues is still an open question, the current consensus carefully states that they are complementary, and that the quality of a 3D representation is strongly correlated with the effectiveness of the depth perception it conveys [12].
2.2 A short history of VR in visual analytics
Although the literature is not abundant on the subject, VR and more generally Virtual Environment (VE) have long been used for (scientific) data visualization, while visual analytics in VE began in the mid-90’. The first systems used CAVE (e.g. [43]) for database visualization. The development of inexpensive rendering techniques, such as stereoscopic display, later encouraged the implementation of generic VR-based visualizations that took into account the associated advantages. For instance, [4, 35] did extend basic techniques such as scatterplots to 3D, leveraging audio-visual aspects of VR so as to create mutually perceptually distinguishable attributes. Since these early works, several adaptations of visual analytics methods have been carried in VR such as [18] in the graph domain, or [50] for Self Organizing Maps. A more detailed review of different techniques is proposed by [15, 19].
Parallel to this system-related line of research, other more theoretically-oriented studies tried to establish the added value of VE in the context of visual analytics. A number of researcher have showed that the benefits of VR for helping people better understand their data, both from a perceptual [2, 12, 32, 48] or a more hard-ware [49] point of view. They notably have demonstrated that, with the use of appropriate depth cues, 3D perception can improve the intelligibility of the data, allow to disambiguate complex abstract representations, and make it easier to move a shape mentally.
2.3 The 2D vs 3D debate
As mentioned earlier, a debate regarding the use of 2D vs 3D in data visualization has persisted for at least twenty years. It has been raised in several communities with different arguments. To name a few, the graph drawing community has for instance long considered that 3D visualizations have significant difficulties mainly due to perceptual and navigational conflicts when using 2D screens and 2D input devices to interact with a 3D world [22]. 3D having even been considered as ”a prejudicial epiphenomena” by one of the major figures of the community [17]. Argumentation in the infovis community has been more focused on the nature of the data, mostly involving categorical variables (as opposed to scientific visualization), for which conventional 2D techniques such as 2D scatterplots with color and size coding are sufficient for the typical tasks related to patterns, trends or outliers discovery [42].
The 2D/3D debate still persists today with arguments about per-formance issues (3D requires large calculations), or the relative importance between resolution and immersion (immersion involves a large field of view, reducing the resolution for the same number of pixels displayed) [34]. However we think there are two reasons for which it may have been based on unstable foundations.
A first reason would be related to the non acknowledgment of the difference between monoscopic 3D rendering on 2D screens and immersive 3D. Yet perception is undoubtedly different in immersive environments and on flat 2D screens, as several experiments have showed interesting properties of immersion related to estimation of relative depths [14], perception of specific objects through an important visual clutter [33], perception of camouflaged objects [47],
perception of curved surfaces and textures [26], and perception of the quality of the representation despite the impact of several image degradations (noise, low contrast, low definition...) [33].
A second reason would be related to visual fatigue and cybersick-ness [31] due to early stereoscopic displays and VR systems. Indeed, the hardware limitations in terms of resolution, latency, etc., and the ocular and vestibular constraints (e.g. accommodation/vergence conflict) have long damaged the user experience and prevented fairly lengthy immersion sessions that would have enabled efficient visual analytics [46]. However, the recent technological progresses have led to the development of light and high quality consumer-graded VR devices which opens the way to a regular use of VR systems and pushes several research works to even more reduced discomfort and fatigue [38, 44].
As a conclusion of this short discussion, 3D and VR techniques still have a potential to assist decision-makers in analytical tasks. For instance, by deeply immersing users in data sets they allow analysts to explore data and/or knowledge from the inside-out and not from the outside-in as in 2D techniques [36]. Such use cases can only be tested by using VR environments where users are, by design, allowed to navigate continuously to new positions inside the data sets, gaining more insights about the data. The advent of new VR technologies leads us to believe that the 2D/3D debate is far from being closed, but that it may be relaunched on a sounder basis, around the determination of cases in which immersive visual analytics is better than 2D visual analytic, or provides possibilities that are not feasible in 2D.
3 TOWARDSHMD-BASED VISUAL ANALYTICS
The recent introduction of affordable good quality HMDs such as Oculus Rift and HTC Vive allowed investigations in HMD-based im-mersive analytics, with promiseful results. [13] showed for instance that modern HMDs provide comparable experiences to CAVE2 sys-tems for collaborative graph exploration, even reducing time to complete tasks, for a fraction of the cost. It may be only a matter of months before researchers have easy access to wireless high-quality HMD, with integrated eye-tracking, as well as robust hand, body, and objects tracking, and hand/body active haptic systems. Such technical capabilities will unfold an enormous design space for ab-stract data HMD-based immersive analytics. This design space will need careful definition and exploration. We propose below five principles that may be of help in that exciting scientific journey.
3.1 Design for daily immersive analytics
A first crucial principle is to design for professionals who spend time working on actual datasets, within everyday work settings [7]. Showing examples of practical usefulness of HMD-based immersive analytics is indeed mandatory for developing immersive analytics community.
Developing scenarios with credible tasks and objectives under-lines the importance of studying work context at various levels to leverage acceptance. Focusing on real world tasks that last suffi-ciently long (i.e. more than half an hour) seems important, as well as being able to sit while conducting immersive data exploration tasks. The integration of the classical desktop remains a question, to which various answers can be given. [54] propose that users mostly remain seated at their desks putting in and out their HMD. Another possibility is that the user hops for a data exploration session in a chair with rollers and a tablet, that both allows for 360° rotation and movements, while still giving access to papers or keyboard if needed (see section 4). Such solutions could be enhanced by completely freeing the user from his desktop if VR desktop-like applications for knowledge work develop (such as web browser, mailer, word processor, spreadsheet, social apps, etc.), together with robust text input devices [53].
Lastly, social acceptability of VR for future workers, mostly related to social interactions from VR to the external real work environment, is also a key, but this question exceeds immersive analytics per se and may be out of scope for the moment being.
3.2 Create spaces for bodily-engaged users
We are talking here of virtual and real spaces, within which users will act physically. Displacements in real space are mainly of 3 types: move the head while sitting; move the head and rotate the body while standing; or freely move (e.g. walk) at room scale level. Those can be combined with various body parts movements such as hands, arms, legs, feet, etc. There has been a lot of transfer function proposals to map these to displacement, body movements, command launching, virtual spaces, not to mention the use of dedicated con-trollers, gloves, or all kind of tangible props that can as well play the role of passive (e.g. tablets [3]) or active haptic (e.g. gloves [8]) feedback effectors.
There is a crucial challenge in considering the embodied con-nection to data entailed by movements, postures, displacements, gestures, etc. Immersion and presence in VR environments allow designers to make use of a lot of the embodied perception and in-teraction capabilities [16], proprioception largely complementing visual perception when the head, the arms, and the whole body are engaged in action. For instance spatial memory would allow an ana-lyst to literally remember with his body where objects are behind his back, while unconscious body-related measurements would allow to compare distances from or between datapoints. Objects can also be at various ego-centered distances, from arm’s reach to walking reach, to teleporting reach, etc.
We think that VR immersive analytics spaces should be designed so as to make maximal use of the analyst’s body. This implies designing for various physical distances to data, providing useful proximal and distal points of views on datapoints withing a coherent space. Movements in or out of the data have to be considered, which complement zooming in or out. Also, datapoints becoming ”real” objects (and not just points) around which users can move, that can be manipulated, examined, carried, etc. one has to study the affordances they should provide, their shapes, their associated tools (what is an inspector?), etc.
3.3 Pay attention to perception at every stage
Although perception is largely studied in VR, visual analytics raise new perceptual challenges and constraints which should be taken into account at every stage of the design process, from ideation to production to evaluation. Such challenges are mostly related to 3D data visualization (e.g. impact of depth and distances on 3D percep-tion of shapes, colors and contrasts [45]) and data visualizapercep-tion in VR (color [21] as well as shape and size [5] perception in peripheral vision); but hardware-related aspects are also very important (e.g. impact of display resolution and latency on data perception). These questions should be tackled both at theoretical and empirical levels: data visualization and interaction design choices should both be motivated from previous theoretical knowledge about human percep-tion, and subjectively tested for the specific tasks of the dedicated immersive analytics application.
We also want to stress out visual attention as a perceptual aspect of particular importance, that can be used either to improve the over-all comfort of a 3D data visualization, or to analyze user’s behavior during immersive data analysis. With regards to comfort, knowledge about where the user is gazing at can be used to adjust both dis-parity and depth of focus in real time, which are two major factors linked to stereoscopic viewing comfort [52]. Such possibilities have already been investigated in the last ten years in immersive rooms or stereoscopic screens using eye-tracking [24] or visual attention models [10, 23]. But the imminent availability of eye-tracking HMD promises a democratization of these perceptual improvements as
well as the possibility to use gaze recordings for perceptual render-ing through simulated fovea [37]. Concernrender-ing the study of users’ behaviors, if some work has already been conducted for visual analyt-ics [29], the extension to immersive analytanalyt-ics remains to be studied. This extension is a challenge for the eye-tracking community as the study of visual attention in VR environment still remains an open research question from both theoretical (e.g. scanpath comparison methods) and methodological (e.g. experimental protocols) points of view [39].
Lastly, because VR immersive analytics mainly challenges 3D data visualization, most of our previous examples deal with visual perception. However, as claimed in Section 3.2, HMD-based immer-sive analytics should enable users to be physically engaged in the VE. This implies that immersive analytics perceptual studies should involve multiple sensory modalities [25]. It is also a crucial topic to study discomfort and cybersickness in VR, as they are mainly caused by inter-sensory constraints, e.g. vestibulo-ocular conflicts [40].
3.4 Use design methods and processes
There is no design method for immersive analytics yet, and it is not clear if such methods are desirable. Yet we think that one should pay careful attention to their processes when designing immersive analytic systems, both as guides in the design process, and for later reflection, so as to hopefully to come up with shareable actionable conclusions on how to design immersive analytics. There are some directions that may be worth looking at, beyond classical design thinking, UX design, or more focused HCI/vis methods. First, gen-eral VR methods and tools [28] may be useful to design specific virtual environments dedicated to data visualizations. Tools to de-sign VR environments and program from within VR could also be leveraged, which could lead to the development of rapid prototyping environments for immersive visualization. Second, taking advantage of physical representations of data [27] by implementing them in VR should provide valuables insights. These representations could either be physically constructed through design workshops, or already be on the shelf. Third, there should be value in the translation of clas-sical data visualizations into immersive environment, a challenge that has to be tackled, and for which work should be acknowledged in publication [41]. Such translation should focus on taking into account body engagement (e.g. climbable barcharts, or pie-chart parts that can be manipulated), using classical VR interaction means first, and only developing dedicated tools if needed.
3.5 Provide shareable experiences to build community
Reading the description of a new VR interaction means in a scientific paper can take several minutes of struggling with a few paragraphs, without being sure to fully grasp the embodied signification of it, while actually experiencing the interaction means may just takes a few seconds to allows this grasping. We think that it is crucial that publications are accompanied with shared immersive experiences. Hopefully WebVR [1] will soon allow to share valuable snippets of immersive analytics representation / interaction proposals. Open sourcing could also be a solution for incremental co-building of shareable immersive analytics frameworks and workspaces [20].
4 THEIDEA PROJECT
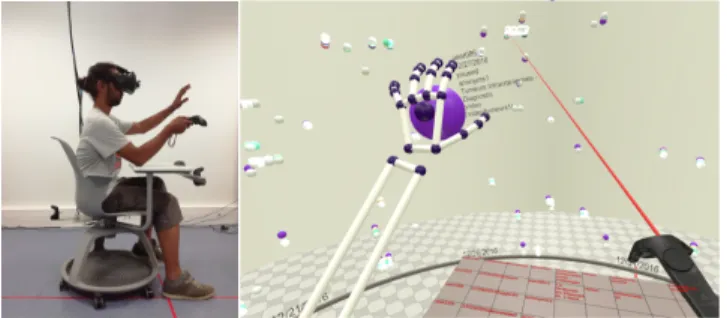
The IDEA project (Immersive Data Exploration and Analysis) gathers both designers and Data science, HCI/Vis, and percep-tion/attention/VR scientists. The aim of the project is to explore both representation, interaction, and evaluation means for Immersive Analytics. Following our first principles, our main design decision has been to use a roller-chair with a tablet, freeing the user from his desk and allowing him to either sit, stand, or walk (fig. 2). We are currently developing an open-source framework for immersive analytics environments adapted to such work context, while design-ing and testdesign-ing various data representations and interaction means.
Figure 2: IDEA project preliminary developments. Users have roller chairs with tablets, they can either sit, stand, or walk to explore and interact with the data environment, so as to make maximal use of embodied perception and action.
The immersive analytics experiences proposals will be evaluated using datavis methods with a focus on eye-tracking and attention modeling.
ACKNOWLEDGMENTS
The authors wish to thank the developers of the IDEA environment Florian Melki and Rodolphe Rosalie. The IDEA Project is funded by the Pays de la Loire French region (West Creative Industries program) and Episteme ANR project (ANR-14-CE24-0028).
REFERENCES
[1] WebVR explained. https://github.com/w3c/webvr/blob/ master/explainer.md. Accessed: 2017-07-13.
[2] Y. Aitsiselmi and N. S. Holliman. Using mental rotation to evaluate the benefits of stereoscopic displays. In SPIE 7237, Stereoscopic Displays and Applications XX, 2009.
[3] I. G. Angus and H. A. Sowizral. Embedding the 2d interaction metaphor in a real 3d virtual environment. In Proceedings Volume 2409, Stereo-scopic Displays and Virtual Reality Systems II, pp. 282–293, 1995. [4] H. Azzag, F. Picarougne, C. Guinot, and G. Venturini. VRMiner: a tool
for multimedia databases mining with virtual reality. In J. Darmont and O. Boussaid, eds., Processing and Managing Complex Data for Decision Support, pp. 318–339. IDea Group Publishing,, Apr. 2006. [5] J. Baldwin, A. Burleigh, R. Pepperell, and N. Ruta. The perceived size
and shape of objects in peripheral vision. i-Perception, 7(4), 2016. [6] C. Beilken and M. Spenke. Visual, interactive data mining with
info-zoom - the medical data set. In Workshop notes on discovery challenge. PKDD, pp. 49–54, Sept 1999.
[7] M. Bellgardt, S. Pick, D. Zielasko, T. Vierjahn, B. Weyers, and T. W. Kuhlen. Utilizing immersive virtual reality in everyday work. In 3rd IEEE Workshop on Everyday Virtual Reality (WEVR), 2017. [8] J. Blake and H. B. Gurocak. Haptic glove with mr brakes for virtual
reality. IEEE/ASME Trans. on Mechatronics, 14(5):606–615, Oct 2009. [9] S. K. Card, J. D. Mackinlay, and B. Shneiderman, eds. Readings in Information Visualization: Using Vision to Think. Morgan Kaufmann Publishers Inc., San Francisco, CA, USA, 1999.
[10] C. Chamaret, S. Godeffroy, P. Lopez, and O. Le Meur. Adaptive 3d rendering based on region-of-interest. In Proc. SPIE, vol. 7524, 2010. [11] T. Chandler, M. Cordeil, T. Czauderna, T. Dwyer, J. Glowacki, C. Goncu, M. Klapperstueck, K. Klein, K. Marriott, F. Schreiber, and E. Wilson. Immersive analytics. In BDVA, pp. 1–8, Sept 2015. [12] I. Cho, W. Dou, Z. Wartell, W. Ribarsky, and X. Wang. Evaluating
depth perception of volumetric data in semi-immersive vr. In 2012 IEEE Virtual Reality Workshops (VRW), pp. 95–96, March 2012. [13] M. Cordeil, T. Dwyer, K. Klein, B. Laha, K. Marriott, and B. H.
Thomas. Immersive collaborative analysis of network connectivity: Cave-style or head-mounted display? IEEE TVCG, 23(1):441–450, Jan 2017.
[14] J. E. Cutting. How the eye measures reality and virtual reality. Behavior Research Methods, Instruments, & Computers, 29(1):27–36, Mar 1997.
[15] C. Donalek, S. G. Djorgovski, A. Cioc, A. Wang, J. Zhang, E. Lawler, S. Yeh, A. Mahabal, M. Graham, A. Drake, S. Davidoff, J. S. Norris, and G. Longo. Immersive and collaborative data visualization using virtual reality platforms. In IEEE Big Data, pp. 609–614, Oct 2014. [16] P. Dourish. Where the Action Is. The Foundations of Embodied
Inter-action. MIT Press, oct 2001.
[17] P. Eades. On the future of graph drawing. Invited talk, 18th Interna-tional Symposium on Graph Drawing, 2010.
[18] N. F´erey, P. E. Gros, J. H´erisson, and R. Gherbi. Visual data mining of genomic databases by immersive graph-based exploration. In Proc. of the 3rd Int. Conf. on Computer Graphics and Interactive Techniques, GRAPHITE ’05, pp. 143–146. ACM, New York, NY, USA, 2005. [19] R. J. Garca-Hernndez, C. Anthes, M. Wiedemann, and D. Kranzlmller.
Perspectives for using virtual reality to extend visual data mining in information visualization. In IEEE Aerospace, pp. 1–11, March 2016. [20] R. Hackathorn and T. Margolis. Immersive analytics: Building virtual data worlds for collaborative decision support. In 2016 Workshop on Immersive Analytics (IA), pp. 44–47, March 2016.
[21] T. Hansen, L. Pracejus, and K. R. Gegenfurtner. Color perception in the intermediate periphery of the visual field. Journal of Vision, 9(4):26–26, 2009.
[22] I. Herman, G. Melancon, and M. S. Marshall. Graph visualization and navigation in information visualization: A survey. IEEE Transactions on Visualization and Computer Graphics, 6(1):24–43, Jan 2000. [23] S. Hillaire, A. L´ecuyer, G. Breton, and T. R. Corte. Gaze behavior and
visual attention model when turning in virtual environments. In ACM Symp. on VR Software and Technology, pp. 43–50, 2009.
[24] S. Hillaire, A. L´ecuyer, R. Cozot, and G. Casiez. Using an eye-tracking system to improve camera motions and depth-of-field blur effects in virtual environments. In Virtual Reality, pp. 47–50. IEEE, 2008. [25] T. Hogan, U. Hinrichs, and E. Hornecker. The visual and beyond:
Characterizing experiences with auditory, haptic and visual data repre-sentations. In DIS, pp. 797–809. ACM, 2017.
[26] N. Holliman. 3d display systems. Technical report, University of Durham, 2005.
[27] Y. Jansen, P. Dragicevic, P. Isenberg, J. Alexander, A. Karnik, J. Kildal, S. Subramanian, and K. Hornbæk. Opportunities and challenges for data physicalization. In Proc. CHI’15, pp. 3227–3236. ACM, 2015. [28] J. Jerald. The VR Book: Human-Centered Design for Virtual Reality.
AMC and Morgan & Claypool, New York, 2016.
[29] K. Kurzhals, B. Fisher, M. Burch, and D. Weiskopf. Evaluating visual analytics with eye tracking. In BELIV Workshop, pp. 61–69, 2014. [30] M. Landy, L. Maloney, and M. Young. Psychophysical estimation of
the human depth combination rule, vol. 1383, pp. 247–254. Publ by Int Soc for Optical Engineering, 1991.
[31] J. J. LaViola Jr. A discussion of cybersickness in virtual environments. ACM SIGCHI Bulletin, 32(1):47–56, 2000.
[32] J. I. Maletic, A. Marcus, G. Dunlap, and J. Leigh. Visualizing object-oriented software in virtual reality. In Workshop on Program Compre-hension), May 2001, Toronto, Canada, pp. 26–35, 2001.
[33] J. Merritt. Evaluation of stereoscopic display benefits. Introduction to stereoscopic displays and applications. In: SPIE The International Society for Optical Engineering, 33, 1991.
[34] T. Munzner. Visualization analysis and design. CRC press, 2014. [35] H. R. Nagel, E. Granum, S. Bovbjerg, and M. Vittrup. Immersive
Visual Data Mining, pp. 281–311. Springer, 2008.
[36] L. Nelson, D. Cook, and C. Cruz-Neira. Xgobi vs the c2: Results of an experiment comparing data visualization in a 3-d immersive virtual reality environment with a 2-d workstation display. Computational Statistics, 14(1):39–51, Mar 1999.
[37] A. Patney, J. Kim, M. Salvi, A. Kaplanyan, C. Wyman, N. Benty, A. Lefohn, and D. Luebke. Perceptually-based foveated virtual reality. In ACM SIGGRAPH 2016 Emerging Technologies, p. 17. ACM, 2016. [38] T. M. Porcino, E. Clua, D. Trevisan, C. N. Vasconcelos, and L. Valente. Minimizing cyber sickness in head mounted display systems: design guidelines and applications. In 5th Int. Conf. on Serious Games and Applications for Health (SeGAH), pp. 1–6. IEEE, 2017.
[39] Y. Rai, J. Guti´errez, and P. Le Callet. A Dataset of Head and Eye Movements for 360 Degree Images. In Proc. 8th Conf. on Multimedia Systems, MMSys’17, pp. 205–210. ACM, New York, NY, USA, 2017.
[40] L. Rebenitsch and C. Owen. Review on cybersickness in applications and visual displays. Virtual Reality, 20(2):101–125, 2016.
[41] R. Sadana, V. Setlur, and J. Stasko. Redefining a contribution for immersive visualization research. In Proc. Companion on Interactive Surfaces and Spaces, ISS Companion ’16, pp. 41–45. ACM, 2016. [42] B. Shneiderman. Why not make interfaces better than 3d reality? IEEE
Computer Graphics and Applications, 23(6):12–15, Nov 2003. [43] J. Symanzik, D. Cook, B. D. Kohlmeyer, and C. Cruz-Neira. Dynamic
statistical graphics in the cave virtual reality environment. In Proc. Dynamic Statistical Graphics Workshop. Citeseer, 1996.
[44] K. Terzi´c and M. Hansard. Methods for reducing visual discomfort in stereoscopic 3d: a review. Signal Processing: Image Communication, 47:402–416, 2016.
[45] J. T. Todd. The visual perception of 3D shape. Trends in Cognitive Sciences, 8(3), 2004. doi: 10.1016/j.tics.2004.01.006
[46] A. Van Dam, A. S. Forsberg, D. H. Laidlaw, J. J. LaViola, and R. M. Simpson. Immersive vr for scientific visualization: A progress report. IEEE Computer Graphics and Applications, 20(6):26–52, 2000. [47] S. G. Wardle, J. Cass, K. R. Brooks, and D. Alais. Breaking camouflage:
Binocular disparity reduces contrast masking in natural images. Journal of vision, 10(14):38–38, 2010.
[48] C. Ware and P. Mitchell. Visualizing graphs in three dimensions. ACM Trans. Appl. Percept., 5(1):2:1–2:15, Jan. 2008.
[49] E. J. Wegman and J. Symanzik. Immersive projection technology for visual data mining. Journal of Computational and Graphical Statistics, 11(1):163–188, 2002.
[50] D. Wijayasekara, O. Linda, and M. Manic. Cave-som: Immersive visual data mining using 3d self-organizing maps. In The 2011 International Joint Conference on Neural Networks, pp. 2471–2478, July 2011. [51] P. C. Wong. Visual data mining. IEEE Computer Graphics and
Applications, 19(5):20–21, Sept 1999.
[52] M. W¨opking. Viewing comfort with stereoscopic pictures: An experi-mental study on the subjective effects of disparity magnitude and depth of focus. J. of the society for information display, 3(3):101–103, 1995. [53] C.-M. Wu, C.-W. Hsu, T.-K. Lee, and S. Smith. A virtual reality keyboard with realistic haptic feedback in a fully immersive virtual environment. Virtual Reality, 21(1):19–29, Mar 2017.
[54] D. Zielasko, B. Weyers, M. Bellgardt, S. Pick, A. Meibner, T. Vierjahn, and T. W. Kuhlen. Remain seated: towards fully-immersive desktop VR. In 3rd IEEE Workshop on Everyday Virtual Reality, pp. 1–6, 2017.
![Figure 1: Three decades of various immersive analytics systems using CAVE [43], stereoscopic [4], or Head Mounted [15] Displays.](https://thumb-eu.123doks.com/thumbv2/123doknet/12210224.316713/2.918.120.798.121.483/figure-decades-various-immersive-analytics-stereoscopic-mounted-displays.webp)