HAL Id: hal-00767582
https://hal.inria.fr/hal-00767582
Submitted on 13 Sep 2019
HAL is a multi-disciplinary open access
archive for the deposit and dissemination of
sci-entific research documents, whether they are
pub-lished or not. The documents may come from
teaching and research institutions in France or
abroad, or from public or private research centers.
L’archive ouverte pluridisciplinaire HAL, est
destinée au dépôt et à la diffusion de documents
scientifiques de niveau recherche, publiés ou non,
émanant des établissements d’enseignement et de
recherche français ou étrangers, des laboratoires
publics ou privés.
Efficiency of Large-Scale Distributed Systems
Anne-Cécile Orgerie, Marcos Dias de Assuncao, Laurent Lefèvre
To cite this version:
Anne-Cécile Orgerie, Marcos Dias de Assuncao, Laurent Lefèvre. A Survey on Techniques for
Improv-ing the Energy Efficiency of Large-Scale Distributed Systems. ACM ComputImprov-ing Surveys, Association
for Computing Machinery, 2014, 46 (4), pp.31. �10.1145/2532637�. �hal-00767582�
efficiency of large-scale distributed systems
ANNE-CECILE ORGERIE CNRS, IRISA Laboratory, France MARCOS DIAS DE ASSUNCAO IBM, Brazil
LAURENT LEFEVRE
INRIA, LIP Laboratory, University of Lyon, France
The concerns about the rising energy consumption of data centers and the need to improve their efficiency have been shared by a large part of the research community and IT industry. As a result, a myriad of techniques have been proposed to curb the energy consumed by information and telecommunications technology. This article surveys techniques and solutions proposed to improve the energy efficiency of key components of data centers, namely computing and network resources. Existing techniques to evaluate and model the energy consumed by these resources are discussed. The paper also describes hardware and software approaches for reducing the energy consumption of entire distributed systems. The main goal of the survey is to review the state of the art and foster research on schemes to make network and computing resources more energy efficient.
Categories and Subject Descriptors: A.1 [Introductory and Survey]: General; C.2.0 [Computer-Communication Networks]: General; H.3.4 [Information Systems]: Systems and Software— Distributed Systems
General Terms: Survey, distributed systems, power, communication
Additional Key Words and Phrases: Energy efficiency, distributed systems, computing, networking
1. INTRODUCTION
Although reducing the energy consumption has always been key for sensor net-works and battery-constrained devices, it has only recently become a major con-cern for other ICT systems. Research efforts in distributed computing in general have mostly been driven by performance, but ignoring the implications in energy consumption that some improvements can cause is no longer possible. Nowadays, the price of the energy that a server consumes during its lifetime often exceeds its purchase cost [Barroso 2005]. As a consequence, data centers are reaching power delivery limits, forcing new infrastructures to be set up near power stations to avoid transmission losses [Greenpeace 2011].
In general, the energy that a system consumes comprises two components:
—A fixed (or static) part that depends on the system’s size and on the type of used components (computing, data storage and network elements); it is due to leakage currents present in any powered system.
—A variable (or dynamic) part that results from the usage of computing, storage, and network resources; it is caused by system activity and changes in the clock rates.
The energy consumption E of an equipment depends on its power consumption P over time t. Hence, for a given time interval T , the energy is given by:
E(T ) = Z T
0
P (t) dt (1)
In a large distributed system such as a Grid or a data center, various computing and networking equipments – such as PCs, switches, routers, and servers – often waste a great amount of energy because they typically remain powered on even when they are idle. For instance, in 2010 the Green Grid consortium carried out a survey about unused servers in 188 data centers, mostly located in the United States [Green Grid 2010], they estimated that on average 10% of the servers are never used, hence wasting energy; an amount that could be saved if the unused servers were switched off or put into low consumption modes. Due to scaling effects, even wastage at the component level can have global consequences on the energy efficiency of an entire distributed system.
Reducing the energy consumption of large-scale distributed systems is a chal-lenging issue that should be addressed at different levels: infrastructure, nodes, and hardware components. This article surveys techniques and solutions proposed to improve the energy efficiency of two key types of components in distributed sys-tems, namely computing and (wired) network resources. The main goal of this work is to review the state of the art and foster research on schemes to make computing and network resources more efficient. Section 2 discusses the different approaches for saving energy in computing resources. Section 3 classifies the research work on energy savings for wired networks. Finally, Section 4 presents concluding remarks.
2. ENERGY-EFFICIENCY OF COMPUTING RESOURCES
Data centers and supercomputers comprise large numbers of servers concentrated in a small area. According to the 37th edition of the Top500 list1 released in June
2011, the K Computer located at the RIKEN Advanced Institute for Computational Science (AICS) in Japan, is the fastest supercomputer in the world (8.2 PFLOPS). The K Computer consumes the energy to power nearly 10,000 homes and costs around $10 million a year to operate [Geller 2011]. Such power requirements and costs are generally limiting factors of the scalability of supercomputers and data centers.
The development of supercomputers has long been driven by performance as attested by the top500 list. The green500 list has been a means to reorganize the top500 ranking by considering the energy efficiency of supercomputers, trying to raise awareness about their large power requirements [Feng and Scogland 2009].
Energy can be saved at different levels in a large computing infrastructure. How-ever, the first and difficult step towards saving energy is to discover how much power individual components consume; a mandatory task to design and evaluate new energy-efficient architectures and algorithms.
2.1 Measuring and modeling the energy consumption of computing resources : from energy sensors to energy models
The energy consumption of computing resources can either be determined by energy sensors (like wattmeters) or be estimated by energy models. Wattmeters can be completely external equipment or components integrated into Power Distribution Units (PDUs) and temperature sensors. Regarding power measurements, energy sensors integrated into components offer a smaller measurement granularity than external wattmeters. Deploying energy sensors or wattmeters can be costly if it is not done when the whole infrastructure (i.e. cluster or data center) is set up.
Using energy models to estimate the consumption of components or an entire infrastructure is less expensive than deploying wattmeters. However, the models should be lightweight not to interfere with the energy consumption they try to estimate. Models can estimate the energy consumption of racks, devices, processes, services, etc. For example, PowerTOP2 is a Linux software utility developed by Intel and whose goal is to “find the software component(s) that make a laptop use more power than necessary while it is idle”. To estimate the power usage, PowerTOP uses Advanced Configuration and Power Interface (ACPI)3.
As processors are among the most consuming components of computers, sev-eral solutions have been proposed to evaluate their consumption at different lev-els [Castagnetti et al. 2010], including:
—Cycle level estimation where the power consumption of each processor unit is estimated at each clock cycle.
—Instruction level power analysis in which the power consumption of processor instructions are summed to estimate the energy a program consumes.
—Power analysis at the functional level based on analyzing the processor architec-ture.
—System level power estimation considering the average power of an instruction multiplied by an application’s execution time to obtain its energy consumption. Fan et al. [Fan et al. 2007] model the energy consumption according to a CPU’s activity, whereas another approach consists in deducing the consumption by using event-monitoring counters included in modern processors, starting with Pentium 4 [Merkel and Bellosa 2006].The main issue with such techniques lies in limiting the overhead incurred by the method.
The power P consumed by a processor can be expressed mathematically as the sum of the static power Pstaticand the dynamic power Pdynamic[Wang et al. 2010].
Pdynamiccan be presented as follows:
Pdynamic= ACV2f
where A is the percentage of active gates, C is the total capacitance load, V the supply voltage and f the frequency [Ge et al. 2005].
2PowerTOP http://www.linuxpowertop.org/powertop.php
3The Advanced Configuration and Power Interface (ACPI) is a standard developed by Hewlett-Packard, Intel, Microsoft, Phoenix Technologies and Toshiba. Its goals are to reduce a computer’s power consumption by switching off its components, whereas the operating system manages the power supply of each component.
Another research issue is to estimate the power that applications consume. By providing a model to predict the power consumption and performance of the high performance LINPACK benchmarks, Subramaniam and Feng [Subramaniam and Feng 2010] concluded that the maximum energy efficiency is not always achieved at the highest performance. This leads to an interesting question: how to measure energy-efficiency? For infrastructures such as data centers, the most common met-ric is the Power Usage Effectiveness (PUE), introduced by the Green Grid4 and
defined as:
P U E = T otal F acility P ower IT Equipment P ower
Another common metric is the Data Center Infrastructure Efficiency (DCiE) [Green Grid 2007] expressed as:
DCiE = 1 P U E =
IT Equipment P ower
T otal F acility P ower × 100%
These two metrics indicate how much power is used by the IT infrastructure and hence, how efficient are the cooling system and other non-IT resources. Other met-rics are available, such as the performance per watt, used to produce the Green500 list [Feng and Scogland 2009] and expressed in Floating Point Operations Per Sec-ond (FLOPS) per watt.
To evaluate the energy efficiency of an application or middleware, it is interesting to use as criteria the QoS metrics related to the evaluated software. For task scheduling in a Cloud environment, Yeo and Lee [Yeo and Lee 2011] utilize the energy-delay product, where they show that computing nodes that are at most three times slower than the fastest node should be discarded from the Cloud system to achieve an optimal energy-delay product.
Another solution is to use benchmarks to compare the efficiency of various ar-chitectures and software. Examples include the SPECpower, a benchmark that evaluates the power and performance characteristics of volume server class and multi-node class computers; and JouleSort, a benchmark to evaluate the trade-off between power and performance of computing nodes by sorting a fix number of records using as little energy as possible [Rivoire et al. 2007]. Once the energy con-sumption of individual computing resources is known, researchers can design and implement new techniques to reduce the energy consumed by the overall infrastruc-ture. In a Grid or Cloud infrastructure, different solutions can be applied to both the node and the infrastructure levels. The following sections discuss research on these two levels.
2.2 Node optimizations
This section analyzes solutions that work at a node level and that can lead to large energy savings at the distributed-system level.
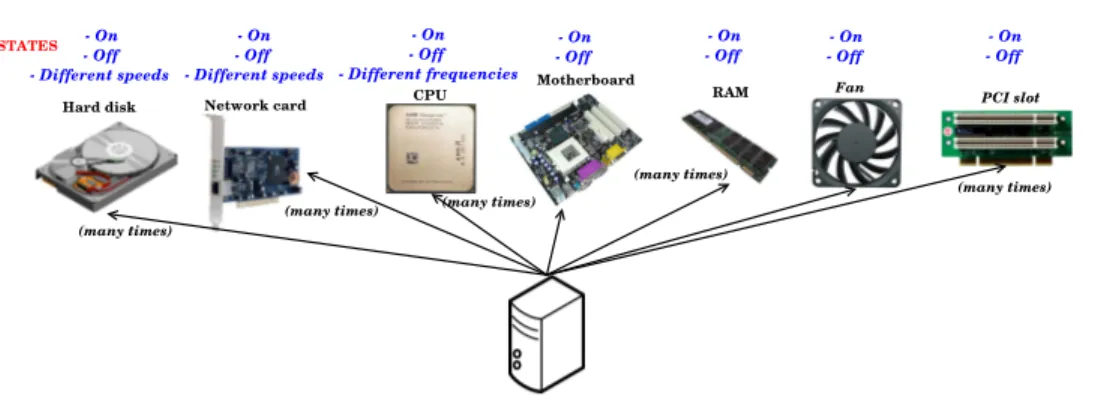
A computing node comprises several components, each of which can be optimized to save energy as shown in Figure 1. This figure also shows what components can
4The Green Grid is a non-profit, open industry consortium of end-users, policy-makers, technology providers, facility architects, and utility companies collaborating to improve the resource efficiency of data centers and business computing ecosystems.
Fig. 1. Possible states per node component.
be switched off or put in lower power-consumption modes. As discussed earlier, a node can typically be in one of several states – varying from fully-on to fully-off – which have their own energy consumptions. For example, a CPU has an off-state and several on-off-states that correspond to different operating frequencies and voltages [Snowdon et al. 2005].
Several studies focus on minimizing the consumption of specific components, such as Network Interface Cards (NICs) [Gunaratne et al. 2005], hard disks [Allalouf et al. 2009] and CPUs [Dietz and Dieter 2006], with varying results. Table I shows the energy consumed by the components of a typical rack server [Fan et al. 2007].
Component Peak power Count Total Percentage CPU 40 W 2 80 W 37.6 % Memory 9 W 4 36 W 16.9 % Disk 12 W 1 12 W 5.6 % PCI slots 25 W 2 50 W 23.5 % Motherboard 25 W 1 25 W 11.7 % Fan 10 W 1 10 W 4.7 % System total 213 W
Table I. Component peak power breakdown for a typical server .
Despite some the potential benefits of turning components off, this technique has limitations. For example, the motherboard, a high consuming component, can be turned off only if the entire node can (sleep state). This section details node-level techniques to curb the energy consumption of computing resources, in-cluding switching off resources (using sleep states), configuring different voltages and frequencies for the CPU, improving the energy-efficiency of software and using energy-efficient hardware and low-level capabilities.
2.2.1 Energy-aware hardware capabilities. As shown in Figure 1, manufacturers can improve the energy efficiency of all server components (e.g. power supplies, fans and disks) by providing solutions that work at the hardware level. For example, HPC nodes commonly use hard disk drives – a scenario that may change as SSD
become more affordable – whose energy consumption can be reduced by spinning platters down [Carrera et al. 2003]. However, spinning platters up leads to peaks in power consumption and takes time. Hence, the objective is generally to minimize disk accesses to keep platters spun down as long as possible [Carrera et al. 2003].
In addition to improving the energy-efficiency of hardware components, to get closer to proportional computing [Barroso and Holzle 2007], manufacturers could allow individual components such as PCI slots and CPU cores, to be put into sleep state when not in use (independently from the motherboard). During computing phases, network cards may not be required and could hence be turned off. Finally, another way for manufacturers to improve the energy efficiency is by increasing the number of voltages, frequencies and speeds available for each component (CPU, disk, NIC) making it able to adapt its working conditions to the load.
2.2.2 Sleep state. While the first and natural idea to save energy is to shut down idle nodes [Chase et al. 2001], this poses a problem: how to wake them up when required? Wake-On-LAN, a mechanism implemented on Ethernet cards, allows a remote user to wake up a PC by sending the latter specific packets via the network [Gunaratne et al. 2005]. Under this scheme the Ethernet card must be powered on at all times. The Intelligent Platform Management Interface (IPMI) is a standard hardware that operates independently from the operating system and allows administrators to manage a system remotely through a direct serial connection or via a LAN connection. This interface can also be used to switch nodes on and off remotely [Leangsuksun et al 2006].
Suspend to disk techniques can be used to reduce the energy consumed during wake-up and booting periods. When a node suspends to disk, all the main memory contents are saved in files on the hard disk drive, thus preserving the state of the operating system (e.g. open applications and documents). All of the node’s components are turned off and, at the next state switch, the node will load the hibernate file, restoring the previous state. However, the sleep state is useless for nodes always used or which should always remain on for availability constraints. Other energy-efficient techniques must be used in cases where nodes are constantly switched on.
2.2.3 Dynamic Voltage and Frequency Scaling. For a few years, laptop pro-cessors have been able to adjust their working frequency and power consumption to conserve battery life. This technology, called Dynamic Voltage and Frequency Scaling (DVFS) [Snowdon et al. 2005], is available on recent High Performance Computing (HPC) nodes and servers present in data centers, Grids and Clouds, but is seldom exploited. Under DVFS, P-states (performance states) define the different frequencies supported by a processor. The several P-states – P0, P1, P2. . . Pn where n is processor dependent – enable power savings. For example, under P3 the processor will run slower and use less power than under P1. On Linux, the CPUfreq infrastructure allows the control of P-states by governors that decide which available frequency, between minimal and maximum, must be chosen. The available governors include the on-demand, which adjusts the frequency automat-ically; the performance that chooses the highest frequency; the user-space, which allows for setting the frequency manually; the conservative, which increases the
fre-quency progressively (unlike the on-demand governor which skips to the maximal frequency when the system is in full load).
C-states correspond to CPU idle states, except for C0, which is an operational state. In C3 the processor can be turned off and must be reset to carry out instruc-tions again, whereas C4 refers to the deeper sleep state. The higher the number, the less energy the processor consumes and the longer it takes to become active again. While keeping the processor idle for a long period can allow for power savings, it is necessary to reduce CPU wake-ups by disabling services and processes not strictly required. From the Linux kernel version 2.6.24, there is a new feature called Dy-namic ticks or tick-less kernel (NO HZ) which allows to wake up the processor only when required. This way, the processor is not woken up too often just to realize that there is no work to perform. Powernow! and Cool’n’Quiet technologies from AMD and Speedstep from INTEL implement the P-states. They can reduce voltage depending on the frequency and deactivate unused processor parts.
While DFVS techniques can save valuable amounts of energy, it should remain clear that reducing the CPU frequency increases the duration of computing tasks, and this phenomenon may increase the overall energy consumption if used insuit-ably. Moreover, only the dynamic part of the energy consumption can be reduced by DVFS, and this part can represent only a few percent contrary to the static part which is targeted by sleep state.
2.2.4 Software improvements. This section presents software improvements that reduce the energy consumed by computing resources. Nowadays, developers of drivers, kernel modules and distributed applications have to consider the implica-tions of their design decisions in energy consumption. For example, waiting loops and active polling may frequently wake up the CPU, which might waste electricity. Examples of applications that wake up the CPU hundreds of times per second and sometimes unnecessarily are listed on PowerTOP’s website.5
When concerning software, the Operating System (OS) is the first element to consider. OSs have heterogeneous power consumptions and can be optimized to consume less energy. Even different versions of the same OS do not present the same power consumption as illustrated by previous work that shows the power consumed by several Windows versions [EcoInfo 2011] and Linux kernels [LessWatts 2010]. The studies for Windows [EcoInfo 2011] and Linux [LessWatts 2010] have similar methodologies, and the consumption of a node under different versions of the considered OS presents non negligible variations depending on the used version. Moreover, an OS can regulate its activity and energy consumption to meet ther-mal or energy constraints, a task that is commonly performed through the standard ACPI [Steele 1998]. The Basic Input Output System (BIOS) – the very first soft-ware called when a system boots – is stored in an (EEP)ROM on the motherboard and contains a set of basic functions to initialize hardware, run diagnostics and search for bootable devices where the OS might be available. Although manu-facturers develop a BIOS for each motherboard they design, the default setup is generally used to support all the configurations (OS) and check for all the possible devices, thus wasting time and energy.
In a similar way, initializing the Universal Serial Bus (USB) host adapter takes time. HPC nodes often have several USB interfaces, most of which are hardly used. To reduce the time to boot, the majority of BIOS setups can disable USB ports and avoid their initialization. Moreover, USB ports frequently wake up the CPU even if they are not in use. These factors also concern other server components that are generally not used in data centers (e.g. RS-232 serial ports, bluetooth modules and wireless cards) and that could be disabled.
2.3 Grid and data center power management
This section describes techniques for power management that work at the scale of a data center or grid. Some of these techniques coordinate at a wide scale the node-level schemes described in the previous section.
2.3.1 Local or Green sources of electricity. The first way to save energy at a data center is to locate it close to where the electricity is generated, hence mini-mizing transmission losses. For example, Western North Carolina, USA, attracts data centers with its low electricity prices due to abundant capacity of coal and nuclear power following the departure of the region’s textile and furniture manu-facturing [Greenpeace 2011]. As of writing, this region has three super-sized data centers from Google, Apple and Facebook with respective power demands of 60 to 100 MW, 100 MW and 40 MW [Greenpeace 2011].
Other companies opt for greener sources of energy. For example, Quincy (Wash-ington, USA) supplies electricity to data facilities from Yahoo, Microsoft, Dell and Amazon with its low-cost hydroelectrics left behind following the shut down of the region’s aluminum industry [Greenpeace 2011]. Several renewable energy sources such as wind power, solar energy, hydro-power, bio-energy, geothermal power and marine power can be considered to power up super-sized facilities.
Another approach is to use free cooling which consists in using outside air [Pawlish and Varde 2010] to cool infrastructures. As cooling accounts for about 33% of the power used in a data center [Greenberg et al. 2008], this technique leads companies to locate their facilities in regions and countries with cold climate, such as Sweden6.
Another free cooling technique is to use sea water, such as in the new Google data center in Hamina, Finland7.
In spite of these innovative approaches, numerous data facilities have already been built and cannot move. Grid environments, on the other hand, can still take advantage of multiple locations to use green sources of energy with approaches such as follow-the-sun and follow-the-wind [Figuerola et al. 2009]. As sun and wind pro-vide renewable sources of energy whose capacity fluctuates over time, the rationale is to place computing jobs on resources using renewable energy, and migrate jobs as renewable energy becomes available on resources in other locations.
2.3.2 Thermal management. Thermal issues have been the first to be raised because they are the most direct consequences of increasing the number of tran-sistors on processor chips. These issues and energy consumption are interrelated
6“Safe, Green and Cool” http://www.investsweden.se/world/Industries/ICT/Data-centers/ 7
http://www.google.com/corporate/datacenter/efficient-computing/ efficient-data-centers.html
since decreasing the heat production will reduce energy consumption. For this rea-son several algorithms deal with both energy and thermal issues [Patel et al. 2002; Sharma et al. 2005; Merkel and Bellosa 2006].
An HP technical report [Patel et al. 2002] presents the typical case of an infras-tructure with a PUE of 1.5, meaning that cooling by itself consumes half the amount of power used by the computing resources. The authors present a solution, called thermal load balancing [Sharma et al. 2005], that takes advantage of the different clusters’ location in the Grid and assigns workload based on the thermal manage-ment infrastructure and the seasonal and diurnal variations of temperature [Patel et al. 2002]. It takes as example two sites of the same Grid, one located in New Delhi and another in Phoenix. During Summer, the external temperature in New Delhi reaches its peak at midday, at which time it is night in Phoenix where the temperature is lower. Hence, it is preferable to place the workload in Phoenix and use less cooling capacity than in New Delhi.
2.3.3 Workload consolidation. Workload consolidation [Chase and Doyle 2001; Chase et al. 2001], investigated in following works [Doyle et al. 2003; Urgaonkar et al. 2008; Verma et al. 2008; Kalyvianaki et al. 2009; Kusic et al. 2008; Jung et al. 2009; Srikantaiah et al. 2008], consists in running multiple tasks on the same physical machine in order to reduce the number of nodes that are switched on. A key component of these systems is to monitor and estimate the workload of the user applications or the arrival of user requests. Several techniques have been applied to estimate the load of a system, such as exponential moving averages [Box et al. 1994], Kalman filters [Kalman 1960], auto-regressive models, and combinations of methods [Kim and Noble 2001; Chase et al. 2001].
Fitted with workload-estimation techniques, Grid systems provide schemes to minimize the energy consumed by the underlying infrastructure while minimiz-ing costs and violations of Service Level Agreements (SLAs). Chase et al. [Chase et al. 2001] introduced MUSE, an economy-based system that allocates resources of hosting centers to services aiming to minimize energy consumption. Services bid for resources as a function of delivered performance whilst MUSE switches un-used servers off. Kalyvianaki et al. [Kalyvianaki et al. 2009] introduced autonomic resource provisioning using Kalman filters. Kusic et al. proposed a look-ahead control scheme for constantly optimizing the power efficiency of a virtualized en-vironment [Kusic et al. 2008]. With the goal of maximizing the profit yielded by the system while minimizing the power consumption and SLA violations, the pro-visioning problem is modeled as a sequential optimization under uncertainty and is solved using the look-ahead control scheme.
In some cases, consolidating workload on fewer nodes may increase the overall energy consumed by the platform if unused nodes are not switched off. Freeh et al. [Freeh et al. 2005] show that for some parallel applications, one can save energy and time by executing a program on more nodes at a slower speed rather than on fewer nodes at the fastest speed. Similarly, sometimes using the least power consuming state of processors is more energy consuming than exploring parallelism and as many processors as possible to complete an application faster [de Langen and Juurlink 2006]. Hence, parallelism should be implemented carefully.
with small tasks while they wait to synchronize with nodes with heavier load [Kap-piah et al. 2005]. As the middleware can influence the energy consumed by the plat-form as it maps users’ tasks and physical resources, it constitutes a great leverage to improve the energy efficiency of distributed systems. However, although workload consolidation techniques often rely on task scheduling algorithms, energy-efficient scheduling does not always aim at consolidating tasks on fewer nodes, as shown in the next subsection.
Moreover, for all on/off algorithms, an unnecessary wake-up wastes energy by creating spikes in power consumption when the node is woken up and put into sleep mode again. Such algorithms should thus be carefully designed in order not to shut down nodes unnecessarily [Lef`evre and Orgerie 2009].
2.3.4 Energy-aware task scheduling. A significant number of algorithms has been proposed for energy-aware scheduling. These algorithms differ on whether they are designed for divisible tasks [Chase et al. 2001] [Wang et al. 2010], whether they require synchronization [Jejurikar and Gupta 2006], if they use DVFS [Wang et al. 2010], or whether they work on homogeneous clusters [Mishra et al. 2003] [Yang et al. 2009]. Some complete energy efficient framework dealing with energy effi-ciency have been proposed (like the Green-Net framework [Da-Costa et al. 2010]). Energy aware task schedulers are generally classified into three categories [Zhuo and Chakrabarti 2008], namely: off-line scheduling based on a priori task infor-mation [Yao et al. 1995], on-line scheduling, which is purely dynamic [Kang and Ranka 2010; Zhuo and Chakrabarti 2008] and hybrid approaches including an off-line phase where the slack is greedily absorbed and dynamic algorithms operating in the online phase [He and Jia 2008; Shin and Kim 2004].
Chase and Doyle [Chase and Doyle 2001] attempt to minimize the number of joules per operation. Their resource manager gets a set of awake nodes and mini-mizes its size as much as possible. When a task on a node completes, the manager tries to move the other tasks from this node to the other running nodes. If a new task arrives, the manager tries to put it on the awake nodes, while the other nodes remain off. This algorithm does not include load balancing mechanisms, so some nodes may wore out prematurely while others remain unused.
Under certain scenarios, it is also possible to negotiate the performance degrada-tion with the user (mainly in terms of execudegrada-tion time) to save more energy. Such an approach is described in the work by Wang et al. [Wang et al. 2010] where users accept, for example, an increase of 10% in task execution time in order to reduce energy consumption.
Some task scheduling algorithms use DVFS techniques [Jejurikar and Gupta 2006; Snowdon et al. 2005; Fan et al. 2007], which allows for energy savings when the nodes are not fully utilized. DVFS can be used during the execution of non-critical tasks [Chen et al. 2005; Wang et al. 2010] or during communication phases of MPI applications [Lim et al. 2006]. In this case, the processor frequency is adjusted depending on the CPU utilization. Another solution is to use the user-perceived latency, the delay between user input and computer response, to drive voltage scaling [Yan et al. 2005].
As outlined by the variety of the proposed solutions, scheduling algorithms should be designed for the workload they have to manage (e.g. web servers, computing
jobs). For periodic real-time tasks, Aydi et al. prove that the optimal solution con-sists in using the CPUs at either full capacity or at the minimum speed if the uti-lization is under 100% [Aydi et al. 2001]. In addition to performance goals, energy-efficient job placement algorithms can take into account load balancing [Merkel and Bellosa 2006], thermal management [Patel et al. 2002; Sharma et al. 2005] and network connections [Chen et al. 2008].
2.4 Virtualization techniques
Clouds, already used by numerous companies, differ from Grids as explained by Buyya et al. [Buyya et al. 2009] and can be part of the next-generation data cen-ters with virtualized nodes and provisioning on demand. As of writing, Sales-force.com handles 54,000 companies and their 1.5 million employees using only 1,000 servers [Hamm 2009]. Different enterprises, such as IBM [Boss et al. 2007], also support and provide Cloud infrastructures and services to customer companies. Virtualization is a key feature of Clouds as it can improve the efficiency of large-scale distributed systems [Talaber et al. 2009]. It is now widely used to provide a large number of computing resources and minimize the energy consumption of Cloud infrastructures – an issue as urgent as the energy consumption of data centers and grids [Nathuji and Schwan 2007; Stoess et al. 2007; Talaber et al. 2009].
Even if virtualization adds a software layer that consumes energy [Torres et al. 2008], it allows for finer load consolidation on a virtualized node [Srikantaiah et al. 2008] and provides live migration techniques [Travostino et al. 2006] to strengthen load aggregation. However, these techniques have a cost [Orgerie et al. 2010] and should be carefully studied in order to reduce the overall consumption of Clouds.
This section details the energy gains of virtualization techniques at the Virtual Machine (VM) level, using VM migration techniques, and at the Cloud level.
2.4.1 Virtualization techniques. Virtualization brought along ideas on energy management [Talaber et al. 2009; Hermenier et al. 2006]. As nodes can be vir-tualized and host several virtual machines, virtualization can address some of the limitations in cooling and power delivery faced by large-scale distributed systems.
The overhead posed by VM technologies [Cherkasova and Gardner 2005] has decreased over the years, which has expanded their appeal for running high per-formance computing applications [Tatezono et al. 2006] and turned virtualization into a mainstream technology for managing and providing resources for a wide user community with heterogeneous software-stack requirements.
While the macro-level resource management performs actions that generally take into account the power consumption of a group of resources or the whole data center, at the host-level the power management is performed by configuring parameters of the hypervisor’s scheduler, such as throttling of Virtual CPUs (VCPU) and using other OS specific policies. In the proposed architectures, hosts generally run a local resource manager that is responsible for monitoring the power consumption of the host and optimizing it according to local policies. The power management capabilities available in virtualized hosts have been categorized as [Nathuji and Schwan 2007]: “soft” actions such as CPU idling and throttling; “hard” actions like DVFS; and consolidating in the hypervisor. CPU idling or soft states consist in changing resource allotments of VMs and attributes of the hypervisor’s scheduler
(e.g. number of credits in Xen’s credit scheduler) to reduce the CPU time allocated to a VM so that it consumes less power. Hard actions comprise techniques such as scaling the voltage and frequency of CPUs. Consolidation can also be performed at the host-level where the VCPUs allocated to VMs can be configured to share CPU cores, putting unused cores in idle state, hence saving the energy that would otherwise be used by the additional core to run a VM.
Nathuji and Schwan [Nathuji and Schwan 2007] presented VirtualPower, a power management system for virtualized environments that explores both hardware power scaling and software-based methods to control the power consumption of underly-ing platforms. VirtualPower exports a set of power states to VM guests that allow them to use and act upon these states thereby performing their own power man-agement policies. The soft states are intercepted by Xen hypervisor and mapped to changes in the underlying hardware such as CPU frequency scaling according to the virtual power management rules. The power management policies implemented in the guest VMs are used as “hints” by the hypervisor rather than executable com-mands. They also evaluate the power drawn by cores at different frequency/voltage levels and suggest that such technique be used along with soft schemes.
VM-based resource management systems such as Eucalyptus [Nurmi et al. 2008] and OpenNebula [Fontan et al. 2008], allow users to instantiate and customize clusters of virtual machines atop the underlying hardware infrastructure. When applied in a data center environment, virtualization can allow for impressive work-load consolidation. For instance, as Web applications usually present variable user population and time-variant workloads, virtualization can be employed to reduce the energy consumed by the data center environment through server consolidation whereby VMs running different workloads can share the same physical host.
2.4.2 Virtual Machines Migration. Virtualization needs powerful resource man-agement mechanisms [Grit et al. 2006] to benefit from migrating, pausing and re-suming VMs. The design of resource-management policies is challenging (NP-hard problem) and dynamic. Live migration [Clark et al. 2005] greatly improves the capacities and the features of Cloud environments: it facilitates fault management, load balancing, and low-level system maintenance. Migration implies more flexible resource management as virtual machines can move from one host to another. It offers a new stage of virtualization by removing the concept of locality in virtualized environments.
However, this technique is complex and more difficult to use over MAN/WAN [Travostino et al. 2006] than within a cluster. IP addressing is a problem since the system should change the address of the migrated virtual machine which does not remain in the same network domain. Moreover, it impacts the performance of VMs by adding a non negligible overhead [Voorsluys et al. 2009].
2.4.3 Cloud computing. Current Web applications demand highly flexible host-ing and resource provisionhost-ing solutions [Subramanyam et al. 2009]. The rishost-ing pop-ularity of social network Web sites, and the desire of current Internet users to store and share increasing amounts of information (e.g. pictures, movies, life-stories, virtual farms) have required scalable infrastructure. Benefiting from economies of scale and recent developments in Web technologies, data centers have emerged as
a key model to provision resources to Web applications and deal with their avail-ability and performance requirements. However, data centers are often provisioned to handle sporadic peak loads, which can result in low resource utilization [Iosup et al. 2006] and wastage of energy [Harizopoulos et al. 2009].
A Cloud computing environment can scale dynamically by allocating virtualized resources that are often provided as services over the Internet [Hayes 2008]. Clouds open up new horizons where anything is considered as a service (infrastructure, platform, software, computing, storage) and provide advantages such as cost and reliability. However, customers commonly worry about security and loss of sensitive data when using services from Cloud providers such as Amazon. Accounting is another key challenge as providers need to be competitive and remain economically viable.
The ever-increasing demand for cloud-based services does raise the alarming con-cern about the energy consumed by data centers. Recent reports [Patterson et al. 2007] indicate that energy consumption is becoming dominant in the Total Cost of Ownership (TCO). In 2005, data centers represented about 1 percent of the total world electricity consumption [Koomey 2011]. For most ICT companies, this con-sumption has increased: for instance, between 2005 and 2010, the electricity used by Google’s servers has more than double [Koomey 2011] leading to more carbon emissions. Electricity becomes the new limiting factor for deploying data center infrastructures.
A range of technologies can be utilized to make cloud computing infrastruc-tures more energy efficient, including better cooling technologies, temperature-aware scheduling [Moore et al. 2005; Fan et al. 2007; Patel et al. 2002], Dynamic Voltage and Frequency Scaling (DVFS) [Snowdon et al. 2005], and resource virtu-alization [Talaber et al. 2009]. The use of VMs [Barham et al. 2003] brings several benefits including environment and performance isolation; improved resource uti-lization by enabling workload consolidation; and resource provisioning on demand. Nevertheless, such technologies must be analyzed and used carefully for really im-proving the energy-efficiency of computing infrastructures [Miyoshi et al. 2002; Orgerie et al. 2010].
By consolidating the workload of user applications into fewer machines [Srikanta-iah et al. 2008], unused servers can potentially be switched off or put in low energy consumption modes [Lef`evre and Orgerie 2010]. Yet attracting virtualization is, its sole use does not guarantee reductions in energy consumption. Improving the en-ergy efficiency of Cloud environments with the aid of virtualization generally calls for devising mechanisms that adaptively provision applications with resources that match their workload demands and utilizes other power management technologies such as CPU throttling and dynamic reconfiguration; allowing unused resources to be freed or switched off.
Existing work has proposed architectures that benefit from virtualization for making data centers and Clouds more energy efficient. The problem of energy-efficient resource provisioning is commonly divided into two sub-problems [Liu et al. 2009]: at a micro or host level – discussed earlier – power management techniques are applied to minimize the number of resources used by applications and hence reduce the energy consumed by an individual host; and at a macro-level, generally
a Resource Management System (RMS) strives to enforce scheduling and workload consolidation policies that attempt to reduce the number of nodes required to han-dle the workloads of user applications or place applications in areas of a data center that would improve the effectiveness of the cooling system. Some of the techniques and information commonly investigated and applied at the macro or RMS-level to achieve workload consolidation and energy-efficient scheduling include:
—applications workload estimation; —the cost of adaptation actions;
—relocation and live-migration of virtual machines;
—information about server-racks, their configurations, energy consumption and thermal states;
—heat management or temperature-aware workload placement aiming for heat dis-tribution and cooling efficiency;
—study of application dependencies and creation of performance models; and —load balancing amongst computing sites.
Although consolidation fitted with load forecasting schemes can reduce the over-all number of resources used to serve user applications, the actions performed by RMSs to adapt the environment to match the application demands can require the relocation and reconfiguration of VMs. This can impact the response time of applications, consequently degrading the QoS perceived by end users. Hence, it is important to consider the costs and benefits of adaptation actions [Verma et al. 2008]. For example, Gueyoung et al. [Jung et al. 2009] have explored a cost-sensitive adaptation engine that weights the potential benefits of reconfiguration and their costs. A cost model for each application is built offline and to decide when and how to reconfigure the VMs, the adaptation engine estimates the cost of adaptation actions in terms of changes in the utility, which is a function of the application response time. The benefit of an action is given by the improvement in application response time and the period over which the system remains in the new configuration.
Moreover, consolidation raises the issue of dealing both with necessary redun-dancy and placement geo-diversity. Cloud providers such as Salesforce.com, who offer to host entire websites of private companies [Hamm 2009], do not want to lose entire websites due to power outages or network access failures. Hence, outages and blackouts should be anticipated and taken into account in resource manage-ment policies [Singh and Vara 2009].
We conclude this section by summarizing the existing approaches of energy ef-ficiency for computing resources (Table II). The categories presented in this table are the different research directions detailed in this section.
3. WIRED NETWORKING RESOURCES
The number of Internet users has increased 5 fold between 2000 and 20098. In less
than twenty years, the Web has become an essential means of communication for private companies, governments, institutions and other organizations.
Level Technology Existing work
Node
Sleep state [Chase et al. 2001] [Gunaratne et al.
2005] [Leangsuksun et al 2006]
DVFS [Snowdon et al. 2005] [Kappiah et al.
2005] [Wang et al. 2010] [Lim et al. 2006] [Chen et al. 2005] [Yan et al.
2005]
Software improvements [EcoInfo 2011] [LessWatts 2010]
[Steele 1998]
Hardware capabilities [Carrera et al. 2003]
Infrastructure
Green sources [Greenpeace 2011] [Figuerola et al.
2009]
Thermal management [Patel et al. 2002] [Sharma et al.
2005] [Merkel and Bellosa 2006]
Workload consolidation [Chase and Doyle 2001] [Doyle et al.
2003] [Urgaonkar et al. 2008] [Verma et al. 2008] [Kusic et al. 2008] [Jung et al. 2009] [Srikantaiah et al. 2008] [Freeh et al. 2005] [de Langen and
Juurlink 2006] [Lef`evre and Orgerie
2009]
Task scheduling [Jejurikar and Gupta 2006] [Mishra
et al. 2003] [Yang et al. 2009] [Zhuo and Chakrabarti 2008] [Yao et al. 1995] [He and Jia 2008] [Shin and Kim 2004] [Fan et al. 2007] [Aydi et al. 2001] [Merkel and Bellosa 2006]
[Chen et al. 2008] [Da-Costa et al. 2010]
Virtualized environments
Virtual machines [Nathuji and Schwan 2007] [Stoess
et al. 2007] [Talaber et al. 2009] [Torres et al. 2008] [Cherkasova and Gardner 2005] [Hermenier et al. 2006]
VM migration [Clark et al. 2005] [Travostino et al.
2006] [Voorsluys et al. 2009]
Cloud level [Nurmi et al. 2008] [Fontan et al.
2008] [Barham et al. 2003] [Miyoshi et al. 2002] [Liu et al. 2009] [Verma
et al. 2008] [Jung et al. 2009] [Lef`evre
and Orgerie 2010]
Table II. Classification of the work on energy-efficiency for computing resources
The ever-increasing number of Internet hosts calls for high performance end-to-end networks, which in turn increases the topology complexity, the number of core components to ensure performance and reliability, and consequently, the energy consumed by the networks [Baldi and Ofek 2009]. Bolla et al. [Bolla et al. 2011] forecast that the energy consumption of telecommunication networks will grow 2.5 times by 2018 compared to 2009.
Gupta and Singh [Gupta and Singh 2003], with coarse approximations, have stated that transmitting data through wired networks takes more energy (in bits per Joules) than transmitting it via wireless networks. Energy is indeed one of the main concerns of wireless networks, whereas it is often not the case of wired networks since they are not battery constrained. However, wireless networks are not renowned for their energy-efficiency, and thus, the fact that wired networks are not better is eloquent.
The energy issue is becoming more present in wired networks because of the need for maintaining network connectivity at all times [Christensen et al. 2004].
This rising energy demand can yet be greatly reduced. For example, studies have shown for a few years that network links, especially at the network edges, are lightly utilized [Christensen et al. 2004; Odlyzko 2003].
Moreover, the difference in terms of power consumption between an idle and a fully utilized Ethernet link is negligible [Gunaratne et al. 2005]. These observations have led researchers to propose several approaches to take advantage of link under-utilization and reduce the idle power consumption.
The energy consumption of networks is not only incurred by powering networking equipment (routers, switches, links, hubs, etc.), but also by end-hosts that demand high availability and full-time connectivity even if the network is not used.
Current research in energy conservation in wired networks aims to reduce the energy consumption of networking devices while guaranteeing the same Quality of Service (QoS) to users. This same-for-less approach is transparent to users whereas network managers, designers and providers should be aware of network usage and energy consumption in order to provide “green network” solutions.
Several methodologies can be used at the macro level with routing strategies and traffic aggregation and at the micro level with hardware improvements in NICs and switches, for example. However, interoperability and backward compatibility with existing protocols and products is generally a requirement.
3.1 Measuring and modeling the energy consumption
Similar to computing infrastructures, before being able to save energy with new technologies and mechanisms, researchers and designers need to know how energy is consumed by networking equipment. This preliminary analysis is key to understand how energy can be saved and to design energy models of networking equipment that will be used to validate new hardware components and new algorithms.
3.1.1 Estimating and modeling the energy consumed by networks. The Internet is this familiar network that encompasses thousands of private and public networks with different scales and functions, linked by various electronic and optical network-ing technologies. Due to its heterogeneity and to privacy and security constraints, the Internet’s topology and density are difficult to evaluate. As a result, precisely estimating the energy consumed by the Internet remains a challenge.
R. Bolla et al. have decomposed the Italian network [Bolla et al. 2011]. They forecast the power consumption for a typical network equipment by type of network, and the total number of such devices in the considered overall network (Table III from [Bolla et al. 2011]). This allows one to deduce the energy consumption of the overall network and the portion induced by each of its parts. Hence, a home network equipment is the least consuming, but is the most important contributor to the overall energy consumed by the network (79%) because of the large number of such devices. Therefore, reducing the energy consumption of the least consuming equipment can still represent a lot of energy due to the scaling effect. Similar results based on the topology of an Italian Internet Service Provider (ISP) are presented by Chiaraviglio et al. [Chiaraviglio et al. 2010].
Baliga et al. model the energy consumption of the Internet depending on the access rate [Baliga et al. 2007]. According to their results, with a peak access rate of 100 Mbps, the Internet accounts for 1% of the electricity consumed in broadband
power number of overall consumption devices consumption
(W) (GWh/year)
Home 10 17,500,000 1,533
Access 1,280 27,344 307
Metro/Transport 6,000 1,750 92
Core 10,000 175 15
Overall network consumption 1,947
Table III. 2015-2020 network forecast: device density and energy requirements in the business-as-usual case (BAU). Example based on the Italian network.
enabled countries; a consumption that can increase up to 4% under a peak access rate of 1 Gbps.
On the client-side, Bianzino et al. estimate the power consumption of end-user PCs while browsing the Web depending on the hardware platform, operating sys-tem, browser and website. They point out that tabbed browsing cause several scripts to run in parallel while users typically interact with only one tab at any given time, thus wasting energy.
The growth of optical-network usage reflects the increasing demand in band-width by new Internet applications (e.g. e-science applications). The energy con-sumption of optical networks is thus becoming an important issue. Bathula and Elmirghani [Bathula and Elmirghani 2009b] proposed a model expressing the en-ergy required to transmit an optical bit across a Wavelength Routed Node (WRN). Their basic assumption is that an optical network consumes energy in two cases: when transmitting a bit over fiber and when a WRN switches an optical signal. This model, which takes the bit error rate into account, is also applied to other work [Bathula and Elmirghani 2009a] with Optical Burst Switched (OBS) networks that allow the dynamic sub-wavelength switching of data.
Baliga et al. [Baliga et al. 2009] present a power consumption model for optical IP networks, which they extrapolate to estimate the energy consumed by the Internet. Similarly to the Internet, Optical IP networks are split into three main parts: the access network, the metropolitan and edge network, and the network core. The power consumption model is described as a function of the access rate to users, and so, the global network consumption is the sum of the per user power consumption for all the components in the network. Thus, this model relies greatly on traffic estimation. A representative example is taken for each type of equipment and the power consumption of this equipment under typical load is included in the model to compute the total network consumption.
Instead of studying the underlying network technology of backbones which are mainly optical networks [Zhang et al. 2010], Chiaraviglio et al. [Chiaraviglio et al. 2009] consider a real IP backbone network with real traffic generated by one of the largest ISPs in Italy. The ISP network is divided into four levels, namely: core, backbone, metro and feeder nodes. Even though core nodes are the most power consuming – as far as nodes are concerned – they represent less than 10% of the total energy consumption while feeders represent more than 65%, backbone nodes
account for 19% and metro nodes for around 6%. These values do not consider air conditioning, which commonly increases the power consumption by 40% to 60%.
Interconnection networks are another well studied type of network used to relay data and control traffic between computation and storage elements in parallel com-puter systems [Shang et al. 2006]. The energy consumption model presented by Soteriou et al. [Soteriou et al. 2005] for such network type is based on estimating the utilization of links and output buffers. Indeed, contrary to other technologies, in these networks, links are the dominant power consumers.
A holistic approach is presented by Kim et al. [Kim et al. 2005] where they present a power consumption model of the entire cluster interconnections based on energy profiles of the three major components: switches, NICs and links. This model leads them to propose energy-efficient designing techniques.
A consensual and commonly adopted way to represent a network topology is to model it as an undirected graph where the vertices are the nodes and the edges are the bidirectional links [Chiaraviglio et al. 2009; Hasan et al. 2010]. Each vertex and each edge has an associated power cost function with parameters varying using random theory. As the network topology is often unknown, random graph theory is used to generate graphs with particular properties that match the observed prop-erties of these networks. Random graph theory can also be used to estimate the number of devices that can eventually be powered off to save energy [Chiaraviglio et al. 2009].
3.1.2 Measuring and modeling the energy consumed by networking equipment. The most precise view of the energy consumed by wired networks is focused on network devices as it is possible to plug energy sensors at this small scale. Wired networks consist of several devices such as routers, switches, bridges, optical re-peaters, hubs, firewalls, links, coaxial cables, optical fibers and NICs.
Each type of equipment has its own characteristics (architecture and function-alities) and services. Thus, each of these devices presents an energy consumption that is influenced by various parameters such as equipment type, traffic, number of connected devices, manufacturer, number of switched-on interfaces (ports for routers and switches), used protocols and QoS services (which can add processing time if high level operations such as flow identification and packet inspecting are required) and energy saving modes. The following paragraphs describe models for different types of network devices: routers and switches. A router is a device that interconnects two or more networks and forwards data packets from one network to another (routing and forwarding tasks).
Several models have been proposed to describe the energy consumed by an equip-ment. For example, the energy consumed by routers has been studied in previous work [Shang et al. 2006; Wang et al. 2002; Chabarek et al. 2008] where different parameters are used to model the consumption. A general model for router power consumption depending on the number of active line cards has been proposed by Chabarek et al. [Chabarek et al. 2008]. This model is based on results from exper-iments with different line cards.
Shang et al. [Shang et al. 2006] take a different approach where the router ac-tions are broken up into 7 basic operaac-tions: input buffer write, routing decision, virtual-channel allocation, switch arbitration, input buffer read, switch traversal
and outgoing link traversal. Each operation dissipates dynamic power. Switch ar-bitration and allocation are not considered since they are negligible. Each of the remaining operations is detailed and mathematical formulas are provided for each power consumption. These models are integrated into their online power estimator embedded in each router in order to dynamically monitor local power consumption. Hence, these models replace an actual expensive wattmeter for each networking equipment. One can hope that such energy sensors will be directly included in future router architecture and will be available to router administrators.
The two previous power models are generic and can be applied to any router. Wang et al. [Wang et al. 2002] designed a power consumption model for CMOS (complementary metal-oxide-semiconductor) routers based on the switch capaci-tance and switching activity. To estimate the switch capacicapaci-tance, the model in-cludes FIFO buffers, crossbar switch and arbiters modeling, since these three com-ponents are the basic building blocks of routers. This model is then applied to two different commercial routers: the Alpha 21364 and the IBM 8-port 12X Infiniband router. The model validation is compared with success to designers’ estimates.
The crossbar switch is one of the possible switching fabric architectures. Switch fabrics are responsible for an important part of the router power consumption; 90% in the case of the IBM Infiniband router and 26-35% for the Alpha 21364 (input buffers contribute 46-61% of total power) [Wang et al. 2002]. Ye et al. [Ye et al. 2002] studied four widely-used switch fabrics, namely crossbar, fully-connected, Banyan and Batcher-Banyan. The authors show that the fully connected switch has the lowest power consumption, and that the relation between power consumption and traffic throughput is almost linear for the crossbar, the fully-connected and the Batcher-Banyan networks.
A switch, commonly viewed as a layer 2 equipment in the OSI model, connects network segments in LANs. Quantitative models of energy consumption in sev-eral optical switching devices are provided by Tucker [Tucker 2010]. These models decompose the device’s consumption into the consumption of its hardware com-ponents (e.g. power supply and transistors). The author studies two classes of switches: linear analog switches which pass the input signal to the appropriate out-put without altering the waveform of the signal, and digital switches that operate at the bit level and generally incorporate highly nonlinear and logic devices.
Hlavacs et al. [Hlavacs et al. 2009] use linear regression to model the relation be-tween the measured power consumption and the injected traffic in typical residen-tial and professional switches. Some results are surprising: the Netgear residenresiden-tial switch (Netgear FS608v2, 8 ports) consumes less energy under high bandwidth val-ues, and the 3Com professional switch (3Com 3824, 24 ports) achieves the optimum ratio between energy consumption and bandwidth when operating between 100 and 1000 kbit/s. As a conclusion, they show that energy consumption and bandwidth are linked, but that the dependence is quite small and not linear.
This heterogeneous behavior has led Mahadevan et al. to propose a benchmark-ing framework to compare the power characteristics of a variety of network devices (routers and switches) [Mahadevan et al. 2009]. The power model for each equip-ment is based on the base chassis power, the number of linecards, the number of active ports, the port capacity, the port utilization, the Ternary Content
Address-able Memory (TCAM) and the firmware. This benchmarking framework is Address-able to predict the power consumed by different switches currently used in data centers within a 2% error margin.
As we go from core networks to access networks, the bandwidth capacity and number of components per equipment decrease, but the number of deployed equip-ment increases. As both the number of network devices and their bandwidth ca-pacity affect the energy consumption, possible energy savings are greater at both core and access levels. In fact, in 2000 in U.S. [Gupta and Singh 2003], 95,000 LAN switches were deployed consuming 3.2 TeraWatt hours per year; and 3,257 routers were deployed consuming 1.1 TeraWatt hours per year.
However, when no empirical measurements of energy consumption are available for a given network equipment, researchers use generic mathematical models to eval-uate their algorithms and frameworks. Such models express the relation between traffic load and energy consumption with simple functions, including linear, cubic, logarithmic, step functions [Restrepo et al. 2009]. These energy profiles may not be realistic [Mahadevan et al. 2009] as they represent an ideal situation, a scenario where the power consumed is proportional to the load. Such a proportional model is often used and referred to as the power consumption model for future networking equipment [Mahadevan et al. 2009].
Several models have been proposed for the different network components [Wang et al. 2002; Ananthanarayanan and Katz 2008; Shang et al. 2006], for different types of networks [Baliga et al. 2009; Chiaraviglio et al. 2009; Baliga et al. 2008], and for the whole Internet [Baldi and Ofek 2009; Baliga et al. 2007; Chiaraviglio et al. 2009]. Combined with real energy measurements, they allow researchers to validate their new frameworks and algorithms. As for computing resources, energy-efficient techniques targeting networking resources can be divided into different levels from hardware optimizations to network-wide solutions. The following sections describe these techniques starting from low-level optimizations.
3.2 Hardware and low-level optimizations
A way to reduce the energy consumption of a network is to increase the efficiency of its components. For that reason manufacturers of network equipment are constantly proposing green routers and switches [Ananthanarayanan and Katz 2008]. D-Link, Cisco, Netgear are among the manufacturers proposing new green functionalities in their products such as adapting the power transmission to the link length and to the load, power off buttons, and more energy efficient power supplies.
These new products come often as result of green initiatives (e.g. GreenTouch9, GreenStar Network10 and the Energy Consumption Rating initiative11) and study
groups (e.g. IEEE 802.3 Energy Efficient Ethernet Study Group) which aim to standardize and to enforce new regulations in terms of energy consumption for network equipment.
As result of these initiatives, several hardware solutions have been proposed, from improving hardware capabilities (e.g. power saving by cable length, smart
9
http://greentouch.org 10
http://greenstarnetwork.com 11http://www.ecrinitiative.org/
cooling FAN, disk spin down and DVFS) to new functionalities (e.g. power on/off button, low power mode, port auto power down). Power saving according to a cable length is similar to the power saving modes of wireless equipment that adjust their radio range according to the distance of their neighbors. The specifications of typical Ethernet twisted-pair cables precise a maximum length of 100 meters. Hence, router and switch ports are basically set for the maximal cable length, but at homes and enterprise environments, they are most commonly used with cables measuring a couple of meters.
Networking equipment can also benefit from low-level improvements coming from research on energy-efficient computing resources [Gupta and Singh 2007b] such as disk spin down and DVFS presented in Section 2. Power on/off buttons enable home equipment to be manually switched off when they are not used. Wake-On-LAN techniques allow them to be switched on and off remotely.
When ports are not used at their full capacity, they can be put in low power modes and when they are not used at all (no plugged link), they can be automatically powered down. This latter improvement is based on sleeping methods detailed in the next section. Hardware optimizations also include re-engineering the network component to use more energy-efficient technologies and to reduce the complexity of current devices [Roberts 2009].
3.3 Shutdown: sleeping methods
As discussed earlier, network links – especially those at the edges of a network – are lightly utilized [Christensen et al. 2004; Odlyzko 2003]. Therefore, in order to save energy researchers have proposed techniques that switch off network equipment (i.e. put them into sleep mode) when they are not used [Gupta and Singh 2003; Chiaraviglio et al. 2008]. Despite its benefits, this technique raises several problems including connectivity loss and long re-synchronization periods. In addition, con-stantly switching network devices off and on can be more energy consuming than keeping them on all the time.
New mechanisms have been designed to address these issues. Examples of mech-anisms include proxying techniques to maintain connectivity [Nordman and Chris-tensen 2010] and to quickly re-synchronized both ends of a link [Gupta and Singh 2007a]. Here we first review the main techniques and algorithms for switching off network components. Then, we describe proxying techniques to enable longer switching-off periods.
3.3.1 On/off and sleeping techniques and frameworks. A seminal work dealing with on/off approaches was performed by Gupta and Singh [Gupta and Singh 2003], where they proposed two solutions to reduce energy wastage: 1) to switch off net-work interfaces of LAN switches during packet inter-arrival times, which requires to extend the interface’s memory buffers to minimize packet loss; 2) to modify routing protocols in order to aggregate all traffic going through parallel routes into one route during low-traffic periods and thus, to enable unused network links to be switched off.
The first solution, uncoordinated and passive, takes advantage of periods without traffic, whereas the second, coordinated and active, tries to increase these periods. Therefore, the first solution requires to improve low-level capabilities, whereas the
second deals with the control plane. These approaches are not straightforward since the network presence of sleeping elements should be maintained. According to the experiments performed by Gupta and Singh [Gupta and Singh 2007b], links of an on-campus backbone switch can be powered off from 40% to more than 80% of the time.
Observing that current network devices do not have power management primi-tives, Bolla et al. [Bolla et al. 2011] proposed standby primitives (sleeping mode) for backbone devices using virtualization capabilities of layer 2 protocols (mainly rep-resented by MPLS and Ethernet) and completely transparent to layer 3 protocols (such as IP). A network node is devoted to collecting traffic load information from routers, applying necessary reconfigurations, and switching elements on and off to meet QoS constraints12. This solution also requires periodic wake-ups of sleeping hardware for failure detections.
Hu et al. [Hu et al. 2011] proposed reconfigurable routers to deal with traffic and route aggregation and management of routers under sleeping states. Dynamic Ethernet Link Shutdown (DELS), presented by Gupta and Singh [Gupta and Singh 2007a], takes sleeping decisions based on buffer occupancy, the behavior of previous packet arrival times and a configurable maximum bounded delay.
The problem of finding the minimum set of nodes and links to be powered on while guaranteeing full connectivity and maximum link utilization is NP-hard and has been modeled by Chiaraviglio et al. [Chiaraviglio et al. 2008]. This problem is also studied by Yamanaka et al. [Yamanaka et al. 2010] with different QoS constraints (hop limit, bandwidth limit reliability and stability). Numerous heuristics have been proposed to solve it [Gupta and Singh 2007a; Nedevschi et al. 2008; Soteriou and Peh 2003; Chiaraviglio et al. 2008; 2009; Restrepo et al. 2009], but most do not consider some practical problems of the on/off approach: switching on and off requires time, it leads to a network reconfiguration because of topology change, and a wake-up method is required to determine how and when nodes and links should be switched on again. To solve the latter problem, several solutions can be envisaged such as a periodic wake-up [Nedevschi et al. 2008], an automatic wake-up on sensing incoming traffic [Gupta and Singh 2003], or a “dummy” packet sent to wake up a neighboring node [Gupta et al. 2004].
Instead of a sleeping mode, the IEEE 802.3az task group13 proposes Low Power
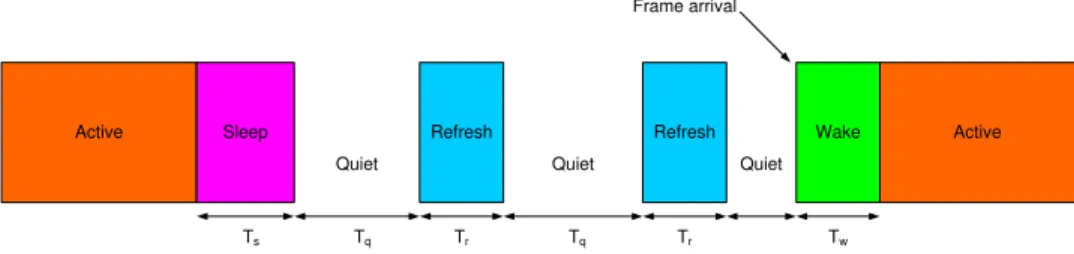
Idle (LPI) [Christensen et al. 2010], a standard that has been adopted in September 2010 [Reviriego et al. 2011]. The basic idea – to transmit data as fast as possible to spend as much time as possible in low power idle mode – is based on the fol-lowing principles: the highest rate provides the most energy-efficient transmission (in Joules/bit) and the LPI mode consumes minimal power. The LPI transition is initiated by the transmitter. Then, a periodical refreshment is done to detect fail-ures and facilitate fast transition. Transmissions are deferred to pre-defined time as shown in Figure 2 presented in [Reviriego et al. 2010].
Tsis sleep time (the time needed to enter sleep mode); Tw is wake-up time (the
12QoS described in terms of maximum link utilization and backup availability while allowing the largest number of line cards to sleep
13The IEEE 802.3az (Energy Efficient Ethernet) task group develops standards for reducing power consumption of Ethernet devices (http://www.ieee802.org/3/az/public/index.html).
Active Sleep Refresh Refresh Wake Active Quiet Quiet Quiet
Ts Tq Tr Tq Tr Tw
Frame arrival
Fig. 2. Transitions between the active and sleep modes in Energy-Efficient Ethernet.
time required to exit sleep mode). The transceiver spends Tq in the quiet
(energy-saving) period but also has short periods of activity (Tr) to refresh the receiver
state. Currently, LPI seems the most promising solution at the NIC level to save energy. The first NICs enabling this green functionality have been commercialized at the end of 2011.
3.3.2 Proxying techniques. In 1998, a study showed that PCs are generally pow-ered on even when they are not in use; an observation that has led Irish & Chris-tensen [Irish et al. 1998] to look for a solution consisting in completely powering off PCs during idle periods. Even though powering off network components such as links or switches is not yet commonplace, switching off PCs include powering off their NICs, and thus dealing with loss of network connectivity.
A way to address these issues is to use a proxy to answer to non-urgent messages on behalf of a node and to wake-up the node when required. This solution, detailed in existing work [Christensen et al. 2004; Gunaratne et al. 2005; Jimeno et al. 2008], is based on a Network Connectivity Proxy (NCP) that handles network presence requests such as ARP, ICMP and DHCP, and keeps connections alive. This proxy solution can be implemented in the NICs themselves as proposed by Sabhanatara-jan et al. [SabhanataraSabhanatara-jan et al. 2008]. Agarwal et al. proposed an improved NIC that answers to network requests while the node is in suspend-to-RAM state [Agar-wal et al. 2009]. Another approach illustrated by Agar[Agar-wal et al. [Agar[Agar-wal et al. 2010] is to use dedicated on-demand proxy servers.
Taking advantage of low link utilization and path redundancy, the shutdown approach uses idle periods in network traffic. Energy savings can also be made during low-demand period with the slowdown approach.
3.4 Slowdown: adapting to the needs
The difference in power consumption between an idle and a fully utilized Ethernet link is negligible [Gunaratne et al. 2005]. To keep communicating NICs synchro-nized, idle bit patterns are continuously transmitted even when no actual data is sent. As a consequence, the power consumption levels of non-energy aware equip-ment are the same when idle and transmitting. An exception are the 1000BASE-T specifications, designed to operate at 10 Mb/s, 100 Mb/s and 1 Gb/s in order to keep backward compatibility with previous specifications. It has been observed that running Ethernet links at lower data rates decreases the power consumption of NICs and switches [Zhang et al. 2008].