HAL Id: hal-01611608
https://hal.archives-ouvertes.fr/hal-01611608
Submitted on 7 Nov 2018
HAL is a multi-disciplinary open access
archive for the deposit and dissemination of
sci-entific research documents, whether they are
pub-lished or not. The documents may come from
teaching and research institutions in France or
abroad, or from public or private research centers.
L’archive ouverte pluridisciplinaire HAL, est
destinée au dépôt et à la diffusion de documents
scientifiques de niveau recherche, publiés ou non,
émanant des établissements d’enseignement et de
recherche français ou étrangers, des laboratoires
publics ou privés.
Effect of local stress on the heat-checking morphology in
high temperature tool steels under thermal fatigue:
Transition from multi-axiality to uniaxiality
Farid Medjedoub, Sabine Le Roux, Gilles Dour, Farhad Rezai-Aria
To cite this version:
Farid Medjedoub, Sabine Le Roux, Gilles Dour, Farhad Rezai-Aria.
Effect of local stress on
the heat-checking morphology in high temperature tool steels under thermal fatigue: Transition
from multi-axiality to uniaxiality.
Mechanics of Materials, Elsevier, 2014, 69 (1), p.
159-172.
�10.1016/j.mechmat.2013.09.014�. �hal-01611608�
Effect of local stress on the heat-checking morphology in high
temperature tool steels under thermal fatigue: Transition from
multi-axiality to uniaxiality
F. Medjedoub , S. Le Roux, G. Dour , F. Rézaï-Aria
Université de Toulouse, Mines Albi, INSA, UPS, ISAE, ICA (Institut Clément Ader), Campus Jarlard, F-81013 Albi Cedex 09, France
Keywords: Thermal fatigue Crack network Heat-checking Hot work tool steel Finite element method Die casting
a b s t r a c t
Thermal fatigue experiments are performed on a high temperature tool steel X38CrMoV5 (AISI H11), under various maximum temperatures and heating rates. A microscopic inter-connected crack pattern (named ‘‘heat-checking’’) forms on the oxidised surface of the lab-oratory tubular specimen. A gradual transition is observed, from a ‘‘cell-type’’ cracking at the centre of the specimen to a ‘‘parallel cracking’’ at its extremities. This variation of the morphology is well demonstrated by geometrical and topological characteristics of the crack network (micro-crack orientations, cell shape and node density), which change along the longitudinal axis of the specimen. The thermo-elasto-plastic loading of the spec-imen is estimated by Finite Element Calculations using ABAQUS™. Whatever the thermal fatigue conditions, a linear correlation can be established between the longitudinal and hoop stress amplitude ratioDrzz/Drhhand the hoop and longitudinal inter-crack spacing
ratio dhh/dzz. It is shown that a stress amplitude ratio close to 1 results in a multi-axial
heat-checking, while a uni-axial cracking is generated whenDrzz/Drhhis close to or below
0.6. This means that the morphology of the heat-checking pattern (cell or parallel type) can be used as an indicator for the local stress ratio of the thermal fatigue specimen or indus-trial real tools.
1. Introduction
‘‘Heat checking’’ is one of the main damage mechanisms that is observed on the surface of a piece of material under thermal cycling or thermal fatigue, such as in die casting and forging applications (Miquel et al., 2002; Srivastava et al., 2004; Persson et al., 2005; Le Roux et al., 2013a). Multi-directional crack patterns, forming polygonal cells, are generated on bi- and multi-layered materials (like oxide films, coating or thermo-chemical diffusion layers deposited on a ductile substrate), experiencing thermal
gradients or (thermo-)mechanical loadings. This through-scale micro-cracking is generally caused by (cyclic) stres-ses and strains acting on the surface, due to the thermal expansion mismatch between the superficial layer and the substrate (Persson et al., 2005; Le Roux et al., 2013a; Evans and Hutchinson, 1995), and/or the difference in heat diffusivity between layers in a multi-material (Dour et al., 2008). Several studies have reported the fragmentation of brittle coatings and layers, resulting of thermally induced residual stresses during a high-temperature coating pro-cess (CVD, PVD, plasma spraying, etc.) (Evans et al., 1983; Hirsch and Mayr, 1988; Kung, 1990; Teixeira, 2001). A sim-ilar multi-directional inter-connected network is formed when a multi-axial mechanical loading is applied to the substrate (Andersons et al., 2003), such as the hexagonal crack pattern (called ‘‘island-delamination’’) reported in ceramic films plasma-sprayed on a ductile specimen
⇑Corresponding author. Tel.: +33 563493082; fax: +33 563493099. E-mail address:rezai@mines-albi.fr(F. Rézaï-Aria).
1 Present address: Airbus France, Site de Saint Martin du Touch, 316
Route de Bayonne, F-31060 Toulouse Cedex 9, France.
2 Present address: NOPSEMA, Level 08 Alluvion Bld, 58 Mounts Bay Road,
submitted to equi-biaxial tensile tests (Nakasa et al., 1998). On the opposite, when a layered material is subjected to a uniaxial loading (e.g. tension or bending), a network of par-allel cracks can form perpendicular to the loading direc-tion. As an example, such cracking was observed in a ceramic coating deposited on a stainless steel sample sub-jected to tensile strain (Chen et al., 1999), and also in oxide films grown on metallic substrates subjected to high tem-perature bending (Bernard et al., 2002).
The local distribution of thermo-mechanical stresses therefore appears to be the main driving force generating either a ‘‘cell-type’’ cracking under a multi-axial (or at least bi-axial) loading, or a ‘‘parallel-type’’ cracking in the case of a uniaxial loading. In thermal fatigue, the role of the dom-inant local stress/strain state on the crack pattern has not been clearly demonstrated. Miquel et al. (2002) assumed that there is a link between the longitudinal/hoop stress ratio and the direction of micro-cracks and, consequently, the shape of the heat-checking cells. Indeed, as the labora-tory experiments are generally conducted on finite speci-mens, the local stress and strain state can change near the free ends. The knowledge or direct measurement of stress and strain distribution in an oxide layer or a depos-ited coating is not straightforward, especially when the thickness of the layer is negligible compared to the dimen-sion of the specimen (Bernard et al., 2002). Although mod-els of mechanical behaviour of oxide layers exist in the literature, especially for thermal barrier coating (TBC) sys-tems (Teixeira, 2001; Schütze, 1994; Miller, 1984; Freborg
et al., 1998; He et al., 2003; Gao et al., 2003; Xie and Tong, 2005), it requires the determination of mechanical proper-ties of the layer (e.g. density, thermal expansion coeffi-cient, heat-conductivity, specific heat, Young’s modulus, Poisson’s ratio, etc. . . .). In addition, the oxidation kinetics and morphological evolution of the oxide scale during thermal cycling (formation of new oxide phases, etc.. . .) are difficult to incorporate into a thermo-mechanical behaviour model. Therefore, for the sake of simplification, the authors (Miquel et al., 2002; Le Roux et al., 2013a) have considered that the thermo-mechanical loading of the sub-strate material can represent the stress/strain state in the oxide layer.
In industrial forming processes, and especially in High-Pressure Die Casting (HPDC) or Hot Stamping, the tools are experiencing thermal fluctuations in service, which result in transient thermal gradients and subsequent thermal stresses and strains. Depending upon the amplitude of the solicitation, thermo-plastic or thermo-visco-plastic yielding can occur and lead to crack initiation and propaga-tion under non-isothermal fatigue condipropaga-tions. On planar surfaces subjected to multi-axial loading, an intercon-nected heat-checking network is generally formed, while a network of parallel cracks is observed near geometrical singularities (such as corners and holes), where a uniaxial fatigue state prevails.
The purpose of the present paper is to reproduce, un-der thermal fatigue (TF) laboratory experiments, these various heat-checking morphologies, by using a hollow Nomenclature
a system constant of Aboav–Weaire’s law hA(n)i average area of a n-sided cell (Lewis’ law) b constant of the linear regression
dn density of nodes (number of crack junctions per unit area)
dzz, dhh inter-crack spacing along the longitudinal (‘‘zz’’) and hoop (‘‘hh’’) axes
dzz/dhh ratio of longitudinal and circumferential inter-crack spacing
D distance from the centre of the specimen along the longitudinal axis
E Young’s modulus
h heat-transfer coefficient
ht heating period of the thermal cycle j crack junction class
k slope of the linear regression
m(n) average number of first neighbours of the neighbouring cells of n-sided cells (Aboav– Weaire’s law)
n, hni number and average number of first neighbours of the heat-checking cells
N number of thermal cycles
P(j) frequency distribution of the crack junction classes
P(b) frequency distribution of angles between the radiating branches from a node
R determination coefficient of linear regression
t time
T temperature
Tmin, Tmax minimum and maximum temperature of the thermal cycle
zz longitudinal axis of the specimen
a
coefficient of thermal expansionb angle between the radiating branches from a crack junction
e
e,e
pl elastic and plastic straine
m mechanical straine
t total straine
th thermal strainl
2 variance of the distribution of the first neigh-bours of the heat-checking cells (Aboav– Weaire’s law)hh circumferential axis of the specimen
r
min,r
max minimum and maximum stressr
zz,r
hh stress in the longitudinal and the hoop direction DT temperature amplitudeD
r
stress amplitudeD
r
zz/Dr
hh ratio of longitudinal and hoop stress ampli-tudesD
e
strain amplitudeU, Umax heat-flux density and maximum heat-flux den-sity
cylindrical shaped specimen of X38CrMoV5 steel. It was previously reported that the density of the microscopic crack network, formed in the central ‘‘gauge area’’ on the oxidised surface of the TF specimen, was strongly dependent on TF test conditions. Heat-checking cells of smaller sizes were produced by increasing the heating rate of the thermal cycle, and the saturated heat-checking density (or the cell mean area) was linearly related to the maximum heat-flux density applied to the specimen (Le Roux et al., 2013a). Based on temperature–time measure-ments and adimensional analytical calculations (Dour et al., 2005), the initial input heat conditions are esti-mated and thermo-mechanical stress and strain calcula-tions are undertaken using the ABAQUS™ software. The FEM analysis was applied to establish a correlation be-tween the ratio of longitudinal and hoop stress amplitude and the shape of the heat-checking cells. It is proposed to use the morphology of the crack pattern as an indicator of the local stress and strain state, in order to better monitor the thermomechanical loading of real components or tools in service.
2. Thermal fatigue experiments
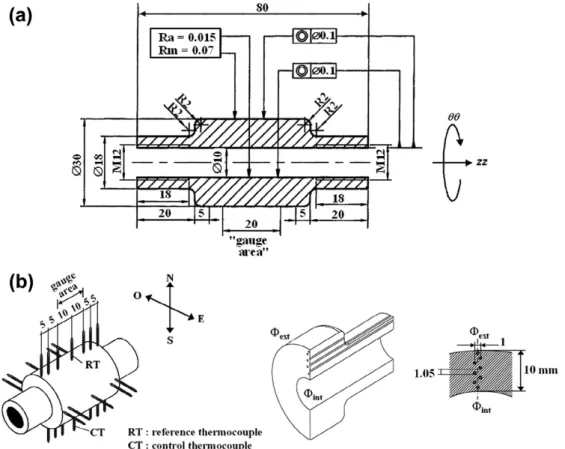
Thermal fatigue (TF) tests are performed on a X38CrMoV5 (AISI H11) tool steel, quenched and double tempered to achieve a martensitic structure with either 42 or 47 HRC hardness. The hollow cylindrical shaped specimens, with an inner diameter of 10 mm and an outer diameter of 30 mm, present a wall thickness of 10 mm in
the study portion of 40 mm length (Fig. 1a). The external surface is mechanically polished to a mean arithmetic roughness (Ra) close to 0.02
l
m. The TF rig consists of an induction heating system, using a CELES-25 kW high fre-quency generator. The induction frefre-quency is 115 kHz, resulting in a very fast heating of a thin surface layer of the specimen due to the skin effect. The external surface is air-cooled by natural convection. During the test, the specimen is continuously cooled by cold water at 20!C cir-culating through the internal hole of the specimen with a flow rate of 20 l/min. The temperature of the specimen is measured by a K-type thermocouple, spot-welded to the external surface (Le Roux et al., 2013a).Various thermal cycles are investigated, with a minimal temperature (Tmin) fixed to 100!C, while the maximum temperature (Tmax) is varied from 550 to 685!C (Table 1). The tests with Tmax= 650!C are performed with different mean heating rates (17!C s!1< hr < 30!C s!1) and conse-quently different maximum heat-flux density (2.13 MW m!2< U
max< 4.95 MW m!2) at the surface of the specimen, leading to various heating times (1.2 s < ht < 6.5 s). The thermal cycle with Tmax= 650!C and ht = 1.2 s, which has previously been the subject of a detailed investigation (Le Roux et al., 2013b), will be con-sidered here as the ‘‘reference TF test’’. The temperature– time curves of all thermal cycles are reported in (Le Roux et al., 2013a). TF experiments are regularly interrupted, in order to observe the superficial cracking patterns by scanning electron microscopy (SEM). Several cartographies are acquired along the longitudinal (‘‘zz’’) axis of the specimen, at various distances D from the centre of the
Fig. 1. (a) Geometry of the TF specimen; (b) instrumented dummy specimen with 28 K-thermocouples spot-welded on the external surface and eight thermocouples brazed in depth.
specimen (D = 0, 5, 10, 12, 13, 14 and 15 mm). Then, the morphological and topological characteristics of crack pat-terns are quantified using the commercial image analysis Aphelion"software, according to a procedure fully detailed inLe Roux et al. (2013a).
3. Thermo-mechanical analysis 3.1. Thermal measurements
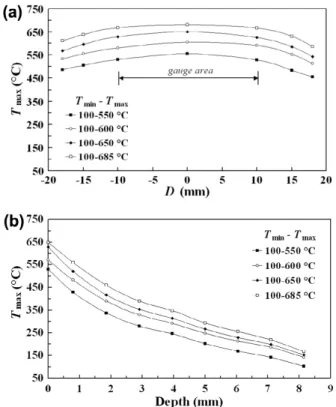
A dummy tubular specimen is carefully instrumented by several K-type thermocouples (Fig. 1b). Four series of seven thermocouples, with a wire diameter of 0.1 mm, are spot-welded on the external surface at different dis-tances from the centre of the specimen along the longitu-dinal direction. Eight sheathed thermocouples with a wire diameter of 0.2 mm are brazed in tapped holes, lo-cated from 0.8 to 8.15 mm in the depth of the specimen, in the ‘‘gauge area’’ (Medjedoub, 2004). Temperature–time data is monitored and recorded for all investigated TF con-ditions. The cold junction of all thermocouples is carefully controlled in an isothermal box, where the temperature is measured with a resistance temperature detector (RTD) for an enhanced accuracy. The temperature variations mea-sured on the surface and in the depth of the specimen are shown inFig. 2a and b, respectively. A thermal gradient lower than 1!C/mm is obtained in the ‘‘gauge area’’ (cen-tral region) of the specimen (Fig. 1a), corresponding to a temperature variation of maximum 10!C within this area of 20 mm in length, at all times (Medjedoub, 2004). 3.2. Thermo-mechanical analysis
Thermo-elasto-plastic strains and stresses are calculated with the ABAQUS™ software. As TF tubular specimens are axi-symmetric, only a quarter of the structure is meshed. Axi-symmetric ‘‘DCAX4’’ and ‘‘CAX4’’ elements are used, for thermal and mechanical analysis respectively (Medjedoub, 2004). The size of elements is refined to 15
l
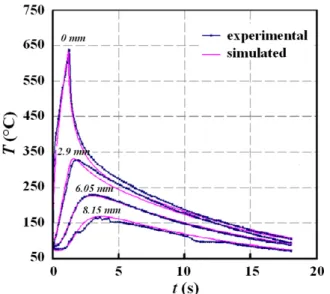
m over 1 mm in depth from the external surface. First, a thermal analysis is undertaken. A heat-flux density is imposed to external nodes as boundary conditions. For the external elements, radiation is considered during the heating period, with an emissivity coefficient of 0.88. A heat-transfer coefficient (he= 20 W m!2K!1) is imposed during the cooling period. For the internal surface, aconstant heat-transfer coefficient hiis applied, whose value is drawn from an empirical analysis based on Nusselt num-ber (Medjedoub, 2004). via a new normalised approach, the initial heat-flux densities along the external surface of the tubular TF specimen were estimated (Dour et al., 2005, 2008). The specimen is divided in several strips. A specific heat-flux density (U) is imposed to meshes of each strip. To better consider the thermal gradient along the longitudi-nal zz-axis, several values of U were estimated. Then, U is optimised for each region, by minimizing the mean square root of the difference between estimated and measured temperatures for the whole temperature–time (T–t) cycles. The difference between the temperature–time curves mea-sured and simulated is less than 10 % (Fig. 3). It was ob-served that the adimensional calculation is a reliable
Table 1
Thermal fatigue tests performed on 47 HRC treated X38CrMoV5 steels (test No 3, in bold, is considered as the reference test). No
test
Thermal cycle Heating period Maximum heat-flux density
Umax(MW m!2)
Cooling period Total number of TF cycles Tmin! Tmax (!C) DT(!C) Duration ht(s) Mean rate hr (!C s!1) Duration ct(s) Mean rate cr (!C s!1) 1 100–575 475 0.95 500 4.84 14.8 32 50,000 2 100–600 500 1.0 500 4.85 15.0 33 60,000 3a 100–650 550 1.2 458 4.95 17.0 32 20,000 4 100–650 550 2.0 275 3.93 20.0 28 30,000 5 100–650 550 3.7 149 2.78 22.0 25 30,000 6 100–650 550 6.5 85 2.13 30.0 18 50,000 7a 100–685 585 1.6 366 4.75 22.0 27 3000
a Tests also performed on 42 HRC heat-treated specimens.
Fig. 2. Temperature variation measured on the instrumented TF speci-men for various thermal cycles: (a) on the external surface along the longitudinal zz-axis of the specimen (D = 0 mm at the centre, D = ±18 mm at the extremities); (b) in depth from the surface along rr-axis, at the centre of the specimen (D = 0 mm).
method to estimate the initial heat-flux density with acceptable accuracy (Dour et al., 2005).
For the thermo-mechanical analysis, the specimen is considered as totally unconstrained. According to the ABA-QUS™ procedures, the elasto-plastic tensile curves at dif-ferent temperatures are introduced point per point, considering an isotropic plastic strain-hardening. These data are obtained from monotonic tensile tests performed on the investigated steel at various temperatures ranging from 25 to 700!C. For the sake of simplification, the fol-lowing equations are given for a uniaxial condition. The mechanical strain (
e
m) is defined as the sum of the elastic (e
e) and plastic (e
pl) strain components, while the total strain (e
t) is the sum of thermal (e
th) and mechanical (e
m) strain components:e
mðTÞ ¼e
eðTÞ þe
plðTÞ ¼e
tðTÞ !e
thðTÞ; ð1Þwith
e
eðTÞ ¼r
ðTÞ=EðTÞ; ð2Þand
e
thðTÞ ¼a
ðTÞ &DT ¼a
ðTÞ:ðT ! TminÞ: ð3Þ 3.3. Stress–strain hysteresis loopsAs an example, a typical mechanical stress–strain hys-teresis loop, showing the variation of the circumferential stress (
r
hh) vs. the circumferential mechanical strain (e
m,hh) for an element of the external surface located in the mid-plane of the specimen, is illustrated in Fig. 4for the first and second stabilized cycles. The stabilized stress–strain hysteresis loop indicates that the maximum tensile stress is achieved at the minimum temperature (Tmin) of the TF cycle (i.e. at the end of the cooling phase), whereas the maximum compressive stress corresponds to the maxi-mum temperature Tmax(end of the heating phase). It can be also noted that the plastic strain in the first heating cycle is larger than that observed in the subsequent cycles.Fig. 5a shows the effect of Tmaxon
r
hhande
m,hhin the cen-tre of the specimen, for a similar heat-flux density (Umax= 4.8 MW m!2). These curves indicates that the maximum hoop stress is strongly increased by increasing Tmax, as the plastic strain achieved during the first heating cycle increases (especially above 600!C), while the abso-lute value of the minimum compressive strain decreases for a stabilized cycle. The mechanical strain amplitude is maximum (0.65%) when Tmaxis 685!C. Stabilized hystere-sis loops (Fig. 5b) clearly indicate that an increase in the heating rate results in an increase of the maximum hoop stressr
hh, and consequently the hoop stress amplitude Dr
hh(as the compressive minimum stress remains quasi unchanged). In the same manner, the maximum amplitude of mechanical hoop straine
m,hhis achieved for the highest heating rate (Fig. 5b).As shown inFig. 4, the strain and stress amplitudes, D
e
m and Dr
, are calculated for the stabilized cycles as:D
e
m¼e
m;maxðTminÞ !e
m;minðTmaxÞ; ð4ÞD
r
¼r
maxðTminÞ !r
minðTmaxÞ: ð5Þ The variation with the temperature of the longitudinal and circumferential stresses,r
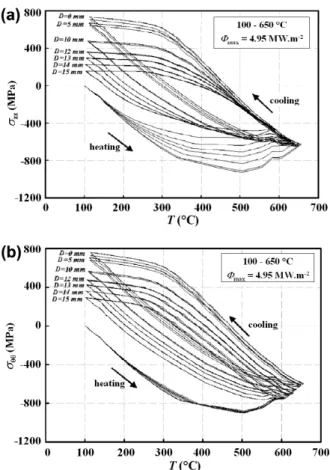
zzandr
hh, along the longitudinal zz-axis of the specimen is shown respectively inFig. 6a and b (for Tmax= 650!C and Umax= 4.95 MW m!2). These curves indicate that the severity of the stress amplitude decreases towards the ends of the specimen. InFig. 7, the variation of the stress amplitude in longitudinal (Dr
zz) and hoop (Dr
hh) directions are plotted along the zz-axis, for two different test conditions. As can been observed, Dr
zz and Dr
hh are almost identical in the centre of the specimen, and Dr
zzdecreases much faster than Dr
hhwhen approaching the ends of the specimen. On the other hand, increasing the heating rate (and therefore the maximum heat flux density Umax) leads to a higher stress amplitude and a higher absolute difference between the longitudinal and hoop stress amplitudes.Detailed investigations (Salem et al., 2009) on the thermo-mechanical modelling have revealed that when elasto-visco-plastic constitutive equations (using both isotropic and kinematic hardening laws) are used, the
Fig. 3. Comparison of measured and calculated temperature (T)-time (t) curves in the ‘‘gauge area’’ of the instrumented specimen, from the external surface to 8.15 mm in depth (reference TF test: Tmin! Tmax= 100–650!C, ht = 1.2 s).
Fig. 4. Typical hoop stress–strain hysteresis loops (rhhvs.em,hh),
calcu-lated for the first and second cycles at the external surface in the ‘‘gauge area’’ of the specimen, for the reference TF test (Tmin! Tmax= 100–650!C,
amplitude of the thermal stress (D
r
) remains quasi-un-changed vs. TF cycles (a difference less than 10% – around 7% – is observed for the thermal cycle 100–650!C). It was found that the mean stress (r
m¼ ðr
maxþr
minÞ=2) evolves to the higher stresses, only by translating the stress–strain hysteresis loops. It should be noted that the stress–strain loops were simulated only for a limited number of thermal cycles (about 50). As the amplitude of TF inelastic strain is very small (less than 0.2%), the visco-plastic strain (creep type) has a negligible effect on thermal stress amplitude (Dr
). Therefore, the use of appropriate elasto-plastic calcu-lations is relevant to estimate the thermal stress amplitude.4. Variation of the heat-checking pattern morphology As shown by a detailed investigation (Le Roux et al., 2013b), the microscopic homogeneous heat-checking pat-terns are composed of pseudo-hexagonal cells with an equivalent diameter of about 20
l
m (Fig. 8a). However, it must be noted that two other scales of heat-checking can also be observed in the ‘‘gauge area’’ of the specimen (Medjedoub, 2004):– mesoscopic interconnected cells with a size of about 200
l
m (Fig. 8b), resulting from the propagation and coalescence of more opened micro-cracks;– macroscopic cells, sizing a few millimetres (Fig. 8c), with a crack opening at surface which increases as the number of TF cycles increases.
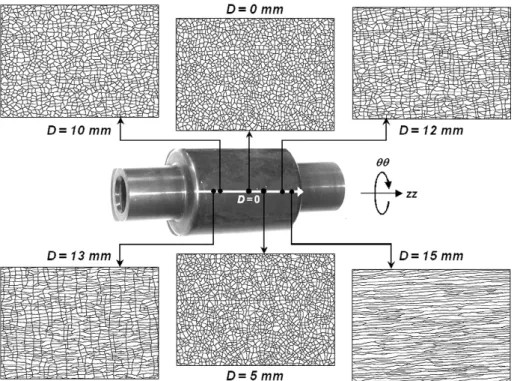
The results presented hereafter refer only to the micro-scopic scale. In the saturated regime, i.e. when the crack density is stabilized after a sufficient number of TF cycles (Le Roux et al., 2013b), the morphology of the microscopic heat-checking cells shows a strong variation along the lon-gitudinal zz-axis of the specimen, as illustrated by the heat-checking maps in Fig. 9 for the reference TF test (Tmax= 650!C and ht = 1.2 s). A gradual transition is ob-served from a ‘‘cell-type’’ in the central area of the speci-men (D = 0 mm), to a ‘‘parallel-type’’ cracking towards
Fig. 5. Evolution of the stabilized hoop stress–strain hysteresis loop (rhh
vs. em,hh), for various maximum temperatures Tmax (a), and heating
periods ht (b) of the thermal cycle.
Fig. 6. Stress–temperature variation at different distances D from the centre of the specimen along the zz-axis, for the reference TF test: (a) in the longitudinal direction; (b) in the circumferential direction.
Fig. 7. Variation of the longitudinal and hoop stress amplitudes (Drzzand
Drhh) vs. D, for two TF conditions (Tmax= 650!C, ht = 1.2 and 6.5 s with
the extremities (D = 15 mm). It must be emphasised that such variation of the cell morphology is found for all TF test conditions (whatever Tmax and ht). Outside the ‘‘gauge area’’ (i.e. at D > 10 mm), the number of micro-cracks oriented along the circumferential (hh) axis decreases towards the ends of the specimen.
InFig. 10, the evolution of shape factors (i.e. compact-ness and elongation, as defined in Le Roux et al., 2013b) of the saturated heat-checking cells is plotted vs. D along the zz-axis of the specimen, for the reference TF test. One can observe that the mean compactness of the cells re-mains quasi-constant around 0.6 in the central ‘‘gauge area’’ (0 mm < D < 10 mm), then decreases drastically to a minimum value of about 0.2 near the ends of the TF spec-imen. Contrarily, the mean elongation gradually increases from a constant value of about 0.4 in the centre up to al-most 1 close to the ends.
The gradual transition from a multi-axial to an uni-axial cracking is further highlighted by the ‘‘rose plots’’ shown in
Fig. 11for various distances D along the zz-axis (reference TF test). These roses, plotting the normalised frequency distribution of crack orientations, are determined accord-ing to a method fully detailed in Le Roux et al. (2013b). At the centre of the specimen (D = 0 mm,Fig. 11a), the rose is quasi-uniformly distributed, with however two orienta-tions slightly more pronounced: the first coincides with the longitudinal direction (0!), the second is aligned with the circumferential direction (90!). At the extreme borders of the specimen (D = 15 mm,Fig. 11c), a unique preferen-tial orientation, coincident with the zz-axis of the speci-men, is observed. In the transition area (from D = 10 to 13 mm), the rose indicates two prevailing orientations at 0! and 90! (Fig. 11b).
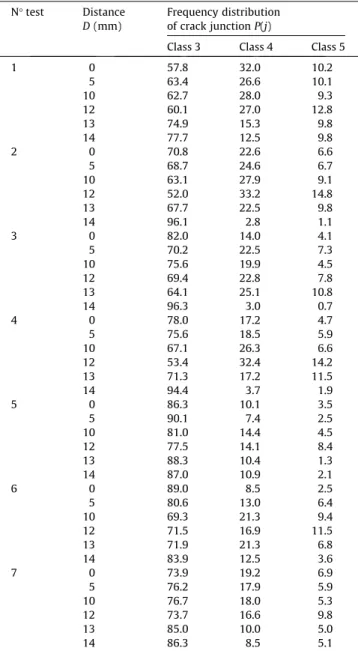
On the other hand, the density of nodes dn, defined as the number of crack junctions per unit area (Le Roux et al., 2013b), decreases from the centre to the extremities of the specimen. This trend is roughly similar regardless of Tmax (Fig. 12a), while it is strongly dependant on the applied heat-flux density, hence ht, as shown onFig. 12b. This can be explained by the higher crack density observed in the checking patterns generated with higher heat-ing rates, while it was previously reported that the micro-crack density was Tmax-independent (Le Roux et al., 2013a). In addition, depending on the number of branches joining at each node, three different classes are identified in the heat-checking networks: trivalent (‘‘class 3’’), tetravalent (‘‘class 4’’) and pentavalent (‘‘class 5’’) crack junctions (Le Roux et al., 2013b).Table 2indicates that throughout the longitudinal axis of the specimen, the crack junctions are predominantly trivalent (about 75% on average). It may be also noted that whatever the test conditions, the proportion of trivalent crack junctions is maximal near the ends of the specimen (89% on average at D = 14 mm). The frequency distribution of the angles b between each radiating crack branch (Le Roux et al., 2013b) shows that b ranges mostly between 100! and 150! in the central ‘‘gauge area’’ (Fig. 13). A maximum is observed at 120!, which corresponds to ‘‘Y-shaped’’ crack junctions. On the contrary, near the extremities of the specimen (D = 14 mm), the frequency distribution P(b) peaks signifi-cantly around 170!–180!, indicating that the crack net-work is composed almost exclusively of quasi-parallel cracks. In the transition region (for D = 10–13 mm), P(b) is more scattered, nevertheless showing a large proportion of ‘‘Y-shaped’’ crack junctions.
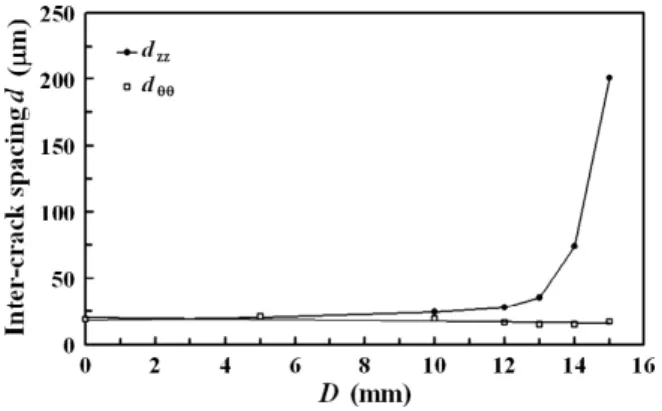
Fig. 14 shows the evolution of the inter-crack spacing dzzand dhh, measured respectively in the longitudinal and circumferential directions, vs. the zz-axis for the reference TF test. It reveals that dzz increases drastically from D= 12 mm towards the ends of the specimen, whereas dhh remains almost unchanged from the centre towards the extremities. Consequently, the inter-crack distance ra-tio dhh/dzz, which is about 1.0 in the centre, decreases to 0.2 at the ends of the specimen. It must be noted that dzzand dhhare quasi Tmax-independent, but may vary with Umax (and therefore ht). However, this does not really affect the ratio dhh/dzz, which remains nearly constant regardless of the test conditions (Fig. 15).
Fig. 8. Various sizes of heat-checking cells observed with SEM on the surface of the TF specimen, at a microscopic (a), mesoscopic (b) and macroscopic (c) scale (Medjedoub, 2004).
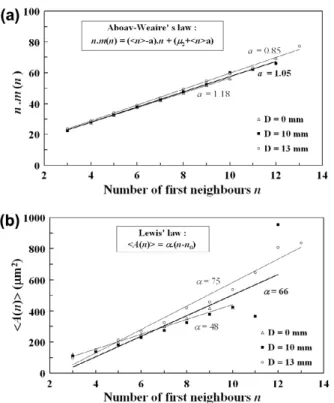
Finally, the topological properties of the crack patterns were also investigated along the longitudinal axis of the specimen, for some test conditions (Table 3). The heat-checking cells present an average number of first neigh-bours equal or very close to six whatever the distance D. It must be however noted that this characteristic could not be evaluated close to the ends of the TF specimen (i.e. at D > 13 mm). In fact, when approaching this area, the number of cells within the ‘‘measuring mask’’ is not sufficient for a reliable statistical evaluation, as their shape becomes very elongated (seeLe Roux et al., 2013bfor more details about the measuring mask).Fig. 16a shows that the Aboav–Weaire’s law (which states a linear correlation be-tween the average number of neighbours of cells surround-ing a n-sided cell and the average number of neighbours of the cells (Aboav, 1970, 1980; Weaire, 1974)) is well satis-fied all along the longitudinal axis. This correlation de-scribes a statistical equilibrium, expressing the fact that many-sided cells tends to be surrounded by few-sided cells
and vice versa. Whatever the test conditions, the determi-nation coefficient of Aboav–Weaire’s law is remarkably high (RAW> 0.97). The estimated constant a varies between 0.55 and 1.44. The variance
l
2, which measures the spread of the distribution of the number of first neighbours of cells, is more scattered (1.28 <l
2< 6.98) and increases with increasing the distance D from the centre of specimen (Table 3). This evolution indicates that the cell organisation tends to be more disordered when approaching the extremities of the specimen (at D = 13 mm), despite the quasi-unique preferential orientation of the cells. It can be however noted that for the reference TF test (Fig. 16a), the scattering of Aboav–Weaire’s law constants is lower when D increases (a = 1.01 ± 0.17 andl
2= 2.15 ± 0.81). The Lewis’ law, which establishes a relationship between the average area of the cells to their number of first neigh-bours (Lewis, 1928, 1931), is also rather well satisfied (RL> 0.77), regardless of the position (D) on specimen (Fig. 16b). This law reflects the tendency for many-sided cells to be larger, on average, than fewer-sided cells, and that the shaping of the network is governed only by math-ematical constraints of space-filling. As mentioned earlier for the variancel
2, the slope of Lewis’ correlation is very scattered (47 <a
< 1325). In fact,a
increases with increas-ing D whatever the TF test conditions (Table 3). This means that the mean area of the heat-checking cells increases when approaching the extremities of the specimen (due to their more elongated shape).5. Discussion
The square or rectangular cells observed in the transition area (as shown inFig. 17a for D = 12 mm) is a
Fig. 9. Heat-checking maps showing the variation of the morphology of heat-checking cells along the longitudinal axis of the specimen (D is the distance from the specimen centre), for the reference TF test (Tmax= 650!C, ht = 1.2 s) in the saturated regime.
Fig. 10. Evolution of the shape factors (mean compactness and elonga-tion) of the saturated heat-checking cells vs. D, for the reference TF test.
particular cell-type cracking not only generated by TF load-ing. This kind of cracking morphology was also reported by
Daffos et al. (2002)in isothermal low cycle fatigue (LCF) experiments performed on nitrided X38CrMoV5 steels. De-spite the uniaxial macroscopic loading experienced by the
specimen, a ‘‘square-shaped’’ crack network was observed under a strain amplitude of 0.8% at 650!C (Fig. 17b), while a ‘‘parallel-type’’ cracking occurred in most other LCF experiments. The authors have explained the formation of such secondary cracks parallel to the loading direction by a microscopic multi-axial loading generated locally in the nitrided layer. These local hoop strains and stresses would be due to the difference in thermal expansion between the nitrided layer (with a dominant elastic behav-iour) and the more ductile steel (with an elasto-visco-plas-tic behaviour), leading to a thermo-plaselasto-visco-plas-tic accommodation and cracking (Daffos et al., 2002). A similar phenomenon has been reported in thin brittle films deposited on a com-pliant polymer, under uniaxial tension (McGuigan et al., 2003; Frank et al., 2009). When the substrate material was subjected to a 15% strain, a ‘‘square-type’’ cracking occurred, whereas a regular array of parallel cracks was observed at lower strain level. McGuigan et al. (2003)
attributed this ‘‘deviation’’ from the parallel-type cracking – manifested by short cracks initiated parallel to the uniax-ial loading and leading to the formation of ‘‘rectangular-shaped’’ cells – to the stress due to Poisson contraction ef-fects.Frank et al. (2009)have explained this phenomenon by tensile stress relaxation due to coating fragmentation under a constant macroscopic strain. The mismatch of lateral elastic contraction between the coating and the substrate leads to compressive stresses in the transverse direction, and buckling of the layer. Using a two-dimen-sional shear lag model, the aforementioned authors proved that the magnitude of the compressive stress was suffi-cient to compensate for tensile stress which may be induced by a Poisson’s ratio mismatch.
Fig. 11. Rose of orientations of micro-cracks in the saturated regime, for increasing distances D from the centre of the TF specimen (reference TF test: Tmax= 650!C, ht = 1.2 s): (a) D = 0 mm; (b) D = 10 mm; (c)
D= 15 mm.
Fig. 12. Evolution of the density of nodes dn of the saturated
heat-checking patterns vs. D, for various: (a) maximum temperatures Tmax,
By comparing both micrographs (Fig. 17a and b), one can observe that the cell shape generated under TF and LCF tests is nevertheless slightly different, even if the inter-crack dis-tance ratio - which describes in some way the shape of the cells - is rather similar ðdhh=dzz¼ 0:6 ' 0:1Þ. The heat-check-ing network observed under TF is composed of polygonal cells with curved edges, whereas the micro-cracks initiated under the LCF test form quasi-perfect quadrilateral cells with straight cracks. This observation can be supported by an investigation of the distribution of the crack junctions.
Fig. 18a shows that in both cases (and especially for the LCF test), the crack junctions are mostly trivalent. However, the frequency distributions of the crack junction angles clearly indicate that the crack network generated under
LCF is almost exclusively composed of
‘‘T-shaped’’ junctions (with angles at 90! and 180!), whereas 120! angles (constituting ‘‘Y-shaped’’ junctions) are pre-dominant in the TF heat-checking network (Fig. 18b).
A detailed study of the crack network formation (Le Roux et al., 2013b), based on interrupted TF tests under multi-ax-ial loading, showed that the crack network stabilized very quickly, and that the cracks formed in all directions from the very beginning of the crack initiation. In addition, it is widely accepted that crack junction angles at 120! are formed in the early stages of cracking (as in our TF experi-ments), whereas 90! angles correspond to later crack propa-gation due to local stress field around cracks (seeLe Roux et al., 2013b, and references therein). Thus, when the strain applied to a coated or layered material exceeds a critical va-lue (under uniaxial loading, as in LCF or tensile tests), sec-ondary transverse cracks may appear in the parallel network of primary cracks formed perpendicular to the load-ing direction. This induces the emergence of ‘‘T-shaped’’ crack junctions, resulting from the division of pre-existing cells and forming thus square or rectangular cells.
In any case, all these observations from various experi-ments carried out on layered materials confirm that the morphology of the superficial crack network is mainly dependant on the local strain and stress state generated either under isothermal or non-isothermal loading, at a macroscopic or microscopic scale. Depending on the multi-or uni-directionality of the mechanical loading, the crack pattern that forms is either isotropic (‘‘cell-type’’ with varying shapes: hexagonal or ‘‘island-shaped’’, square, rectangular), or anisotropic (parallel or ‘‘lamellar-type’’). Contrary to LCF or TMF experiments where strains and stresses can be measured directly, TF laboratory specimens – as industrial components – require a FEM analysis to evaluate the distribution of thermal stresses and strains.
Fig. 19 indicates that the ratio of calculated longitudinal and hoop stress amplitudes varies gradually from the cen-tre of the TF specimen (D
r
zz/Dr
hh= 1.0 at D = 0 mm, indi-cating a bi-axial or multiaxial loading) to its extremities (Dr
zz/Dr
hh6 0.6 ± 0.1 at D P 14 mm, indicating a more uniaxial loading). The heat-checking maps illustrated inFig. 9clearly show that this local stress state has a drastic effect on the heat-checking morphology, leading to a
Table 2
Frequency distribution of the trivalent (class 3), tetravalent (class 4) and pentavalent (class 5) crack junctions in the microscopic heat-checking networks produced under various TF test conditions in the saturated regime, at different distances D from the centre of the specimen along the longitudinal zz-axis (47 HRC heat-treated X38CrMoV5 specimens).
N! test Distance D(mm)
Frequency distribution of crack junction P(j)
Class 3 Class 4 Class 5 1 0 57.8 32.0 10.2 5 63.4 26.6 10.1 10 62.7 28.0 9.3 12 60.1 27.0 12.8 13 74.9 15.3 9.8 14 77.7 12.5 9.8 2 0 70.8 22.6 6.6 5 68.7 24.6 6.7 10 63.1 27.9 9.1 12 52.0 33.2 14.8 13 67.7 22.5 9.8 14 96.1 2.8 1.1 3 0 82.0 14.0 4.1 5 70.2 22.5 7.3 10 75.6 19.9 4.5 12 69.4 22.8 7.8 13 64.1 25.1 10.8 14 96.3 3.0 0.7 4 0 78.0 17.2 4.7 5 75.6 18.5 5.9 10 67.1 26.3 6.6 12 53.4 32.4 14.2 13 71.3 17.2 11.5 14 94.4 3.7 1.9 5 0 86.3 10.1 3.5 5 90.1 7.4 2.5 10 81.0 14.4 4.5 12 77.5 14.1 8.4 13 88.3 10.4 1.3 14 87.0 10.9 2.1 6 0 89.0 8.5 2.5 5 80.6 13.0 6.4 10 69.3 21.3 9.4 12 71.5 16.9 11.5 13 71.9 21.3 6.8 14 83.9 12.5 3.6 7 0 73.9 19.2 6.9 5 76.2 17.9 5.9 10 76.7 18.0 5.3 12 73.7 16.6 9.8 13 85.0 10.0 5.0 14 86.3 8.5 5.1
Fig. 13. Frequency distributions P(b) of angles between the crack segments measured on trivalent crack junctions, for various distances D from the centre of the TF specimen (reference TF test: Tmax= 650!C,
gradual transition from a ‘‘cell-type’’ to a ‘‘parallel-type’’ cracking along the longitudinal axis. Isotropic cells form in the centre of the specimen since the stresses are compa-rable in the longitudinal and hoop directions, while a set of parallel cracks is initiated perpendicular to the hoop stres-ses near the extremities, where
r
zzbecomes negligible in comparison tor
hh. In addition, it must be emphasised that regardless of the applied thermal cycle, the variation of the stress amplitude ratio Dr
zz/Dr
hhvs. D (Fig. 19) follows a trend quite close to that of dhh/dzzvs. D (Fig. 15). This sim-ilarity between these two curves would suggest that the ratio of the circumferential and longitudinal inter-crack spacing, dhh/dzz, is a direct consequence of the stress ampli-tude ratio Dr
zz/Dr
hh. In fact, an empirical linear correlation between Dr
zz/Dr
hh and dhh/dzz can be established in the saturated regime (Fig. 20a and b). This relationship can be expressed as:dhh=dzz¼ k & ðD
r
zz=Dr
hhÞ þ b ; for 0:55 <Dr
zz=Dr
hh6 1:0;ð6Þ
where k is the slope of the linear regression, and b a constant.
Regardless of the TF test conditions, a determination coefficient (R) close or higher to 0.9 is obtained (Table 4), proving a good agreement to Eq.(6). This is especially true for the reference TF test, as shown inFig. 20a. Both k and b change slightly with Tmax and ht (k ¼ 2:4þ 0:7!0:3, b ¼ !1:35þ 0:27
!0:67), but no relationship could be found regard-ing the maximum heat-flux density Umax (Table 4). As mentioned earlier, the stress amplitudes were calculated
Fig. 14. Evolution of the inter-crack spacing d vs. D, for the reference TF test (Tmax= 650!C, ht = 1.2 s) in the saturated regime (dzz and dhh are
measured in the longitudinal and circumferential directions, respectively).
Fig. 15. Evolution of the inter-crack distance ratio dhh/dzzvs. D, for various
TF test conditions in the saturated regime.
Table 3
Topological properties and least-square fit parameters of topological correlations determined on the microscopic heat-checking cells produced under various TF test conditions in the saturated regime, at different distances D from the centre of the specimen along the longitudinal zz-axis (47 HRC heat-treated X38CrMoV5 specimens).
N! test Distance D (mm)
Number of cells in the measuring mask Mean number of neighbours of cells hni Aboav–Weaire’s law parameters Lewis’ law parameters a l2 RAW a RL 1 0 3439 6.03 0.93 2.11 0.999 67 0.881 5 2966 6.02 0.99 2.29 0.999 84 0.947 10 2029 6.02 0.79 2.90 0.999 122 0.935 12 1563 6.04 0.99 2.40 0.997 149 0.961 13 426 5.90 0.47 2.93 0.996 429 0.956 2 0 2791 6.01 0.92 1.96 0.999 60 0.976 5 2942 6.00 0.65 2.47 0.997 76 0.948 10 2157 6.01 0.93 2.57 1.000 101 0.947 12 1652 6.00 0.72 3.41 1.000 128 0.947 13 721 5.80 0.55 6.98 0.991 273 0.774 3 0 2820 6.00 1.18 1.34 0.999 48 0.985 5 3244 6.01 1.05 1.79 0.998 49 0.972 10 2749 5.99 1.05 1.79 0.996 66 0.992 12 3285 6.02 0.93 2.47 0.999 58 0.940 13 2511 6.01 0.85 2.96 0.997 75 0.977 6 0 331 5.99 1.44 1.28 0.973 438 0.889 5 446 5.95 1.07 3.51 0.999 380 0.992 10 281 5.99 0.94 2.72 0.997 524 0.963 12 130 5.95 0.69 1.92 0.997 840 0.846 13 107 5.95 0.83 3.66 0.976 1325 0.902 7 0 2968 6.01 0.80 2.51 0.999 68 0.924 5 2720 6.01 1.29 1.90 0.994 64 0.963 10 1978 6.01 1.02 2.34 0.999 75 0.794 12 1212 5.98 0.93 2.94 1.000 201 0.856 13 839 5.85 0.75 4.85 0.994 296 0.975
for the steel substrate (whereas the inter-crack spacing were measured on the oxide layer). However, they represent the local thermo-mechanical loading of the multi-layered mate-rial (here composed of an oxide scale and the steel sub-strate), due to the thermal gradient. One can consider that the tubular specimens used in our experiments are com-posed of several disc specimens, each subjected to different ‘‘multi-axial loading’’ conditions. Eq.(6)means that the mor-phology of the heat-checking pattern (cell- or parallel-type) is an indicator for the local stress ratio, generated by thermal and/or mechanical loading. This indicator could contribute to get better insight into and control – for example by heat management – the thermo-mechanical loading of industri-als components in service, such as forging tools (Miquel
et al., 2002), die-casting moulds (Srivastava et al., 2004; Persson et al., 2005; Le Roux et al., 2013a), wheels and breaks (Degallaix et al., 2007). In addition, a previous study (Le Roux et al., 2013a) has revealed that the size of the heat-checking cells is strongly related to the maximum heat-flux density applied to the specimen (higher Umax generating crack networks with smaller cells). The cell size can thus be considered as an indicator of the severity of the local heat-transfer between tools and parts, and therefore of the ther-mo-mechanical stresses and strains experienced by the tool.
Fig. 16. Application of topological correlations to the heat-checking cells in the saturated regime, for various distances D from the centre of the specimen (reference TF test: Tmax= 650!C, ht = 1.2 s): (a) Aboav–Weaire’s
law, expressing a linear relationship between n&m(n) and n [m(n) is the average number of neighbours of cells surrounding a n-neighboured cell, and n the average number of neighbours of the cells] ; (b) Lewis’ law, expressing a linear relationship between the average area of the cells hA(n)i and n.
Fig. 17. Similarity between the morphology of the heat-checking pattern formed under the reference TF test (Tmax= 650!C, ht = 1.2 s) in the transition area
(D = 12 mm) of the specimen (a), and the ‘‘square-type’’ cracking observed on a nitrided X38CrMoV5 steel subjected to an isothermal LCF test (Tmax= 650!C,
De= 0.8%) (Daffos et al., 2002) (b).
Fig. 18. Comparison of the frequency distributions of the crack junction classes (a) and angles (b) measured on the crack networks shown in
6. Conclusions
The heat-checking patterns, formed on the oxidised sur-face of a X38CrMoV5 hot work tool steel under various thermal fatigue conditions, were investigated along the longitudinal axis of a tubular specimen. The morphology of the heat-checking cells is experiencing a variation, from a ‘‘cell-type’’ in the centre of the specimen to a ‘‘parallel type’’ when approaching its extremities. This variation is highlighted by the shape factors of the heat-checking cells. In the centre of the specimen, the crack pattern exhibits a quasi-isotropic rose of crack orientations. In contrast, a strong preferential orientation is observed near the ends of specimen that can be related to the uni-axial loading prevailing in this region. Despite their different shape, the topological properties of the heat-checking cells (espe-cially their average number of first neighbours) remain al-most constant along the longitudinal axis of the specimen. A more scattered and disordered cellular arrangement is however observed near the extremities. Both Aboav– Weaire’s and Lewis’ laws are verified, meaning that whatever the test conditions and the cell morphology, the cellular network is in statistical equilibrium and its shaping is governed by space-filling constraints.
The thermo-mechanical stresses and strains applied to the TF specimen were estimated by a FEM analysis, based on temperature–time measurements and adimensional calculations. Whatever the thermal fatigue test conditions, a linear relationship is established between the ratio of cir-cumferential and longitudinal inter-crack spacing dhh/dzz, and the ratio of longitudinal and hoop stress amplitudes, D
r
zz/Dr
hh. It is shown that a local stress ratio near 1 leads to a multi-axial heat-checking, while a stress amplitude ra-tio close to or less than 0.6 ± 0.1 results in a uni-axial cracking. The morphology of the crack pattern could be used as an indicator of the local stress and strain state, con-stituting a powerful tool to better monitor the thermo-mechanical loading of real components or tools in service.Acknowledgments
The authors would like to thank the CTIF (Centre Tech-nique des Industries de Fonderie), and especially Dr P. Hairy, for supporting a part of this activity. The French
Fig. 19. Evolution of the inter-crack distance ratio dhh/dzz(a) and the
stress amplitude ratio Drzz/Drhh(b) vs. D, for various TF test conditions in
the saturated regime.
Fig. 20. Linear relationship between the inter-crack spacing ratio dhh/dzz
and the ratio of calculated longitudinal and hoop stress amplitudes Drzz/
Drhh, in the saturated regime: (a) for the reference TF test (Tmax= 650!C,
ht= 1.2 s); (b) for all TF test conditions (tests performed on 42 HRC heat-treated steels are indicated by an asterisk).
Table 4
Calculated parameters (slope k, constant b and determination coefficient R) of Eq.(6)(linear relationship between the inter-crack spacing ratio dhh/dzzand the
stress amplitude ratio Drzz/Drhh), for various TF conditions in the saturated regime.
No. test Steel hardness (HRC) Maximal temperature Tmax(!C) Heating time ht(s)
Maximum heat-flux densityUmax
(MW m!2)
Total number of cycles
Linear law (Eq.(6)) parameters k b R 1 47 575 0.95 4.84 80000 2.40 !1.39 0.883 2 47 600 1.0 4.85 80000 3.11 !2.02 0.991 3 42 650 1.2 4.95 20000 2.53 !1.54 0.970 47 650 1.2 4.95 20000 2.30 !1.24 0.996 4 47 650 2.0 3.93 20000 2.42 !1.29 0.957 5 47 650 3.7 2.78 20000 2.16 !1.11 0.983 6 47 650 6.5 2.13 40000 2.32 !1.20 0.944 7 42 685 1.6 4.75 3000 2.37 !1.31 0.964 47 685 1.6 4.75 2000 2.11 !1.08 0.924
National Program on Forging (ACRII and Simulforge), and CETIM are also acknowledged for financial support.
References
Aboav, D.A., 1970. The arrangement of grains in a polycrystal. Metallography 3 (4), 383–390.
Aboav, D.A., 1980. Arrangement of cells in a net. Metallography 13 (1), 43–58.
Andersons, J., Leterrier, Y., Fescenko, I., 2003. Analysis of the initial fragmentation stage of oxide coatings on polymer substrates under biaxial tension. Thin Solid Films 434, 203–215.
Bernard, O., Amiri, G., Haut, C., Feltz, B., Huntz, A.M., Andrieux, M., 2002. Mechanical and microstructural characterisation of oxide films damage. Mater. Sci. Eng. A335, 32–42.
Chen, B.F., Hwang, J., Yu, G.P., Huang, J.H., 1999. In situ observation of the cracking behavior of TiN coating on 304 stainless steel subjected to tensile strain. Thin Solid Films 352, 173–178.
Daffos, C., Lamesle, P., Rézaï-Aria, F., 2002. Isothermal high temperature low cycle fatigue of 5% CrMiV tool nitride steels. Proc. Conf. Appl. Mech. Mater. Sci. Joining Form. Processes: High-Temp. Fatigue, 56– 63.
Degallaix, G., Dufrenoy, P., Wong, J., Wicker, P., Bumbieler, F., 2007. Failure mechanisms of TGV brake discs. Key Eng. Mater. 345 (346), 697–700.
Dour, G., Medjedoub, F., Le Roux, S., Diaconu, G., Rézaï-Aria, F., 2005. Normalized thermal stresses analysis to design a thermal fatigue experiment. J. Therm. Stress. 28, 1–16.
Dour, G., Medjedoub, F., Diaconu, G., Girardin, D., Michrafy, A., Loulou, T.M., Rézaï-Aria, F., 2008. Size effect in transient thermal fatigue testing and thermo-mechanical screening of coatings. Int. J. Microstruct. Mater. Prop. 3 (2–3), 311–325.
Evans, A.G., Crumley, G.B., Demarayt, R.E., 1983. On the mechanical behavior of brittle coatings and layers. Oxid. Met. 20 (5–6), 193–216.
Evans, A.G., Hutchinson, J.W., 1995. The thermo-mechanical integrity of thin films and multi-layers. Acta Metall. Mater. 43, 2507–2530.
Frank, S., Handge, U.A., Olliges, S., Spolenak, R., 2009. The relationship between thin film fragmentation and buckle formation: synchrotron-based in situ studies and two-dimensional stress analysis. Acta Mater. 57, 1442–1453.
Freborg, A.M., Ferguson, B.L., Brindley, W.J., Petrus, G.J., 1998. Modeling oxidation induced stresses in thermal barrier coatings. Mater. Sci. Eng. A245, 182–190.
Gao, S., Nakasa, K., Kato, M., 2003. Analysis and simulation of cracking patterns in coating under biaxial tensile or thermal stress using analysis/FEM strain-accommodation method. Eng. Fract. Mech. 70, 1573–1591.
He, M.Y., Hutchinson, J.W., Evans, A.G., 2003. Simulation of stresses and delamination in a plasma-sprayed thermal barrier system upon thermal cycling. Mater. Sci. Eng. A345, 172–178.
Hirsch, T., Mayr, P., 1988. Residual stresses and residual stress distributions in TiCN- and TiN-coated steels. Surf. Coat. Technol. 36 (3–4), 729–741.
Kung, S.C., 1990. High-temperature coating for titanium aluminides using the pack-cementation technique. Oxid. Met. 34 (3–4), 217–228.
Le Roux, S., Medjedoub, F., Dour, G., Rézaï-Aria, F., 2013a. Role of heat-flux density and mechanical loading on the microscopic heat-checking of high temperature tool steels under thermal fatigue experiments. Int. J. Fatigue 51, 15–25.
Le Roux, S., Medjedoub, F., Dour, G., Rézaï-Aria, F., 2013b. Image analysis of microscopic crack patterns applied to thermal fatigue heat-checking of high temperature tool steels. Micron 44, 347–358.
Lewis, F.T., 1928. The correlation between cell division and the shapes and sizes of prismatic cells in the epidermis of Cucumis. Anatomical Record 38 (3), 341–376.
Lewis, F.T., 1931. A comparison between the mosaic of polygons in a film of artificial emulsion and the pattern of simple epithelium in surface view (cucumber epidermis and human amnion). Anatomical Record 50 (3), 235–265.
McGuigan, A.P., Briggs, G.A.D., Burlakov, V.M., Yanka, M., Tsukahara, Y., 2003. An elastic–plastic shear lag model for fracture of layered coatings. Thin Solid Films 424 (2), 219–223.
Medjedoub, F., 2004. Détermination des paramètres influant sur le phénomène d’endommagement par fatigue thermique des moules en fonderie sous pression d’aluminium. Ph.D. Thesis, Ecole des Mines de Paris, France.
Miquel, B., Jean, S., Le Roux, S., Lamesle, P., Rézaï-Aria, F., 2002. Heat-checking of hot work tool steels. In: Proceedings of the 9th International Conference on Temperature-Fatigue Interaction, pp. 185–193.
Miller, R.A., 1984. Oxidation-based model for thermal barrier coating life. J. Am. Ceram. Soc. 67 (8), 517–521.
Nakasa, K., Takata, S., Ichigo, H., 1998. An analysis of island-delamination type cracking pattern in the brittle film coated on a disk under axisymmetric tension. Eng. Fract. Mech. 59, 191–202.
Persson, A., Hogmark, S., Bergström, J., 2005. Thermal fatigue cracking of surface engineered hot work tool steels. Surf. Coat. Technol. 191, 216– 227.
Salem, M., Velay, V., Cheikh, M., Dour, G., Lamesle, P., Rézaï-Aria, F., 2009. Fatigue life modelling of hot work forming tools. In: Proceedings of the 8th International Tooling Conference – Tool, vol. I, pp. 455–464.
Schütze, M., 1994. An approach to a global model of the mechanical behaviour of oxide scales. Mater. High Temp. 12 (2–3), 237–247.
Srivastava, A., Joshi, V., Shivpuri, R., 2004. Computer modeling and prediction of thermal fatigue cracking in die-casting tooling. Wear 256, 38–43.
Teixeira, V., 2001. Mechanical integrity in PVD coatings due to the presence of residual stresses. Thin Solid Films 392 (2), 276–281.
Weaire, D., 1974. Some remarks on the arrangement of grains in a polycrystal. Metallography 7 (2), 147–160.
Xie, C., Tong, W., 2005. Cracking and decohesion of a thin Al2O3film on a