HAL Id: hal-02121417
https://hal.archives-ouvertes.fr/hal-02121417
Submitted on 6 May 2019
HAL is a multi-disciplinary open access
archive for the deposit and dissemination of
sci-entific research documents, whether they are
pub-lished or not. The documents may come from
teaching and research institutions in France or
abroad, or from public or private research centers.
L’archive ouverte pluridisciplinaire HAL, est
destinée au dépôt et à la diffusion de documents
scientifiques de niveau recherche, publiés ou non,
émanant des établissements d’enseignement et de
recherche français ou étrangers, des laboratoires
publics ou privés.
Success prediction in MOOCs A case study
Antoine Pigeau, Olivier Aubert, Yannick Prié
To cite this version:
Antoine Pigeau, Olivier Aubert, Yannick Prié. Success prediction in MOOCs A case study.
Educa-tional Data Mining 2019, Jul 2019, Montréal, France. �hal-02121417�
Success prediction in MOOCs
A case study
Antoine Pigeau, Olivier Aubert and Yannick Prié
LS2N, University of Nantes, France
[email protected]
ABSTRACT
Success prediction in Massive Open Online Courses (MOOCs) is now tackled in numerous works, but still needs new case studies to compare the solutions proposed. We study here a specific dataset from a French MOOC provided by the OpenClassrooms company, featuring 12 courses. We exploit various features present in the literature and test several classification models.
1.
INTRODUCTION
Multiple models and data mining methods for learner suc-cess prediction in a Massive Open Online Courses (MOOCs) are proposed by many works in the literature [1], with dif-ferent conclusions about which model provides the best per-formance. The quality of the results seems to highly depend on the input dataset, and on the selected or computed fea-tures. Generalization of the methodology for success pre-diction seems now ongoing [1], but we still need new case studies to improve the accuracy and insights obtained by these methods.
This work presents a case study on a new dataset, provided by OpenClassrooms, a major online courses french company. We test several models using classification algorithms and sequence-based approaches, such as process and pattern min-ing. Our study aims at enriching previous results obtained for different datasets published in the literature.
Our first contribution in this work is the comparison of 8 clas-sification models. Random Forest, AdaBoost, Support Vec-tor Machine (SVM), logistic regression and neural networks are first applied, followed by sequence-based approaches: an LSTM neural network, a process mining method and a pro-posal of a solution based on a sequence mining method. The second contribution consists in experimental results obtained from a new dataset for a success prediction task. While most papers only focus on 1-5 courses [1], we use here 12 different courses from the same platform.
The remainder of this paper is organized as follows: sec-tion 2 surveys previous work related to success predicsec-tion.
Section 3 presents the dataset used for the experiments with details on the raw data used to compute features. Sec-tion 4 describes features obtained from the literature and their adaptation to our context. Section 5 presents the clas-sification methods that we applied. The result of our exper-iments are detailed and discussed in section 6. We conclude by summarizing our work and drawing perspectives in sec-tion 7.
2.
RELATED WORK
Prediction of dropout or success in MOOCs is carried out in numerous works [1]. The goal is to improve the performance of the learners by detecting a possible failure in advance. Such a detection could for instance lead to a teacher inter-vention to increase the learner engagement in the course. The input data for such a prediction is based either on as-signments [2, 3, 4, 5, 6] or clickstreams [7, 8, 9, 10]. Social activities can also be included to assess the learner engage-ment in a course [2, 3, 5].
Classification methods rely on common approaches such as linear regression, logistic regression, K-nearest neighbors, random forests, decision trees, support vector machines, hid-den Markov models and neural networks. Because the course context is different for each study, it is hard to determine which model will be the best for a prediction task. Support vector machine is the best method obtained for [5] while ran-dom forest performs better in [6]. The conclusion of [2] states that prediction performance depends more on the features computed than on the model.
Several temporal data mining methods are proposed in the literature [1, 8, 9]. Recurrent neural networks are assessed for dropout detection and experiments conclude that LSTM recurrent networks present the second best results in [11] (where a Nonlinear State Space Model is slightly better). [9] proposes a solution based on process mining to emphasize a correlation between the way learners browse the course and their performances. Other approaches use sequence mining algorithms to predict learner skills [8].
In the present work, we test some of the common shallow methods proposed in the literature, as well as neural network approaches. We also explore a solution based on process mining, and propose one based on sequence mining. For all these algorithms, we assess a large set of features adapted from the literature.
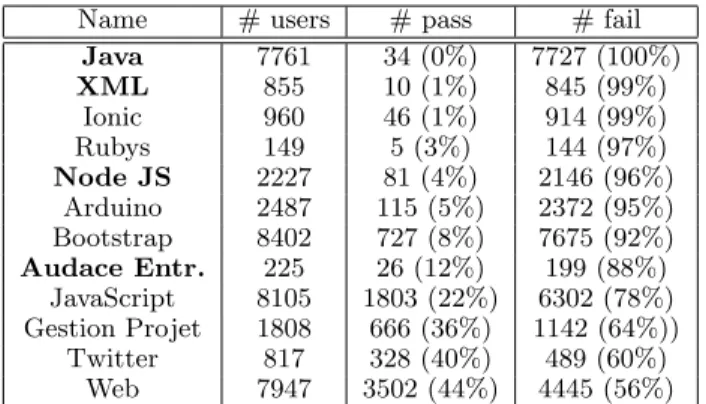
Name # users # pass # fail Java 7761 34 (0%) 7727 (100%) XML 855 10 (1%) 845 (99%) Ionic 960 46 (1%) 914 (99%) Rubys 149 5 (3%) 144 (97%) Node JS 2227 81 (4%) 2146 (96%) Arduino 2487 115 (5%) 2372 (95%) Bootstrap 8402 727 (8%) 7675 (92%) Audace Entr. 225 26 (12%) 199 (88%) JavaScript 8105 1803 (22%) 6302 (78%) Gestion Projet 1808 666 (36%) 1142 (64%)) Twitter 817 328 (40%) 489 (60%) Web 7947 3502 (44%) 4445 (56%) Table 1: Number of learners per group for each course of the OpenClassrooms dataset, after cleanup. The first column presents the total number of learners and the two last ones detail the number of passing and failing learners.
3.
INPUT DATA
OpenClassrooms is a MOOC platform that provides courses in various domains, from art and culture to computer sci-ence. All courses are freely accessible anytime, and paid ser-vices are proposed for supplementary features such as online help and certificates of achievement. Courses are generally composed of texts, videos or e-books that users can browse, read or download after a registration process. Based on the properties proposed in [1], these courses can be characterized as follows:
• massive, open and online: thousands of learners can follow the courses freely. Paid access is provided to get an access to a tutor or a completion certificate; • no-stakes: the learner can complete a course without
certification or credit;
• asynchronous: learners are free to register, browse the content, or complete a course. There is no constraint on dates for enrollment or assignments. This point is important and has an impact on the choice of features used as input for the prediction model;
• heterogeneous: learners have various motivations and mostly come from francophone countries since courses are in french.
In this study, we are considering a dataset covering 12 courses in the domains of programming languages, project manage-ment and startup creation. The two leftmost columns of table 1 present for each course its name and the total num-ber of learners that followed it, from 2014 to 2016.
The provided courses are composed of static web pages and quizzes/assignments, and do not contain any video. A course is composed of chapters, divided in sections, and of exer-cises based on quizzes and assignments. To succeed in a course, a learner must obtain an average grade on all exer-cises higher than 70/100 (the exerexer-cises are quizzes automat-ically graded).
The input format of learner activity is a clickstream dataset. Each access to a resource is recorded as one event in a log file. The granularity of the retrieved events varies among different courses. Apart from Audace Entreprendre, Node JS, XML and Java (in bold in table 1), which are traced at
the section level, all courses present a chapter granularity. The first step applied on the raw dataset consists in seg-menting the learners’ sequences of events into sessions. This session detection step aims to enrich some features related to the learners’ regularity, the duration, or the number of events in the working sessions. The learners’ sessions are de-termined from the raw sequences with the method proposed in [12], where a session is defined as a delimited and sustained set of pages visited by the same user within the duration of one particular visit to a particular website. Once sessions are determined, a cleaning task is performed: learners with only one session and no exercise attempt are removed. We associate this behaviour to learners that want to check the content of the course and do not really intend to follow it. Discussion with the OpenClassrooms company about their needs lead us to define two groups for our goal of success prediction:
• passing group: set of learners that obtained an average grade equal to or higher than 70/100 for a course; • failing group: set of learners that did not obtain an
average grade higher than 70/100. This group contains all the learners that either quit the course or completed all exercises but failed to obtain a grade higher than the 70/100 validation threshold.
Our choice for the terms ”Pass / Fail” is based on [1], where it is defined that A student typically passes a course if they meet or exceed an instructor-specified overall grade threshold; otherwise they fail.
The two rightmost columns of table 1 present the number of learners in each group for the 12 courses of the dataset, after the cleaning step. As commonly encountered in MOOC contexts, these groups are clearly unbalanced: on average, the passing group represents 15% of the learners. Courses of table 1 are ordered according to the percentage of passing learners.
4.
FEATURES
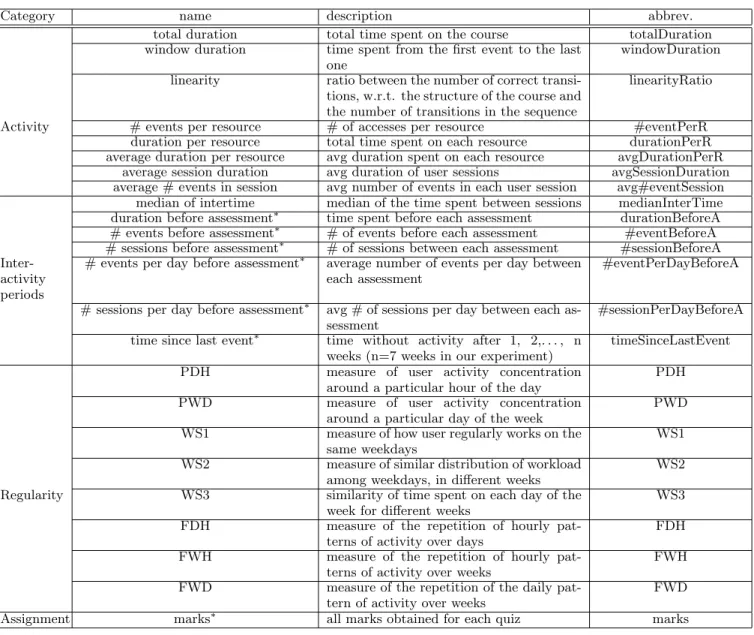
Table 2 presents our candidate features set. This set re-groups an adaptation of the best features identified in [2, 7, 13, 14, 15] and a set of regularity features proposed in [10]. We needed to adapt some of the features due to differing contexts for our MOOC.
Several options are possible to generate features depending on the considered machine learning approach:
• basic features: features are computed for the whole considered period (after x weeks of the course for in-stance). These features do not evolve with time; • temporal features: features are computed for successive
time periods in order to emphasize their evolution all along the course. The period commonly used in the literature seems to be one week [1];
• temporal features with stacking: similar to the previ-ous method but each feature of a period is stacked with the previous one. Practically, it consists in adding the values of week n with those of week n+1.
Category name description abbrev. total duration total time spent on the course totalDuration window duration time spent from the first event to the last
one
windowDuration linearity ratio between the number of correct
transi-tions, w.r.t. the structure of the course and the number of transitions in the sequence
linearityRatio
Activity # events per resource # of accesses per resource #eventPerR duration per resource total time spent on each resource durationPerR average duration per resource avg duration spent on each resource avgDurationPerR
average session duration avg duration of user sessions avgSessionDuration average # events in session avg number of events in each user session avg#eventSession
median of intertime median of the time spent between sessions medianInterTime duration before assessment∗ time spent before each assessment durationBeforeA # events before assessment∗ # of events before each assessment #eventBeforeA # sessions before assessment∗ # of sessions between each assessment #sessionBeforeA
Inter-activity periods
# events per day before assessment∗ average number of events per day between each assessment
#eventPerDayBeforeA
# sessions per day before assessment∗ avg # of sessions per day between each as-sessment
#sessionPerDayBeforeA time since last event∗ time without activity after 1, 2,. . . , n
weeks (n=7 weeks in our experiment)
timeSinceLastEvent PDH measure of user activity concentration
around a particular hour of the day
PDH PWD measure of user activity concentration
around a particular day of the week
PWD WS1 measure of how user regularly works on the
same weekdays
WS1 WS2 measure of similar distribution of workload
among weekdays, in different weeks
WS2 Regularity WS3 similarity of time spent on each day of the
week for different weeks
WS3 FDH measure of the repetition of hourly
pat-terns of activity over days
FDH FWH measure of the repetition of hourly
pat-terns of activity over weeks
FWH FWD measure of the repetition of the daily
pat-tern of activity over weeks
FWD Assignment marks∗ all marks obtained for each quiz marks
Table 2: Features used for our experiments: this set is composed of features identified in our litterature review, adapted to the characteristics of our dataset (* indicates the features defined by a set of values).
5.
PREDICTION TASK
In this section, we present different classification methods tested for our prediction task of passing/failing. We start with the baseline methods commonly applied for this kind of task and then detail a process mining approach and our proposal based on a sequence mining solution.
5.1
Baseline approaches
In order to compare our results with other available works in the literature, we experimented with the following methods: Random Forest, AdaBoost, SVM, logistic regression, dense neural network and LSTM neural network.
A first step of feature selection is necessary for logistic regres-sion and SVM models. We rely here on a wrapper method with a forward selection to emphasize the best features. A subset of features is iteratively built, starting from an empty set and adding one by one the features that best improve our model’s accuracy for the whole set of courses. The process is stopped when accuracy does not increase anymore.
Except for LSTM neural network that directly relies on a sequence of features, other methods can deal with several types of input features: basic features, temporal features and temporal features with stacking. We test each possibility in our experiment, to determine in what measure this choice impacts the performance of the prediction.
5.2
Process mining approach
Process mining was initially a method to analyze business processes for process discovery, process conformance check-ing and process improvement. In the context of online cour-ses, this method proposes to study the behavior of learners during a course, by emphasizing common paths in course resource navigation.
The classifier for our prediction task is built from the out-puts of process discovery and conformance checking meth-ods. Our process discovery relies on the Heuristic Miner algorithm [16]. This algorithm is robust, and deals with the majority of common problems in process detection. Models
Sequence length
Random forest AdaBoost SVM Logistic regression 25% marks, durationPerR, #sessionPerDayBe-foreA, #eventBeforeA, avgDurationPerR marks, avg#eventSession, durationPerR, avgDura-tionPerR marks, #eventPerR, #sessionPerDayBe-foreA, durationBeforeA #eventPerR, marks, durationBeforeA, #ses-sionBeforeA, #event-PerDayBeforeA 50% marks, #sessionPerDay-BeforeA, #eventPerDay-BeforeA marks, avgDura-tionPerR, duraavgDura-tionPerR, #eventPerR #eventPerR, marks, #eventBeforeA, #event-PerDayBeforeA #sessionBeforeA, #eventPerR, marks, #eventBeforeA 75% marks, #sessionPerDay-BeforeA, #eventPerDay-BeforeA marks, avgDura-tionPerR, durationPerR marks, #eventPerDay-BeforeA, #eventPerR, #sessionBeforeA marks, #eventPerR
100% marks marks marks marks
Table 3: Best features for the different sequence lengths for random forest, AdaBoost, SVM and logistic regression models. This result is an aggregation of the best features obtained on each course separately. For each model and sequence length, features are ordered from most to least pertinent.
for failing and passing are built with this algorithm for each course. Our conformance checking solution relies on an al-gorithm based on an alignment method [16]. Our prediction task is carried out by computing the fitness of a learner on both failing and passing models, and affecting him to the group with the best fitness.
The input dataset of a process mining algorithm is a set of traces, where each trace represents the sequence of activities of one learner. In our context, an activity is an access to a resource and is defined with the id of this resource. Because the grades and the duration of each access are lost, a cat-egorization step is carried out on each event of a learner’s trace. It consists in updating the resource ids (the activity) as follows: for an exercise id, the new id depends on suc-cess or failure. For a chapter/section, the new id depends on the duration spent on the resource, using 3 classes of short/medium/long durations.
5.3
Sequence mining approach
With this approach, our goal is to determine whether differ-ent groups of learners presdiffer-ent distinct frequdiffer-ent sub-sequences of events in their traces.
Our first step is to build the passing model (by retrieving the frequent sequence on only the passing learners) and the failing model. We rely on the VMSP algorithm to generate the maximal frequent sequences on both groups. Note that all sub-sequences of a maximal sequence are also frequent sequences, thus we still obtain all the frequent sequences. Our second step is to compute a similarity score between a model and a learner’s sequence. Our proposal consists in tessellating the new learner sequence with the larger frequent sub-sequences of the models. Practically, we try to map each frequent sequence on the learner sequence. The mapping obtained is used to compute a similarity score:
1. for a frequent sequence of length n in the model, gen-erate all k-grams with k between 2 and n;
2. map all k-grams one by one on the learner sequence, keeping the mapping with the larger k-gram;
3. repeat the steps 1-2 for all frequent sequences; 4. for each item position of the learner sequence, a score is
computed as the length of the longer k-gram that maps this position. The similarity score is then obtained by
summing up all these positions’ scores.
The input dataset for this method is similar to the one used for our process mining approach. Each learner’s event is categorized with our previous method (see section 5.2).
6.
EXPERIMENTS
For all the following experiments, a cross validation 80% train - 20% test is carried out 10 times on each course sep-arately. For the neural network approaches, the training set is divided into a train set, a validation set and a test set. In-put features are standardized. The comIn-putation of temporal features is carried out by grouping the sessions into 7 days periods. For each period, all features, except the regularity ones, are computed.
Neural networks present the advantage of avoiding the la-borious feature selection step, but still need some tuning for determining a correct architecture with its optimization parameters. Our first task was to assess several candidate architectures, varying the number of layers and units. Our prediction tasks were carried out on all courses and results were aggregated. The best accuracies were obtained with the following parameters: [Dense Layer of 512 units, Dropout layer, Dense Layer of 256 units, Dropout layer, Dense layer of 1 unit with a sigmoid activation].
A similar search was carried out for the architecture of the LSTM solution, leading to the following parameters: [LSTM layer of 32 units, Dense layer of 1 units with a sigmoid ac-tivation]. The input of the LSTM algorithm, a time series, was computed as follows: each session is considered as a time step. For a specific learner, the input features for time t is computed with the learner tth session and each element of a learner’s time step is stacked with its previous element (a padding is applied to provide the same time’s series length for each learner).
Finally, in order to assess our prediction at different time steps of the learning process, classification tasks are tested on truncated versions of the sequences. Experiments provide results for 25%, 50%, 75% and 100% of learner’s sequence length (number of events).
In the following, the best features for random forest, logistic regression, SVM and AdaBoost models are first presented.
25% 50% 75% 100% A. P. F. A. P. F. A. P. F. A. P. F. Basic features Random forest 91% 28% 96% 93% 36% 96% 94% 47% 96% 98% 77% 98% AdaBoost 91% 41% 94% 93% 48% 95% 94% 59% 96% 99% 96% 99% SVM 88% 61% 90% 91% 64% 92% 92% 69% 93% 98% 89% 99% Logistic Reg. 88% 66% 89% 91% 71% 91% 93% 84% 93% 99% 100% 99% Dense NN 91% 37% 94% 93% 47% 95% 94% 59% 95% 98% 82% 99% LSTM 90% 38% 93% 91% 47% 93% 93% 55% 95% 97% 78% 98% Process mining 66% 47% 64% 72% 49% 71% 67% 54% 65% 64% 54% 58% Seq. mining 24% 85% 13% 24% 88% 9% 22% 95% 5% 18% 100% 0% Temporal features Random forest 92% 9% 99% 92% 11% 99% 92% 12% 98% 92% 11% 99% AdaBoost 90% 42% 94% 92% 46% 95% 92% 46% 96% 95% 55% 98% SVM 88% 60% 90% 89% 65% 90% 92% 72% 92% 99% 87% 99% Logistic Reg. 87% 58% 91% 91% 67% 92% 92% 76% 92% 99% 90% 99% Dense NN 89% 36% 93% 90% 41% 93% 92% 48% 94% 94% 59% 96% Temporal features with stacking Random forest 89% 16% 97% 90% 22% 98% 91% 24% 97% 92% 29% 96% AdaBoost 91% 43% 94% 92% 47% 95% 93% 51% 96% 97% 67% 99% SVM 91% 66% 93% 87% 23% 95% 91% 57% 92% 91% 61% 92% Logistic Reg. 89% 64% 90% 90% 61% 92% 92% 76% 92% 98% 91% 98% Dense NN 88% 36% 92% 83% 18% 88% 79% 17% 82% 78% 18% 83%
Table 4: Accuracies of the different models tested. A., P. and F. stand respectively for All, Pass and Fail
Second, the results of the prediction task are detailed for each model.
6.1
Best features selection
The best features obtained for the shallow methods are pre-sented in table 3. The best features for SVM and logistic regression are obtained with the wrapper method described in section 5.1. Best features on each course were computed with a 10 times 80%-20% cross validation, leading to a score for each feature depending on its ranking. These scores were then aggregated among the courses. For random forest and AdaBoost, the weights provided by the learning algorithms have been used. For each method and sequence length, we selected the features with the best scores until a sudden drop appeared (the elbow method).
Clearly, the number of best features decreases with the in-crease of the sequence length available for the classification task, leading to the sole use of marks (feature marks) for full length. The marks feature is obviously pertinent for all sequence lengths.
If we ignore marks, random forest, logistic regression and SVM seem more related to inter-activity periods features while AdaBoost is associated to activity features. The best features concern mainly the marks, the activity intensity and the activity intensity between assessments. No regularity feature appears in the best features list for any model. In the following, the aggregated best features obtained for SVM and logistic regression models are used to provide the results of our prediction task.
6.2
Best models
Table 4 presents the aggregated accuracies obtained for each model on each course separately, with basic features, tem-poral features and temtem-poral features with stacking.
Each row is associated to a model and the columns present the sequence length used to fit the model (25%, 50%, 75%
and 100%). The sub-columns (A., P., F.) stand for All, Pass and Fail, respectively for the overall accuracy, the accuracy for the passing learners and the accuracy for the failing learn-ers.
Among the shallow classification methods, the Adaboost and logistic regression models present the more balanced results on both the passing and failing groups: Adaboost seems more reliable to detect the failing learners while the logistic regression model performs better on the passing group. The Random Forest solution provides good results on balanced courses but clearly fails on very unbalanced ones (see the 28% accuracy on the passing group). The SVM model presents results similar to the logistic regression model, except for the passing learner accuracies which are clearly lower.
Compared to the best shallow models, the dense neural net-work presents a poor performance on passing learners and does not significantly outperform failing learner prediction. In our opinion, the lack of passing learners for each course in the train set does not enable to fit appropriately the pa-rameter of the network. The LSTM model provides a result similar to the dense neural network, but with a higher com-putation cost. Hence we do not recommend these neural-based models in our context.
The process mining model presents very low scores. Our explanation is that the graphs generated by the heuristic miner algorithm on the two learner groups (passing and fail-ing) contain the same navigation paths. Traces for passing or failing learners can then be replayed on both graphs with a good fitness.
A similarly bad result is also obtained with the sequence mining model. It can be explained by the fact that frequent sequences of failing learners are short and almost all included in the frequent sequences of the passing learners. Passing fre-quent patterns are more numerous and longer (longer pat-terns involve an increase of the similarity score between a model and an input learner trace). It is then more likely
to find a better similarity between a learner sequence and the passing learner model. Our conclusion for the process and sequence mining approaches is that passing and failing learners do not present a discriminant behavior on the way they browse the courses.
The second and third parts of table 4 present the average accuracies when temporal features are used for the input dataset of the models, without and with stacking. Compared to the results obtained with the basic features, the results with the temporal features with and without stacking are lower for all models on all sequence lengths, with a clear drop on the accuracies of the passing learners. To conclude, the temporal features do not provide any improvement in our experiments.
To summarize, our experiments show that shallow models present the best results for our dataset. Among them, Ad-aBoost and logistic regression present the best results re-spectively for the failing group and the passing group. An-other observation is that contrary to several experimental results [8, 9], our temporal data mining approaches (tem-poral features, LSTM, process mining and sequence mining solutions) do not perform well on our data set. Our con-clusion here is that no difference can be found in the way learners access the course resources.
7.
CONCLUSION
The objective of our work was to assess several solutions for predicting success in the context of Massive Online Open Courses, using a new dataset provided by the OpenClass-rooms company, a major online course enterprise in France. From our experimental results, we reached the following con-clusions:
• failing and passing learners do not seem to present dif-ferences in the way they browse a course. Neither spe-cific paths nor spespe-cific patterns are identified with our proposed solutions to discriminate between passing and failing learners;
• best features depend on the model used for the predic-tion tasks;
• temporal features do not increase the performance of the prediction task;
• the best models to detect failing and passing learners are respectively based on AdaBoost and logistic regres-sion solutions.
A short term perspective work is to apply the same predic-tion tasks on other MOOC datasets, in order to validate our previous conclusions in other learning environments.
8.
REFERENCES
[1] J. Gardner and C. Brooks, “Student success prediction in MOOCs,” User Modeling and User-Adapted
Interaction, vol. 28, pp. 127–203, June 2018. [2] C. Taylor, K. Veeramachaneni, and U. O’Reilly,
“Likely to stop? predicting stopout in massive open online courses,” CoRR, vol. abs/1408.3382, 2014. [3] I. Koprinska, J. Stretton, and K. Yacef, “Students at
risk: Detection and remediation,” in Proceedings of the 8th International Conference on Educational Data Mining, EDM, pp. 512–515, Jun. 2015.
[4] J. Feild, “Improving student performance using nudge analytics,” in Proceedings of the 8th International Conference on Educational Data Mining, EDM, pp. 464–467, Jun. 2015.
[5] S. Tomkins, A. Ramesh, and L. Getoor, “Predicting post-test performance from online student behavior: A high school MOOC case study,” in Proceedings of the 9th International Conference on Educational Data Mining, EDM, pp. 239–246, Jun. 2016.
[6] M. Sweeney, H. Rangwala, J. Lester, and A. Johri, “Next-term student performance prediction: A
recommender systems approach,” Journal of
Educational Data Mining (JEDM), vol. 8, no. 1, 2016. [7] Z. Ren, H. Rangwala, and A. Johri, “Predicting
performance on MOOC assessments using multi-regression models,” in Proceedings of the 9th International Conference on Educational Data Mining, EDM, pp. 484–489, Jun. 2016.
[8] K. H. R. Ng, K. Hartman, K. Liu, and A. W. H. Khong, “Modelling the way: Using action sequence archetypes to differentiate learning pathways from learning outcomes,” in Proceedings of the 9th
International Conference on Educational Data Mining, EDM, pp. 167–174, Jun. 2016.
[9] P. Mukala, J. C. Buijs, M. Leemans, and W. M. P. van der Aalst, “Learning analytics on coursera event data: A process mining approach.,” in SIMPDA (P. Ceravolo and S. Rinderle-Ma, eds.), vol. 1527 of CEUR Workshop Proceedings, pp. 18–32, 2015. [10] M. S. Boroujeni, K. Sharma, L. Kidzinski,
L. Lucignano, and P. Dillenbourg, “How to quantify student’s regularity?,” Proceedings of the 11th European Conference on Technology Enhanced Learning, pp. 15. 277–291, 2016.
[11] F. Wang and L. Chen, “A nonlinear state space model for identifying at-risk students in open online courses,” in Proceedings of the 9th Intl Conference on
Educational Data Mining, pp. 527–532, Jun. 2016. [12] M. Sadallah, B. Encelle, A. E. Maredj, and Y. Pri´e,
“Towards reading session-based indicators in educational reading analytics,” in Proccedings of the 10th European Conference on Technology Enhanced Learning, EC-TEL, Toledo, Spain, September 15-18, pp. 297–310, 2015.
[13] J. Whitehill, J. J. Williams, G. Lopez, C. A. Coleman, and J. Reich, “Beyond prediction: First steps toward automatic intervention in mooc student stopout,” in Proceedings of the 8th International Conference on Educational Data Mining, EDM, pp. 171–196, 2015. [14] Y. Chen, Q. Chen, M. Zhao, S. Boyer,
K. Veeramachaneni, and H. Qu, “Dropoutseer: Visualizing learning patterns in massive open online courses for dropout reasoning and prediction,” in Conference on Visual Analytics Science and Technology, VAST, pp. 111–120, Oct. 2016.
[15] S. Nagrecha, J. Z. Dillon, and N. V. Chawla, “Mooc dropout prediction: Lessons learned from making pipelines interpretable,” in Proceedings of the 26th International Conference on World Wide Web Companion, pp. 351–359, Apr. 2017.
[16] W. M. P. V. der Aalst, Process Mining: Data Science in Action. Heidelberg: Springer-Verlag Berlin Heidelberg, 2nd ed., 2016.