HAL Id: hal-01898445
https://hal.archives-ouvertes.fr/hal-01898445
Submitted on 18 Oct 2018
HAL is a multi-disciplinary open access
archive for the deposit and dissemination of
sci-entific research documents, whether they are
pub-lished or not. The documents may come from
teaching and research institutions in France or
abroad, or from public or private research centers.
L’archive ouverte pluridisciplinaire HAL, est
destinée au dépôt et à la diffusion de documents
scientifiques de niveau recherche, publiés ou non,
émanant des établissements d’enseignement et de
recherche français ou étrangers, des laboratoires
publics ou privés.
Axes and Coordinate Systems Representations for
Immersive Analytics of Multi-Dimensional Data
Adrien Fonnet, Toinon Vigier, Grégoire Cliquet, Fabien Picarougne, Yannick
Prié
To cite this version:
Adrien Fonnet, Toinon Vigier, Grégoire Cliquet, Fabien Picarougne, Yannick Prié. Axes and
Co-ordinate Systems Representations for Immersive Analytics of Multi-Dimensional Data. 4th
Inter-national Symposium on Big Data Visual and Immersive Analytics, Oct 2018, Konstanz, Germany.
�hal-01898445�
Axes and Coordinate Systems Representations for
Immersive Analytics of Multi-Dimensional Data
Adrien Fonnet
LS2N UMR6004 CNRS University of NantesToinon Vigier
LS2N UMR6004 CNRS University of NantesGr´egoire Cliquet
Readi Design lab l’ ´Ecole de Design
Fabien Picarougne
LS2N UMR6004 CNRS University of NantesYannick Pri´e
LS2N UMR6004 CNRS University of NantesAbstract—Axes are the main components of coordinate systems representations. They play a critical role for the visual analysis of multi-dimensional data. However their representation seems to have always be considered self evident, with oriented lines crossing at an origin, completed with labels such as ticks and names. Such classical representation show limits when it comes 3D visualization and immersive analytics (IA), mainly because orthogonal projection of points on linear axes is hard in a 3d environment, and because the user can move and the axes get out of her field of view. In this paper we propose a task-based definition of axes and coordinate systems representation, as well as a tentative design space for coordinates systems representation in immersion. We also present an exploratory user study we carried out to compare three grid-based representations of coordinate systems for multidimensional data analysis with 3D scatterplots.
Index Terms—immersive analytics, multi-dimensional data, coordinate systems, axes, virtual reality, user study
I. INTRODUCTION
In the data visualization pipeline, the mapping step consists in transforming multidimensional data into a visual abstrac-tion, from which concrete views can then be created by further representing data points on a screen [1]. However the focus on data should not make us forget that such mapping is always done with respect to a space defined by a coordinate system, which also has to be represented on the screen for users to be able to make sense of datapoints [2]. Cartesian coordi-nate systems are grid based and allow to draw scatterplots, barcharts, gantt diagrams, etc.; while polar systems are circle-based (distance and angle being the main coordinates), and can be used for radar charts or chord diagrams. A coordinate system representation role is to provide the frame of reference from which data points coordinates (hence data values) are to be understood. The most important visual components of coor-dinate system representations are usually one or several axes, which are usually represented as lines. Those representations seem to have always be considered self evident in 2D, and coordinate system representations and axes as such are not really discussed in the literature, or even in textbooks such as [3].
Immersive analytics (IA) is an emerging research field which aims to explore ”the applicability and development
This work is part of the IDEA project (Immersive Data Exploration and Analysis) funded by the Pays de la Loire French region through West Creative Industries program.
of emerging user interface technologies for creating more engaging and immersive experiences and seamless workflows for data analysis applications” [4]. 3D data representations are critical components of Immersive Analytics, that are rendered on 3D devices such as stereoscopic displays, CAVEs, VR or AR headsets. Users can experience those representations from two positions, being either external to the data, or immersed within it. It has long been recognized [5] that in any case such visualizations are hard for users to understand because they lack sufficient information to perceive relative positions of objects, to evaluate metrics and distances, or to project points on axes. When it comes to immersion, users can nevertheless change their point of view, alleviating some of these perception difficulties. This may however come at the cost of the frame of reference getting out of sight.
While most of the IA systems proposals since the 90’ have been based on simple extensions of 2D representations of coordinate systems (for instance using three orthogonal axes for a 3D Cartesian system), our initial concern is that those extensions may not be adapted to immersive analytics. If some works have acknowledged the need of going further, for instance by adding grids as way of complementing axes [6], we claim that the development of Immersive Analytics calls for a renewed understanding of coordinate system representations, that may lead to potentially fruitful new representations, as well as the elicitation of best practices and guidelines for IA systems design.
Our contributions in this paper are the following: we pro-pose to get back to the basic user tasks the representation of a coordinate system is meant to allow, and come up with three main tasks: understand space, get information, and search for data. We also propose an early design space for coordinate systems representation in immersive analytics based on seven dimensions. Finally we present an exploratory study com-paring three orthonormal coordinate system representations based on a grid cube for multidimensional data analysis of 3D scatterplots.
II. RELATED WORK
The 1977 staple book ”How numbers are shown” [2] provides a definition for a ”coordinate grid”: ”[it] is based on two rectilinear bisecting straight lines: the horizontal axis is called the abscissa or x-axis; the vertical axis is called the ordinate or y-axis. The point of intersection of the two axes is
known as the origin[...]”. Axes are therefore a critical part of a coordinate system representation, and their representation as lines is clearly stated. Such definition of axes is inline with those of the Cambridge Dictionary1: ”a fixed line on a
graph used to show the position of a point”, or the Merriam-Webster2: ”one of the reference lines of a coordinate system”.
[2] also provides a few guidelines on axis representation, e.g. ”the grid size should be as large as possible” or ”axes should be numbered in the range 0.1 ≤ N ≤ 100”. In the ”Grammar of graphics” [7], axes belong to the ”guide” category, together with legends and titles. Guides ”help us associate categories or quantities with aesthetics”, and axes are ”position guides” that have scales, rules, and labels.
Coordinate system representation modes have been some-what considered ”self-evident” in data visualization, mostly based on linear or circular axes, within established data visualization idioms. Tufte’s [8] proposals for data-ink ratio enhancement have put the attention on the necessity to fo-cus on data rather than on axes systems and accompanying material. A few works addressed side elements of coordinate systems representations, for instance tick labels positioning, or definition of best minimum and maximum values for each axis [9], [10]. Grids and helpers are also used in practical data visualization, for instance additional line(s) that show specific values or zones. However they usually qualify as annotations of a data visualization rather than being part of its coordinate system representation. On a side note, some works specifically aimed at studying how axes as such could be considered as primary components for defining coordinate systems for multi-dimensional data analysis, where lines represent the datapoints. Parallel coordinates [11] is a classical idiom, but other 2D representations have been proposed [12], [13].
Focusing now on Immersive Analytics, there have been a number of system proposals for multi-dimensional data analysis, for which coordinates system representations had to be designed. Even though the term ”immersive analytics” has only been defined in 2015 [4], immersive technology has been used since the nineties to analyze multi-dimensional data [14]. To the best of our knowledge, all of these systems did make use of axes for their coordinate systems representations. Most of them used a Cartesian orthogonal data visualization cubic volume, either with the origin at the corner [6], [14]–[18], or at the center [19], [20] of the cubic volume. The IDEA system [21] explored the use of a cylindrical coordinate system. ImAxes [22] allowed the user to manipulate axes as representations of data attributes, and create various immersive visualizations, such as 2D and 3D scatterplots and parallel coordinates. In most of those systems, axes are simple lines which can be curved for cylindrical or spherical coordinate system [21]. Most of those lines have a simple white color, but some systems do use color conventions for axes such as (red for x, green for y, and blue for z) [17], [18] or (purple, green and white) [19]. Origins in those coordinate
1https://dictionary.cambridge.org/ 2https://www.merriam-webster.com/
system representation are not emphasized, they are simply the intersection of all 3 axes. ImAxes [22] and IDEA [21] both use arrows representations for axes. 2D grids are of common use to help users make sense of the volume. Those grids are always placed on a face of the cubic data volume, hence most of the time they connect two axes together [15], [16], [18], with the exception of [20] where they are independent from the axes. Axes labels are in general represented with text in the vicinity of the related axis. Some systems only provide axis names [17], [19], other add minimum and maximum values [6], [22], and values through regular ticks [15], [18], [20], [21]. Some IA systems propose additional spatial hints to help the understanding of the immersive world: VRMiner [17] uses a different color (blue) for the ground face of the cubic volume, Symanzik et al. [14] use a checkerboard for the ground.
None of these IA papers justified their choice for axes representation. If a few papers commented on the importance of selecting relevant dataset attributes (e.g. numerical) to be mapped to each axis [17], [18], none did question the classical representation with lines and labels.
III. A TASK-BASEDDEFINITION OFCOORDINATE
SYSTEMSREPRESENTATION
From what precedes it should be clear that most of IA systems proposals did adapt 2D representations of coordinates systems to 3D immersive settings, without further discus-sion of the rationale behind their choices. Moreover, to our knowledge only a few of them have been evaluated on their efficiency for immersive data analysis, and none was evaluated with regards to the choices related to its coordinate system representation. If Immersive Analytics are to become widely used there is both a need for theoretical work on coordinate systems representation in immersive settings, and practical work on system design and evaluation, leading to effective guidelines for those representations.
Our proposal is that a task-based definition of coordinate systems representations can be useful to help reflect about and design such representations, as it would take into account what axes are used for, rather than focus straight away on how they are represented. Such an approach seems inline with that of [7] who considered axes as position guides rather than representations.
The definition we propose is that a Coordinate System Representation is a component of a data visualization which serves as a tool for the reader to a/ understand the visualization space, b/ get information about data points, and c/ search for data points. In that context, an axis is a sub-component of a coordinate system representation that is linked to one coordinate. An axis may support some of the tasks by itself, or in conjunction with other axes. Besides axes, other ancillary sub-components of coordinate systems representation may provide help to the user to conduct these task, such as grids or minimaps. Let us detail the tasks.
First, coordinate system representations are used to un-derstand the visualization space: they define the limits of
TABLE I: Summary of the tasks coordinate systems representations must allow a user to carry.
Understand the Space Get information about datapoints Search for datapoints
limits coordinates of a point from a specific value for one attribute
scale coordinates of a group of point from specific values for several attributes
semantics difference between points from interval values for one attribute
get ones position inside the space difference between groups of points from interval values for several attributes
the space dedicated to data visualization, as well as the scale of the representation. From them users can get the semantics of the space and the associated mapping: ranges of values, represented attributes, etc. Those representation also help users understand their current positions in the space. One’s current position is implicit in 2d data visualization: it is the external viewer position, which remains stable along the analysis. However in 3D and immersive environments for data analysis, users can navigate anywhere, and coordinate systems representation are also important for user orientation.
Second, coordinate system representations are used to get information about data points, a task that is usually done with respect to axes. Each axis usually encodes one data attribute, thus providing semantics to a data point in the data space with respect to the attribute it represents. Users must be able to ex-tract data points attributes values information at will, at least to get approximations, without further interaction such as details-on-demand. Therefore, coordinate system representations must allow users to determine the coordinates of a point or a group of points, e.g. finding the upper and lower limit of a cluster. Moreover, data analysis is also about comparing data, so those representations must provide ways for users to perform relative comparison between a pair or group of points.
Third, coordinate system representations are used to search for data points. Starting from a known value of an attribute, or from several values of several attributes, users need first to know if there are data points that exactly or roughly correspond, then get access to those data points. Data points can also be searched with value intervals.
Table I provides a summary of the tasks coordinate system representations as tools must allow a user to carry out.
We should make two remarks here. First, one should note that this definition is not limited to 3D or immersive environ-ments, and holds as well for more classical data visualizations. Second, in this definition we did not insist on interaction, as we want to focus on representations of coordinates systems that permit to carry out those tasks in a ”direct” way. In standard 2D screen environment, this means direct visual perception, in immersive analytics however, we extend this directness of perception to head or body movements that help users adjust their point of view, as well as to other perceptual channels such as audition or touch.
In the remaining paragraphs of this section we discuss some of the IA related works we have seen in Section 2, with regards to our definition, and the tasks their coordinate system representations need to support.
IA systems that put the user outside of the data volume
usually fulfill the ”understand the space” tasks requirements. [18] for instance use axes, 2D grids and labels to provide in-formation about the limit of the space, its scale, and semantics. User can easily orient, likely due to similarity with external user position of classical screen-based 2D data visualization. ImAxes [22] uses a similar approach with small sized, close representations to ensure the viewer can easily see the whole coordinate system representation. However when the user is fully immersed in the data volume, understanding the space may become quite a challenge. The Wizard system [19] provides very limited cues for the user to understand the space limits and scale with only 3 axes with an origin centered in the data volume, associated with labels placed next to the axes. No others cues are available to help users grasp their positions inside a fully dark world, that is why a mini map had to be added. VRMiner [17] provides cues to detect the limit of the space through a wireframe representation of the data volume, the ”ground” face uses a different color, and each axis has a specific color to help both orientation and semantic understanding of the space. However, no tick label are available that would provide information about the scale of the space, an issue that is not present in IDEA [21]. Nonetheless, all those proposal share the issue that spatial cues can easily get out of the user field of view when the user navigate inside the data volume.
All systems rely on users projecting points on the axes to carry out the tasks related to ”getting information about data points”. While some are using ticks on axes [21], [22], other display 2D grids on the faces of the data volume [15], [16], [18], [20]. A 2D grid is likely to improve projection by simplifying the process of getting the values on the 2 axes once the projection of a point is done on the grid, however this first projection remains an issue. Indeed, projection remains complex when the user is not aligned with one of the main directions of the coordinate system, a common situation when immersed in the data volume.
Providing information of the axes value is mandatory for users to be able to ”search for data points”, so solutions that do not provide tick label or 2D grid cannot be used for these tasks [6], [14], [17], [19]. Otherwise conclusions are similar to those related to the ”get information” tasks: 2D grids seem to be facilitating tools, but the task of constructing projected lines from axes so to aim at invisible zones where data points could then be found is far from easy.
From this analysis, we can see that designing coordinate system representations that satisfyingly fulfill all the tasks we proposed is hard, and that there is room for improvement. In the next section we propose a first version of a design space
Dimensions Attributes Type of coordinate system
cartesian cylindrical spherical Modality of representation* visual audition touch smell ... User positions with regards to the data* external
immersed Dependency to the user position* dependant
independent Reachability
arm’s reach few steps reach long distance reach Data orientation variability* whole data
subset of data Complexity variability* permanence
level of details
TABLE II: Summary of our design space proposal for coordinate systems representation in IA. Dimensions marked
with * are non exclusive.
for coordinate system representations, and in Section V we present an exploratory study with a few proposals building upon the use of 2D grids.
IV. TOWARDS ADESIGNSPACE FORCOORDINATE
SYSTEMSREPRESENTATION INIA
In this section we make some proposals towards the building of a high-level design space for coordinate systems repre-sentations in immersive analytics. We then provide some illustrations of its use.
A. Design Space Proposal
Mac Lean et al. [23] define a design space as ”an explicit representation of a structured space of design alternatives and the considerations for choosing among them different choices in the design space resulting in different possible artifacts”. Our preliminary proposal is organized around 7 dimensions summarized in table II. For each of them we provide various possibilities, that we discuss with regards to the tasks we proposed earlier.
Type of coordinate system obviously has influence on rep-resentation. Cartesian, cylindrical, or spherical coordinate sys-tems can be used for immersive analytics of multi-dimensional data.
Modality of representation is related to the sense(s) that can be used to perceive the coordinate system. Visual repre-sentation is by far the most common one but IA offers the possibility to embody the user in the immersive environment opening up potential for other senses, i.e. audition and touch. Senses may also be combined, for instance 2 axes may be vi-sually displayed while a third one could use a sound metaphor. Visual representation allows to cover all tasks: the space limits are usually delimited by a visual cube and information can be accessed through direct projection. However, perceptible
information is limited by the user field of view. That is why audition and touch could be used to keep perceiving systems of axes while vision is already used to focus on data points.
User position with regards to the data also provides constraints on the way the representation can be designed. As already seen, the user can have a position that is external to the data, for instance considering it at a small distance; or immersed within the data, and surrounded by data points. A third possibility would be internal and immersed implying the user can navigate freely between external and internal positions. Being external to the data may facilitate global understanding of the visualization space, while immersion may facilitate getting information from data points, as it becomes possible to navigate to an ideal position for the information extraction task at hand.
Dependency to user position states if the coordinate system representation is dependent or independent of the position of the user. External user independence seems a natural choice, but we can imagine that if the user can move around the data then the axes or grids may adjust to ease the reading, e.g. always placing grids behind datapoints, from the user perspective. For immersed users an independent position will facilitate understanding of the space and mental map building. However axes may get out of the field of view, and adapting their position to both user position and orientation would ensure information about the coordinate system is always visu-ally available. Having both datapoints and coordinate system always visible at the same time would facilitate information extraction from datapoints, as well as searching for specific data. Combinations are possible, e.g. making some elements of the representation react to user position, while other remain independent.
Reachability is related to the distance of the whole co-ordinate system representation from the user. Arm’s reach corresponds to a small representation that the user can observe and interact with with minimal movement. Few steps reach induces middle to human scale sized room volumes where only a few steps are required to access the entirety of the volume. Long distance reach is for systems that require important motion for exploring the data volume, with both physical -if the tracked space is big enough- and virtual locomotion.
Data orientation variability states whether the coordinate system representation presents information that concern the whole of the data, is tailored to a subset of it, or can provide information on both (a kind of focus+context based representation of coordinates). Being oriented towards the whole dataset can facilitate visualization space understanding, by providing limits and global volume of visualization. Data selection can be manual, or computed from proximity to user position. Obviously, an orientation towards a subset of data would be beneficial to get information, at the cost of limiting the understanding of the space, due to the change in the representation to fit the selection. Searching for data points would be limited to the part of the coordinate system represen-tation that is accessible within the selection. Considering both orientations may prove useful by stabilizing the representation
of the coordinate system for whole data and the understanding of the space (at the potential expense of information overload), while allowing to focus and get information on data points at hand.
Complexity variability is related to various ways the coordinate system representation can change in complexity. With regards to permanence, one can for instance imagine that the representation could disappear entirely to facilitate data remaining the center of attention [8], [24] for patterns detection, and appear temporarily when the user needs it. This brings of course additional questions on how to make such representation appear, e.g. through active or passive user interaction, and how to manage the transition. Another variability could be on the details the coordinate system rep-resentation provides. An axis could for instance have various levels of ticks and labels available so as to allow increasing or decreasing information extraction precision.
It is important to note that these dimensions are certainly not complete, nor definitive, and that this design space has to be refined. Our proposal nonetheless already provides a basis to design coordinate systems representations for IA. In the following examples we rapidly show its capability to describe a classical representation, and present 2 potential directions for design as illustrations.
B. Examples
Our first example is a standard proposal that can be found in the literature: a Cartesian coordinate system composed of 3 axes represented as lines with 2D grids linking all axes effectively creating 3 faces for the whole cubic volume, with labels placed in the vicinity of axes both for the axes names and tick values. The cubic volume is small enough for the outside user to be able to see the full coordinate system representation at all time. The corresponding values on the dimensions of our design space are: Cartesian coordinate, visual representation, external user position, independence of the user position, at arm’s reach, whole data orientation, and no variable complexity.
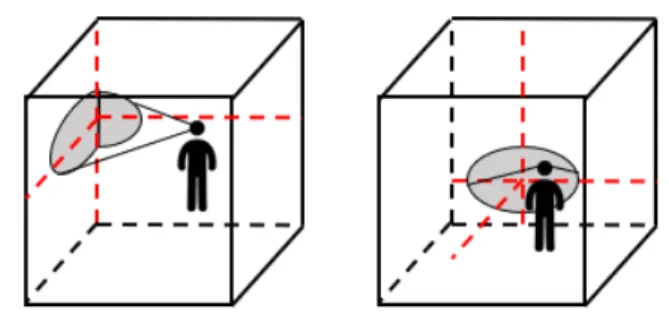
Our second example still uses a Cartesian coordinate sys-tem with a visual representation oriented towards the whole dataset, mainly composed of 3 linear axes. This time the user is immersed within the data volume, and the position of the axes are dependant of the user position and orientation using the following method: if the user can see one edge of the cubic volume, then one axis corresponds to this edge while the two others use the perpendicular faces to ensure the user can see them; if no edge is in the field of view, then the principal face in the user field of view is used to define 2 axes while the 3rd one is perpendicular to the face and placed at their intersection (see fig. 1). Further investigation would be required to determine precisely the axis movement law based on the field of view movement. In this example complexity of the representation is variable, i.e. the user can change the transparency of the axes, show/hide the semantics label, the tick labels, and the axes ticks. The corresponding values on
the dimensions of our design space are: Cartesian coordinate, visual representation, immersed user position, dependency of the user position, long distance reach, whole data orientation, and no variable complexity.
Fig. 1: Illustration of example 2: on the left the user can see an edge of the cubic volume, on the right he cannot, user
position dependant resulting axes in red.
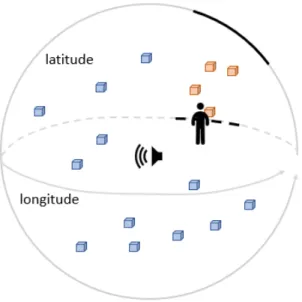
Our third example uses a spherical coordinate system com-bining visual and audio modalities, for a user immersed within the data volume, and no variable complexity. Both angular axes, latitude and longitude, are represented by curved lines with arrows, placed on the limits of the spherical data volume (see fig. 2). Axes become semi-transparent for the intervals that contain no selected data points. Moreover the origin of the sphere emits a continuous sound which allows the user both to locate the center of the data volume, and evaluates its distance from him, getting information about the third axis (radius). The corresponding values on the dimensions of our design space are: Spherical coordinate, visual and sound representation, immersed user position, independence of the user position, a few steps reach, subset of data orientation, and controlled complexity both on permanence and level of details.
V. A STUDY ONGRIDCUBES
We have seen in the previous sections that classical 3 axes visual representations of Cartesian coordinates systems have problems with regards to the tasks a user needs to perform, all the more so when she is immersed in the data. Before putting to the test radically new designs such as examples 2 and 3 in the previous section, we wanted to experiment with the possibility to enhance those classical 3 axes representations for user orientation and information extraction.
A. Rationale
In this exploratory study we compare how users behave when analyzing data in 3 different conditions for coordinate system representation. As the most common representation proposal for 3D scatterplots analysis is to use 3 axes and 3 grids on each of the 3 main planes, our first design is meant to facilitate user orientation by using 6 grids, hence creating a complete cube around the user (condition 1). We extend this first design by focusing on space perception: in
Fig. 2: Illustration of example 3: the black parts of axes are based on the selected data points (red). The origin of the
sphere emits a continuous sound.
condition 2 we add information to the grid cube so as to facilitate 3D projection with 3D axes; in condition 3 we aim at facilitating ”natural” evaluation of distances by using a human scale environment. Table III provides a summary of the 3 conditions, which will be detailed in the next section. User tasks focus on getting coordinate information from one, or between two data points.
TABLE III: Experimental conditions
Condition 1 Cubic volume with 2D grid on each faces Condition 2 Condition 1 + transparent 3D grid inside the volume Condition 3 Condition 1 + real-life elements with normalized
dimension outside the volume
B. Experimental material
Dataset. We used the same dataset for all three conditions. To build it we chose the classical ”wine” dataset and used ImAxes [22] to quickly test various combinations of attributes for 3D scatterplotting. We chose a particular combination of dimensions (pH, alcohol, and total sulfure dioxyde) that resulted in a graph which both showed no clear correlation, and filled the entire volume nicely (all sub-part of the data volume had datapoints and density was not uniform. We then randomly selected 1000 datapoints.
Data mapping. Each datapoint is represented as a sphere (fig. 6), following Ammoura et al. recommendation to limit occlusion [16]. Datapoints positions are then based on co-ordinates computed from the original dataset using linear interpolation from 0 to 10.
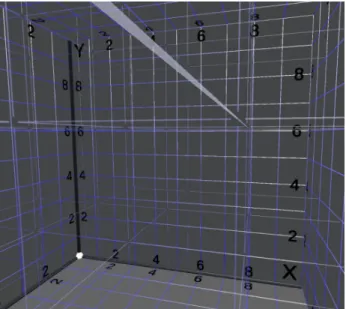
Condition 1 environment is a cube of 10 × 10 × 10 m with dark gray textured faces (fig. 3). We chose this size to be large
enough to reach the limit of stereoscopic depth perception. The origin is placed in one lower corner of the cubic volume, and represented as a small white sphere. All 3 axes are represented by thin black cylinders using a direct coordinate system representation with the y-axis going upward. Each axis has a label at its extremity indicating X, Y, or Z, and every 2 meters a label displays the value at this location. A 2D grid is displayed on every face of the cubic volume with a 1 meter step. An additional color is added to every line of the 2D grids going from white (at the end corresponding to 10) to dark blue (at the other end). The gradient is aimed at helping read grids and their value orientation, see fig. 3 for an illustration. We chose blue as it is the best color for color gradient perception and so as to not saturate our environment with colors, since colors can also be used for data representation.
Fig. 3: Condition 1 corresponds to a cubic environment of 10m*10m*10m with 2D grids displayed on each face. Each line of the 2D grid has a color gradient starting from white (representing a value of 10 of the parallel axis) to dark blue
(representing a value of 0).
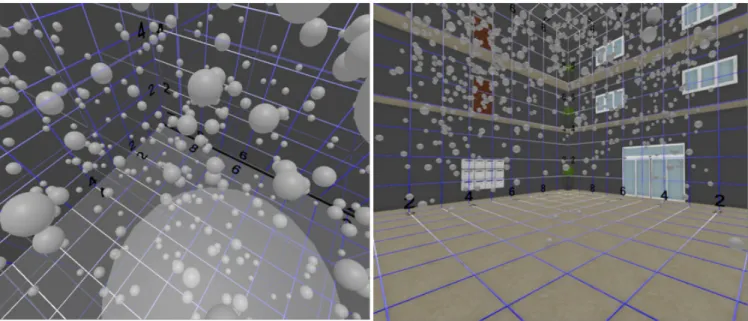
Condition 2 environment is based on the first one, with the addition of a 3d grid that occupies the whole data volume (fig. 4). The 3d grid is composed of thin cylinders meant to provide both orientation and depth cues information based on their size. Those cylinders are positioned every 2 meters, a step we chose after several trials, so as not to disrupt data analysis by adding too much information. A transparent material is applied to the 3d grid to limit data points occlusion. The motivation behind this condition was to provide information that could facilitate 3D projection, hence improving precision. Condition 3 environment also reuses the axes system and 2D grids of the first condition, with the addition of real-life elements that provide additional human-related natural spatial cues (fig. 5). We increased the world volume to 12 × 12 × 10 m to get further space for adding those elements outside of the main data volume. The represented human environment
Fig. 4: Condition 2 adds a 3d grid on top of condition 1 environment.
is a lobby of an apartment building. 3 floors are available respectively placed at 0, 4, and 7 meters on the Y-axis. Elevators are present on the front wall, and apartment doors on the side walls, at the exception of one side wall on the ground floor which features mailboxes. The back wall has an entrance door at the ground floor and windows on the upper floor. Plants have also been placed on one side wall to break the symmetry. All added elements have standardized dimensions, e.g. 2 × 1 m for apartment doors, or 0.5 × 0.5 m for mailboxes. Last, we changed the floor texture to a PVC lino with beige color since our early tests showed condition 1 floor color (plain dark gray) did trouble the understanding of the new dimensions of the volume. This color change was also in line with apartment building inspiration. The motivation behind this condition was twofold. First we thought that the use of spatial cues in all directions could improve how fast the user located herself in the volume. Second, we were willing to observe if the use of real-life elements for abstract data analysis could have an impact on the behaviour of users, e.g. if users would become more mobile or use their body more naturally.
For all conditions, a virtual circular platform (1.5m diame-ter, see fig. 6, left.) is located at the feet of the user. It uses a transparent light gray texture to limit occlusion of both the data points and the environment, while providing a support to limit user discomfort.
We used Unity3D to develop the environments, and an HTC Vive as the virtual reality headset.
C. Experimentation Protocol
The participants had first to sign a consent form and answer a demographic questionnaire, next they were equipped with the VR headset, and got oral explanation about the tasks. They went through 4 positions to discover the first environment (center bottom, next to the origin, center, next to top corner),
Fig. 5: Condition 3 adds natural spatial cues on top of condition 1 environment.
and then performed a set of tasks within, before repeating the discovery and the tasks in the second and the third one. Lastly they answered a post questionnaire, and an interview wrapped-up the session. Each session lasted about half an hour. The three conditions were proposed in a randomized order for each participant.
Participant were asked to perform two different tasks after being teleported to a position in the cube volume: 1/ determine each coordinate (x,y,z) of a specific data point (highlighted in red); 2/ determine the relative coordinates between two datapoints highlighted in green and red respectively. For each condition, task 1 was performed for 10 datapoints and task 2 for 5 datapoints couples.
Highlighted data and user positions were randomly chosen from two sets of predefined point(s) / position associations. The first set corresponds to task 1, it is composed of 100 point / position associations and was built by varying the following criteria: distance of the point from the user (close, medium, far), vertical distance of the point from the user (bottom, medium, top), occlusion of the point (none, a little, a lot), and distance of the point from the main grids of the environment (close, far). The second set corresponds to task 2, it is composed of 50 associations and was built by varying the following criteria: distance of point 1 from the user (close, medium, far), distance of point 2 from the user (close, medium, far), and distance between points (close, medium, far).
12 subjects (10 males and 2 females) from the University of Nantes and the Design School of Nantes participated to the study (mean age 25.8 ranging from 21 to 45). The experiment was run on a computer equipped with a CPU Intel Xeon ES-1630 v4 (3.70GHz), 16 Gb of RAM and a Nvidia GTX 1060 graphics card.
Fig. 6: Left: a scatterplot is presented in a cubic system of axes (1st experimental condition). Right: the same scatterplot within the same system of axes now enriched with natural spatial cues (3rd condition).
D. Data
We collected data from a demographic questionnaire: gen-der, age, experience in data analysis (4-points Likert scale), and experience in virtual reality (idem). During the experi-ment answers to the questions were provided orally by the participant and captured in a spreadsheet by the examiner. As soon as the last coordinate was given, time was automatically recorded, and the user proceeded to the next point to analyze, randomly chosen from the set of predefined points for the current task. Qualitative feedback was collected at the end of the session, with 3 questions that had to be answered for all 3 conditions. The first two questions were about how suitable the environment was for the tasks, respectively task 1 and task 2, on a 7-point Likert scale (7 being ”very suitable” and 1 ”not at all”). The last question was about how much they liked experiencing the environment (7 being ”very enjoyable” and 1 ”not at all”).
E. Results
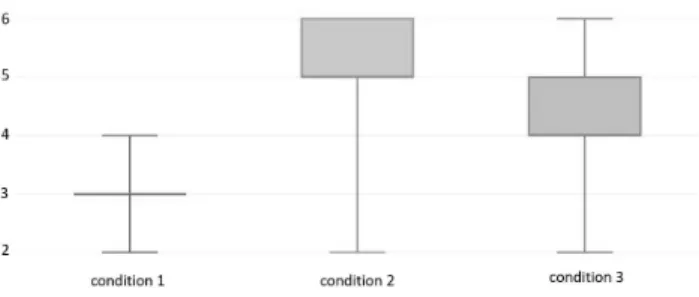
We computed the accuracy error for each answer using the Euclidean norm over the accuracy errors on the X, Y, and Z axes. The means and standard deviations for each condition are presented in table IV (a lower value indicated a better performance both for accuracy error and completion time). Qualitative answers results are presented with box plots in figures 7, 8, 9. A Friedman’s test was conducted for each of the 7 dependant variables, i.e. accuracy error for task 1, accuracy error for task 2, completion time for task 1, completion time for task 2, and qualitative feedback for each question. We used this non parametric test since our data was not respecting the condition required to run an ANOVA. The independent variables were the three conditions, resulting in a degree of liberty of 2.
condition 1 condition 2 condition 3 χ2
E(2) p value
t1 - acc (m) 0.79 ± 0.55 0.83 ± 1.08 0.83 ± 0.97 3.62 0.164 t2 - acc (m) 1.07 ± 0.69 0.8 ± 0.84 0.99 ± 0.67 3.73 0.155 t1 - time (s) 31.9 ± 14.1 37.7 ± 15.2 32.6 ± 11.5 9.45 0.009* t2 - time (s) 48.2 ± 22.8 52.6 ± 19.7 48.8 ± 18.6 3.9 0.142
TABLE IV: Means and standard deviations for accuracy errors and completion times for each condition and tasks, and chi square and p-value from Friedman’s test for each dependant objective variable, significant result are in bold
using α = 0.05 as a threshold.
To complete our analysis, pair wise comparison test were conducted for any dependant variable that had a significant result from the Friedman’s test. This resulted in condition 2 being significantly slower than condition 1 (p-value = 0.01), users found condition 2 significantly better for the first task than condition 1 (p-value < 0.001), condition 2 was found significantly better for the second task than condition 1 (p-value = 0.003), condition 3 was significantly preferred com-pared to condition 1 (p-value = 0.018).
F. Discussion
Results indicate that using a 3D grid may have a negative impact on speed when it comes to getting coordinate infor-mation from data points, with no apparent benefit in accuracy. However it is important to note that 11 participants preferred the use of the 3D grid over the condition 1 to perform both tasks. Moreover, 5 participants also commented in the post task interview that using this 3D grid allowed them to define directly a delta between two points for the second task while in condition 1 and 3 they had to determine the absolute coordinates of each point before computing the difference. Comments seem to align with the better mean accuracy of
the condition 2 for task 2, even though no significant effect could be found with the Friedman’s test. The one participant not rating condition 2 over condition 1 was according to him
Fig. 7: Box plot of the qualitative result (7-point Likert Scale) for the quality of the condition in regards to task 1.
Friedman’s test resulted in a chi square of 13.64 and a p-value of 0.001*
Fig. 8: Box plot of the qualitative result (7-point Likert Scale) for the quality of the condition in regards to task 2.
Friedman’s test resulted in a chi square of 10.71 and a p-value of 0.005*
Fig. 9: Box plot of the qualitative result (7-point Likert Scale) for the quality of the condition in regards to the user’s
enjoyment. Friedman’s test resulted in a chi square of 7.48 and a p-value of 0.024*
because: ”the 3D grid was distracting”. To solve this latest issue, we can imagine the use of a non permanent 3D grid.
Condition 3 does not seem to provide any significant benefit over condition 1 from the speed and accuracy perspective. However users did rate condition 3 better than condition 1, according to the mean value but with no significant effect. This condition was significantly preferred by users compared to condition 1. This shows a potential benefit for user engage-ment, and one user even claimed that: ”I was more confident about my answers when I was in the second environment” (condition 3 for this specific user). Interestingly, 3 users tried to use their own body as a reference metrics for the second task, extending their arms or using their own size, a behaviour that did not occur in the two other conditions. So if our implementation of real life human cues may not have been efficient, we consider that there are indications that natural cues should not be abandoned and need further design exploration.
Lastly, users never mentioned the color gradients on the grids lines, that were supposed to help them know at all time the orientation of each axis. So from users’ remarks we cannot conclude if they actually served this purpose. The only element of answer that may be related is that the beginning and the end of an axis were inverted (e.g. giving an answer of 7 instead of 3) only 2 times out of the 360 answers provided for task 1. This may a hint that the cubic system with the 6 grids (condition 1) was sufficiently well designed to avoid such errors, however we cannot say if the color gradient had an impact on it, which calls for further study.
VI. CONCLUSION
In this paper we stated that the development of Immersive Analytics, which is still in its infancy, calls for a renewed understanding of coordinate system representations that may lead to the elicitation of best practices and guidelines for IA systems design. We proposed a task-based definition for coordinate systems representations, as well an immersive ana-lytics oriented design space, and an exploratory study around the use of cubic grids for multidimensional data analysis. More work is however still needed both for the design space, which remains preliminary and calls for refinement; and for the practical design, implementation, and test of coordinate system representations in immersive settings.
REFERENCES
[1] S. K. Card, J. D. Mackinlay, and B. Shneiderman, Eds., Readings in Information Visualization: Using Vision to Think. San Francisco, CA, USA: Morgan Kaufmann Publishers Inc., 1999.
[2] M. Macdonald-Ross, “How numbers are shown,” AV communication review, vol. 25, no. 4, pp. 359–409, 1977.
[3] T. Munzner, Visualization analysis & design. A K Peters/CRC Press, 2015.
[4] T. Chandler, M. Cordeil, T. Czauderna, T. Dwyer, J. Glowacki, C. Goncu, M. Klapperstueck, K. Klein, K. Marriott, F. Schreiber, and E. Wilson, “Immersive Analytics,” in 2015 Big Data Visual Analytics (BDVA). Hobart, TAS, Australia: IEEE, sep 2015, pp. 1–8.
[5] I. Herman, G. Melancon, and M. Marshall, “Graph visualization and navigation in information visualization: A survey,” IEEE Transactions on Visualization and Computer Graphics, vol. 6, no. 1, pp. 24–43, 2000.
[6] N. Sawant, C. Scharver, J. Leigh, A. Johnson, G. Reinhart, E. Creel, S. Batchu, S. Bailey, and R. Grossman, “The Tele-Immersive Data Explorer: A Distributed Architecture for Collaborative Interactive Visu-alization of Large Data Sets,” in 4th International Immersive Projection Technology Workshop, Iowa, USA, 2000.
[7] L. Wilkinson, The Grammar of Graphics. Springer Science & Business Media, 2006.
[8] E. R. Tufte, The Visual Display of Quantitative Information. Cheshire: Connecticut Graphics Press, 1983.
[9] P. S. Heckbert, “Nice numbers for graph labels,” Graphics gems, pp. 61–63, 1990.
[10] J. Talbot, S. Lin, and P. Hanrahan, “An extension of Wilkinson’s algorithm for positioning tick labels on axes,” in IEEE Transactions on Visualization and Computer Graphics, vol. 16, no. 6, 2010, pp. 1036– 1043.
[11] A. Inselberg and B. Dimsdale, “Parallel Coordinates for Visualizing Multi-Dimensional Geometry,” in Computer Graphics 1987. Springer Japan, 1987, pp. 25–44.
[12] C. Tominski, J. Abello, and H. Schumann, “Axes-based visualizations with radial layouts,” in Proceedings of the 2004 ACM symposium on Applied computing - SAC ’04, Nicosia, Cyprus, 2004, pp. 1242–1247. [13] J. H. T. Claessen and J. J. van Wijk, “Flexible Linked Axes for
Multivariate Data Visualization,” IEEE Transactions on Visualization and Computer Graphics, vol. 17, no. 12, pp. 2310–2316, dec 2011. [14] J. Symanzik, D. Cook, B. D. Kohlmeyer, and C. Cruz-Neira, “Dynamic
Statistical Graphics in the CAVE Virtual Reality Environment,” in Proc. Dynamic Statistical Graphics Workshop, vol. 29, 1996, pp. 41—-47. [15] H. R. Nagel, E. Granum, and P. Musaeus, “Methods for Visual Mining
of Data in Virtual Reality,” in Proceedings of the International Workshop on Visual Data Mining, Sydney, Australia, 2001, pp. 13–27.
[16] A. Ammoura, O. R. Za´ıane, and Y. Ji, “Immersed Visual Data Mining: Walking the Walk,” BNCOD, vol. 18, pp. 202–218, 2001.
[17] H. Azzag, F. Picarougne, C. Guinot, and G. Venturini, “VRMiner: a tool for multimedia database mining with virtual reality,” Processing and Managing Complex Data for Decision Support, no. May 2014, pp. 318–339, 2006.
[18] B. S. Meiguins, R. M. C. do Carmo, L. Almeida, A. S. Gonc¸alves, S. C. V. Pinheiro, M. de Brito Garcia, and P. I. A. Godinho, “Mul-tidimensional information visualization using augmented reality,” in Proceedings of the 2006 ACM international conference on Virtual reality continuum and its applications - VRCIA ’06. Hong Kong, China: ACM Press, 2006, p. 391.
[19] A. Datey, “Experiments in the Use of Immersion for Information Visualization,” Human Factors, 2002.
[20] C. Donalek, S. G. Djorgovski, A. Cioc, A. Wang, J. Zhang, E. Lawler, S. Yeh, A. Mahabal, M. Graham, A. Drake, S. Davidoff, J. S. Norris, and G. Longo, “Immersive and collaborative data visualization using virtual reality platforms,” in 2014 IEEE International Conference on Big Data (Big Data). Washington, DC, USA: IEEE, oct 2014, pp. 609–614. [21] A. Fonnet, F. Melki, Y. Pri´e, F. Picarougne, and G. Cliquet, “Immersive
Data Exploration and Analysis,” in Student Interaction Design Research conference, Helsinki, Finland, may 2018, pp. 1–8.
[22] M. Cordeil, A. Cunningham, T. Dwyer, B. H. Thomas, and K. Marriott, “ImAxes: Immersive Axes as Embodied Affordances for Interactive Multivariate Data Visualisation,” in Proceedings of the 30th Annual ACM Symposium on User Interface Software and Technology - UIST ’17. Qu´ebec City, QC, Canada: ACM Press, 2017, pp. 71–83. [23] A. MacLean, R. M. Young, V. M. E. Bellotti, and T. P. Moran,
“Questions, options, and criteria: Elements of design space analysis,” Hum.-Comput. Interact., vol. 6, no. 3, pp. 201–250, Sep. 1991. [24] S. Few, Information Dashboard Design. O’Reilly, 2006.