HAL Id: hal-01619259
https://hal.archives-ouvertes.fr/hal-01619259
Submitted on 7 Nov 2018
HAL is a multi-disciplinary open access
archive for the deposit and dissemination of
sci-entific research documents, whether they are
pub-lished or not. The documents may come from
teaching and research institutions in France or
abroad, or from public or private research centers.
L’archive ouverte pluridisciplinaire HAL, est
destinée au dépôt et à la diffusion de documents
scientifiques de niveau recherche, publiés ou non,
émanant des établissements d’enseignement et de
recherche français ou étrangers, des laboratoires
publics ou privés.
Powder flow dynamics in a horizontal convective
blender: Tracer experiments
Leonard Legoix, Cendrine Gatumel, Mathieu Milhé, Henri Berthiaux, Vadim
Mizonov
To cite this version:
Leonard Legoix, Cendrine Gatumel, Mathieu Milhé, Henri Berthiaux, Vadim Mizonov. Powder flow
dynamics in a horizontal convective blender: Tracer experiments. Chemical Engineering Research and
Design, Elsevier, 2017, 121, p. 1-21. �10.1016/j.cherd.2017.03.002�. �hal-01619259�
Powder flow dynamics in a horizontal convective
blender: Tracer experiments
Léonard Legoix
a, Cendrine Gatumel
a, Mathieu Milhé
a, Henri Berthiaux
a,∗,
Vadim Mizonov
baUniversité de Toulouse,Centre RAPSODEE,CNRS UMR 5302,Ecole des Mines d’Albi,Campus Jarlard,81013 Albi
Cedex 09,France
bDepartment of Applied Mathematics,Ivanovo State Power Engineering University,Rabfakovskaya 34,153003
Ivanovo,Russia Keywords: Convective blender Powder stirring Flow mechanism Free-flowing powder Cohesive powder Particulate tracer
a b s t r a c t
The stirring of powders of different flow behavior, namely one free-flowing (semolina) and one cohesive (lactose) is investigated in a four-blade horizontal convective mixer. The kinetics of homogenization are investigated for each powder separately, thanks to tracer experiments performed with colored semolina and talc, respectively tracers of the free-flowing and of the cohesive powder. Different stirring times and rotational speeds of the impeller are studied. Three flow mechanisms are identified: convection, avalanching and diffusion. Convection conveys important amounts of powder near the blades, while the avalanching mechanism takes place on the powder bed surface. Diffusion, which is the slow-est mechanism, allows powder transport to the zones of the blender in which blades do not pass through. The final tracer dispersion in the blender’s volume is better for the free-flowing powder than for the cohesive powder, and is enhanced by an increase of the rotational speed. A simple Markov chain model based on the identified mechanisms is developed as a basis for discussion of the results.
1. Introduction
Powder mixing is an operation that concerns many industrial fields. It is an important step since it allows combining the properties of dif-ferent powders into a single product that has to meet specifications and standards based on the homogeneity of the mixtures. The flow of a powder depends on the physical properties of its particles, like size and shape (seeAoki and Suzuki, 1971orFu et al., 2012). The envi-ronmental factors, such as ambient hygrometry and temperature, can change drastically powder behavior and lead to strong industrial issues as stated by the recent papers ofChirone et al., 2016orLumay et al., 2016. Two kinds of powders are distinguished: free-flowing powders and cohesive powders. Free-flowing powders can be considered as pow-ders for which grains can move independently from each other. On the contrary, cohesive powders are made of particles that interact through attractive forces, such as capillary forces induced by the presence of
∗Corresponding author.
a liquid. Concerning dry powders, this attraction is mainly due to Van Der Waals forces that can be considered as more important than gravity when particle size is smaller than 100 !m (Bridgwater, 1976).
Two main technologies are employed to mix powders: convective mixers for which the vessel is fixed and an impeller allows the motion of the bulk; tumbling mixers for which the vessel itself is put into motion. Powder mixing in tumbling blenders have been studied, for both free-flowing and cohesive powders (Aoun-Habbache et al., 2002; Brone and Muzzio, 2000; Massol-Chaudeur et al., 2002; Mayer-Laigle et al., 2015; Wightman and Muzzio, 1998a, 1998b). These mixers are less adapted than convective ones for cohesive powder blending, because the avalanching movement located mainly at the powder bed surface can induce powder agglomeration (Bonamy, 2001). Convective blenders seem more suited to mix cohesive powders, as long as the impeller can be rotated at a sufficiently high speed to break these agglomer-ates.
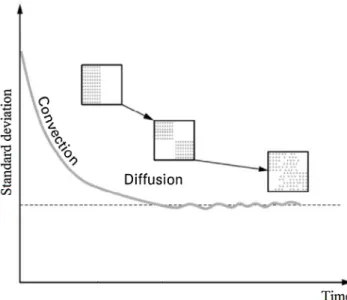
Fig. 1 – Classic powder mixing kinetic curve showing the associated predominant mechanisms (Rose, 1959).
Mixture characterization consists in analyzing the dispersion of a key component in the whole powder bed or at the outlet of the mixer, at the scale of scrutiny which is defined by the final use of the product (Cuq et al., 2013). In most cases, the proportion of the key component is measured from different samples withdrawn from a batch and used to derive the standard deviation of the distribution of the compositions, and in turn the Relative Standard Deviation (RSD). The RSD is most of the time employed to accept or reject a mixture in the industry. Some-times, mixing indices are derived to compare these values to extreme cases (Ashton and Valentin, 1966; Lacey, 1943; Smith, 1955).
Three main transport mechanisms are identified during powder mixing operations: convection, diffusion and shearing (Lacey, 1954). Convection can be described as the movement of adjacent groups of particles. Diffusion is a movement of the powder at a scale closer to that of the particle’s size. Shearing is characterized by the slipping of planes within the mixture. Shear zones can be observed between the clumps formed by mixing through convection, so that shear cannot occur alone (Bridgwater, 1976). A classical mixing kinetic is character-ized by a monotonous decrease of the standard deviation with mixing time (Fig. 1). A sharp decrease at the beginning is attributed to the predominance of the convection mechanism, through the motion of blocks of particles, at the scale of the blades for example. When the scale of heterogeneous zones in the mixture is below that of the blocks of particles, convection is no longer efficient in the decrease of the standard deviation. As a result, diffusion becomes the predominant mechanism and will be responsible for the subsequent decrease of the curve and an intimate mixture. When the mixing time is long enough, the standard deviation reaches a minimum value and sometime oscil-lates around it. These oscillations can indicate a competition between mixing by diffusion and segregation by percolation, which is due to differences in size, shape or density of the particles. At the indus-trial scale, the operation should be stopped at the minimum of this curve.
As stated above, mixing mechanisms are responsible for particle—or particulate ensembles—mobility. Their identification is key in the understanding of flow in the mixer or at the vicinity of mixing media (blades, screw, ribbon, etc.), towards more general goals such as process optimization. It is therefore not a surprise to see that many studies have focused on flow understanding through the use of tracers and the development of tracking techniques in mixing operations over the past 20 years or so. According to Kaye (Kaye, 1997), “a tracer is an ingredient that is meant to trace out movements within a powder mixing system. . . One uses tracers to find out directions and pathways within a powder mixer”. In the case of powder mixing, however, a distinction must be made according to the case studied:
- A is a single powder that is representative of a flow category, i.e. cohesive, free-flowing, etc. The objective is to apprehend the general flow pattern inside the mixer for powders of the same type ( Aoun-Habbache et al., 2002; Marikh et al., 2006; Barling et al., 2015). In this case, a particulate product A’ is chosen for its flow properties that are assumed—or demonstrated to be—identical to those of A, and is employed as a tracer of A. Particles of A’ can be placed in specific locations in the mixer’s volume, their concentrations in any loca-tions (or cells) of the whole volume being detected with time. This also allows to calculate the RSD of A’ with respect to A, and further determine “mixing” kinetics. The term “mixing” is employed despite the fact that it does not really fit with the situation, which refers more to “stirring”.
- A and B are two powders of different nature, corresponding to either a model case or a specific industrial case. If A’ is a tracer of A, it can be employed as above and the results may allow to figure out whether the presence of B changes A’s flow or not. In any case, the RSD can be calculated and the mixing kinetics can be described. Of course, the same procedure should be undertaken for B. While this would be the correct way of addressing a two-fluids (or particles) flow tracing protocol, to our knowledge no study has ever reported it, always considering the next case held true.
- B is a key component in the mixture and is considered as a tracer of the bulk. While this is obviously a strong hypothesis, it has been extensively employed over the years as it allows the derivation of the mixing kinetics in a much easier way. It is also supported by the development of single-particle tracking techniques as applied to mixing (Larachi et al., 1995; Hiseman et al., 2002; Bridgwater, 2003) to detect the tracer’s presence in the whole mixer’s volume in real time.
In the present work, we aim to understand powder flow inside a prototype convective blender that can be representative of the whole spectra of convective blenders. The situation of this study is therefore corresponding to the first of the 3 cases developed in the above para-graph. Thanks to tracer experiments performed for either free-flowing or cohesive systems, we will focus on powder flow at the vicinity the blades and study the impact of the impeller’s rotational speed that is expected to play an important role in the flow dynamics.
2.
Materials and methods
2.1. Powders used
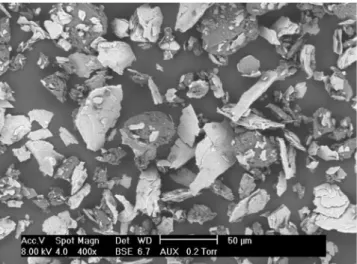
Two powders are used in this study: a free-flowing one (semolina) and a cohesive one (fine lactose). Both are of polyg-onal morphology, as shown by SEM pictures inFig. 2.Table 1 gathers the main properties of these two powders, d50being
the median diameter measured by LASER diffraction (Mas-tersizer3000, Malvern) under an air pressure of 3.5 bar. The particle density !phas been measured thanks to an
Accumu-lator Pyc 1330 (Micromeritics) with the 10 cm3cell. The bulk
and tapped densities, !band !t, have been measured with a
tap and bulk density measuring device (Erweka SVM 22) with 110 g of powder, the tapped density being measured after 1000 taps. The important Carr Index (CI) of the fine lactose, greater than 22%, means that this powder is effectively cohesive. The Carr Index of semolina, smaller than 15%, suggests to classify this powder as free-flowing (Leturia et al., 2014).
2.2. Prototypal convective blender
The blending prototype considered is a multipurpose and transparent convective mixer, in which operating parameters such as blade number, blade angle, wall position, blending vol-ume or vessel angle can be varied. The configuration chosen here consists in four straight blades for a vessel positioned
Fig. 2 – SEM pictures of semolina (a) and fine lactose (b). Table 1 – Main physical powder properties.
Powder d50(!m) d10(!m) d90(!m) !p(kg m− 3) !b(kg m− 3) !t(kg m− 3) CI (%) FRI
Semolina 312 197 467 1463 679 720 5.8 0.89
Fine lactose 26 4 67 1539 495 638 22.5 2.09
horizontally (Fig. 3). The distance between lateral walls is 13 cm, one of the walls being close to the blades with a 0.5 cm gap. Agitation speeds can reach 191 rpm.
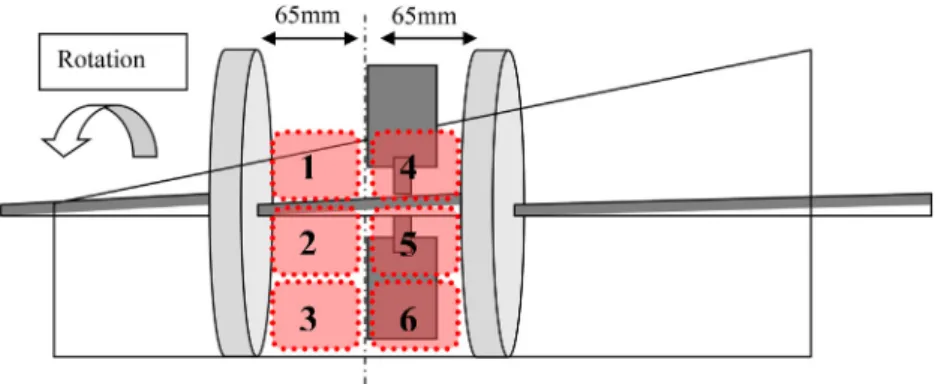
The blender volume is artificially divided into six zones or cells. These zones are of identical volumes and are rep-resented schematically inFig. 4. Five of these six zones will be filled with the powder whose flow is studied (either semolina or lactose), the last zone being initially occupied by a tracer.
For each experiment, the mass of powder placed in the blender is about 3232 g for semolina and 2357 g for fine lactose (including the tracer), corresponding to a volume bulk filling ratio f of 0.83. This filling ratio is calculated using bulk density !b,the mass of powder poured mpand the volume of the mixer
Vtank.
f= mp !b.Vtank
Fig. 4 – Front view of the convective blender and approximate position of the six zones. The white arrow represents the real direction of rotation of the system.
Table 2 – Product and process parameters investigated for mixing experiments.
Powder Semolina Fine lactose
Agitation speed " (rpm) 57 143 57 143
Stirring time t (s) 4 10 60 300 4 4 10 300 4 10
The powder inside each cell can be sampled layer by layer with a system of aspiration. If some powder is present over the top of the zones 1 or 4, it will be sampled and considered as belonging to these.
2.3. Tracer experiments
2.3.1. Experimental procedure
A typical experiment of powder stirring consists in filling the blender with a powder and its corresponding tracer, agitating the powder bed at a given rotational speed ω for a duration t, and then sampling the whole powder bed according to the six cells defined previously. For each of the two powders stud-ied, two agitation speeds and several stirring times are chosen (Table 2).
For each experiment, three different initial positions of the tracer are studied: close to the free-surface (zone 1), far from blades and surface (zone 3), in the blade’s direct action zone (zone 4).
The mean powder weights contained into each cell, for each experiment of stirring made in this work, are represented inTable 3. The fluctuating values of the mass are mainly due to the different state of compaction of the powder, depend-ing on its position in the vessel. The angle of repose of the powder near the blades and near the walls has an impact on the mass sampled too. For semolina, the mass does not vary a lot from zone to zone, nevertheless it can be seen that the mean values are greater for zones 1 and 4 that are closer from the free-surface. Concerning lactose, the cells 1 and 4 contain also more powder, as well as zone 3 for which powders may be compacted at the bottom of the blender.
2.3.2. Determination of tracer composition in cells
Two tracers of different nature have been chosen separately for semolina and lactose, the main criteria being the size of the particles to limit segregation. Because of the different choices of tracer, the experimental protocol to determine the mass proportion in tracer inside the six zones of the mixer will be different.
2.3.2.1. Semolina tracer. The tracer that has been considered
for semolina is made of semolina itself, colored by an iodine solution that has been previously prepared by dilution of solid
iodine in a 96% ethanol-water solution. After impregnation of semolina, the black-colored semolina is stirred with a spat-ula and dried with hot air, in order to avoid agglomeration of grains.
Image analysis seems to be a good technique to analyze a tracer in a powder blend, as already shown in literature (Daumann et al., 2009). In the present work, an image anal-ysis technique has been set up to quantify the proportion of colored semolina. It has been calibrated for 20 g of mix-ture. The sample is poured in a 19 cm circular dish, and 8 pictures are taken randomly with a Keyence® optical micro-scope equipped with a x50 lens. The size of each picture is about 7 × 5 mm. The mean proportion of the surface occupied by colored semolina is evaluated with a Matlab®program for the 8 pictures (seeFig. 5a). The mass proportion of the sample in colored semolina can be calculated (Fig. 5b) thanks to a main second order polynomial function for proportions between 10% and 90%, and to two linear correlations for proportions smaller than 10% and greater than 90%. The calibration points have been measured twice, with different batches of colored semolina to make sure that the tracing technique and the microscope counting are reproducible. The average values are used for the calibration.
This allows an accurate calculation of the proportion of tracer in 20 g of sample, but cannot be done for a single cell of the mixer that contains 20–30 times this quantity. For this, each sampled zone is previously homogenized with a Turbula® T2F mixer for 3 min at an agitation speed of 46 rpm. The pow-der is then poured on a plate, and one 20 g sample of semolina (and its tracer) is randomly taken out. The homogenization of the zone is sufficient, so that the 20 g can be assumed to be representative of the whole composition of the zone, with a precision of about 1%.
2.3.2.2. Fine lactose experiments. Talc has been employed as
tracer for fine lactose. Measurements with the FT4 Freeman rheometer show that it has a Flow Rate Index about 2.1, which is similar to that of lactose. The analysis of the tracer content of a fine lactose-talc mixture is carried out by thermal degra-dation of lactose. Samples of weights around 2 g are heated up to 650◦C for 1 h in ceramics crucibles in order to sublimate the
lactose. Talc mass lost is only about 1%. The precision of the scale (Balco®), of the order of the milligram, allows to
deter-Table 3 – Powder weights measured in each zones of the blender (g).
Zone 1 2 3 4 5 6
Semolina (g) 565 ± 55 509 ± 36 490 ± 57 602 ± 29 552 ± 58 484 ± 57
Lactose (g) 425 ± 73 344 ± 29 408 ± 63 414 ± 39 361 ± 74 379 ± 64
Fig. 5 – Method for sampling and image capture for semolina experiments (a); calibration curve for image analysis of semolina-colored semolina mixtures (b).
mine the mass proportion in talc xtwith a precision smaller
than 1%, knowing the powder masses before and after heating, m0and mf respectively (Eq.(2)).
xt= 101
mf
m0 (2)
As for semolina experiments, the analysis of tracer content in an entire zone is not possible, since the maximum mass that could be analyzed is about 2 g. Again, the homogeniza-tion of sampled zones is made with the Turbula®T2F mixer
for 5 min with an agitation speed of 96 rpm. Then the powder is poured in a plate and 12 samples of about 2 g are randomly taken before being laid into a crucible. The compositions of all of these samples are analyzed by the thermal degrada-tion procedure previously described and the mean value of these 12 compositions will represent the global composition in tracer of the zone, with a good precision. This has been verified with two Turbula®homogenizations of 393 g of pow-der (the mass of fine lactose and tracer poured in the mixer, divided by six), with a known tracer content of 16.7% and 5.0%.
Fig. 6 – SEM picture of a semolina-lactose mixture showing the absence of ordered mixture.
The respective compositions measured by the described tech-nique were 16.7% and 4.8%.Fig. 6shows a SEM photograph of the lactose-talc mixture.
2.3.3. Tracer homogenization kinetics
Knowing the mass of powder in a given zone and the mass proportion of tracer in this zone as given by the analytical techniques described above, it is possible to calculate the cor-responding mass of tracer. The tracer mass fraction in zone i, will be denoted Xi, the sum of these fractions being equal to 1
at any time.
The Relative Standard Deviation (RSD) is the index chosen here to quantify the homogeneity of the tracer–powder mix-ture, for a given time and rotational speed. The RSD can be calculated from the standard deviation # of the tracer mass proportion in each zone and the tracer mean composition in the mixer, which is equal to 0.167 since only one zone is filled initially with it (Eq.(3)). The more the tracer concentrations are close to each other, the more the RSD approaches zero.
RSD=0.167# (3)
3.
Experimental results
In this section, we present the different stirring kinetics that have been obtained, according to the rotational speed of the blades (57 rpm or 143 rpm) and the nature of the powder (free-flowing or cohesive). In each experiment, the tracer is placed initially in one zone: zone 4, 1 or 3. These three zones, chosen for their locations with respect to the blades and the free-surface, will help in the identification of the mechanisms at play. Pictures taken during the experiments with semolina will support this, something which is not possible for the cohesive powder since fine lactose and its tracer share a similar color. It is worth noting that no variability study has been undertaken here, so some results may be taken precautiously.
3.1. Low-speed stirring of free-flowing powders
The focus is made here on experiments performed with semolina, the rotational speed of the blades being 57 rpm. Under these operating conditions, the flow regime that takes place is rolling, which is characterized by a movement of avalanching of the powder carried by the blades, since gravity is greater than centrifugal force.
3.1.1. Tracer initially in zone 4
When the initial position of the tracer is in zone 4, a fast dis-sipation of the tracer to the other zones of the blender can be observed (Fig. 7). After four seconds of agitation, the mass proportion of tracer is almost divided by three, while the con-tents in tracer for zones 5 and 6 are increasing. After 60 s of stirring, the tracer contents in zones 4, 5 and 6 do not change anymore and are close to each other. This is typical of a con-vection mechanism where the blades, which are directly in contact with zone 4, move important amounts of powder. This convection seems to take place mainly in zones 4, 5 and 6 for which the blades are passing through. The tracer content in zone 1 increases slowly as compared to these zones, to reach a constant value after 60 s of stirring. The tracer has more dif-ficulties to reach zone 2 and even more to reach zone 3. The increase of tracer content in these zones that are not directly
Fig. 7 – Evolution of the composition of each zone in the mixer for semolina, with a blade speed of 57 rpm and tracer initially placed in zone 4.
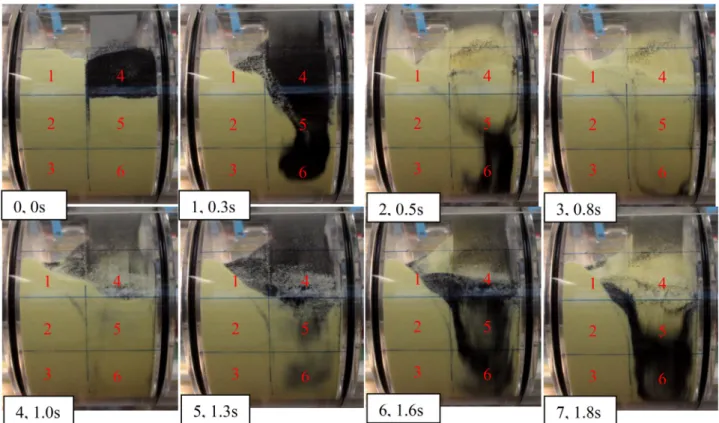
Fig. 8 – Front view of the mixer after each blade pass with indications on bottom left (number of blade pass, stirring time), tracer has been placed initially in zone 4, the blade rotational speed is 57 rpm (zone number indicated in red on each pictures). (For interpretation of the references to color in this figure legend, the reader is referred to the web version of this article.)
in contact with the blades suggests that other mechanisms, conveying smaller amounts of powder, may coexist.
Convection has also been evidenced with a video camera recording (Fig. 8). It is clear that after each blade pass, an important proportion of the powder is exchanged between zones 4, 5 and 6 which includes the volume occupied by the blades.
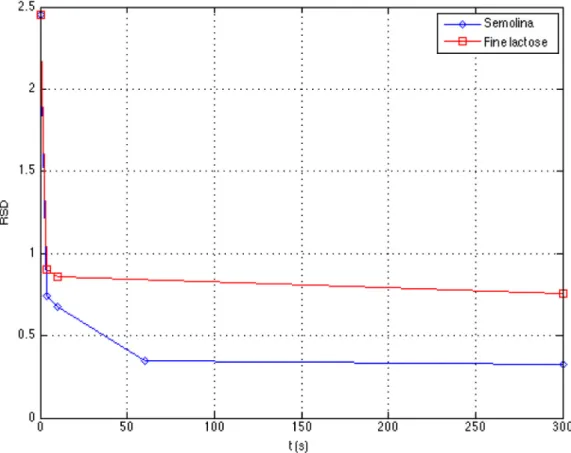
The RSD decreases monotonously with mixing time (Fig. 9), up to 60 s, afterwards if decreases slowly to remains at a value close to 0.33. This final RSD is far from zero, a value that would have corresponded to a homogenous dispersion of the tracer in the blender at the scale of the cells. This may be attributed to the small quantities of powder that are exchanged between directly agitated zones and zones that are out of reach for the blades. The fast decrease of RSD during the first minute of agi-tation shows the predominance of the convection mechanism that homogenizes the tracer over zones 4, 5 and 6.
3.1.2. Tracer initially in zone 1
When the tracer is initially placed in zone 1, its concentration stabilizes in each zone after 60 s of stirring (Fig. 10). The tracer concentrations in zones 4, 5 and 6 are evolving the same way: if the tracer is present in one of these zones, it is quickly homog-enized with the two others, due to the convection mechanism identified above. The tracer concentration in zone 1 decreases sharply, but not as fast as for the previous situation. In this case, this is not convection that moves powder from the zone 1 to others, but avalanches. This can be seen onFig. 11and explains the fast transfer of particles from zone 1 to other zones, despite the blades are not passing through this zone. Part of the powder bed is conveyed higher than zone 4 in the back of the blender and partly falls in zone 1, while part of the powder in zone 1 goes back on the front of the zone 4. This
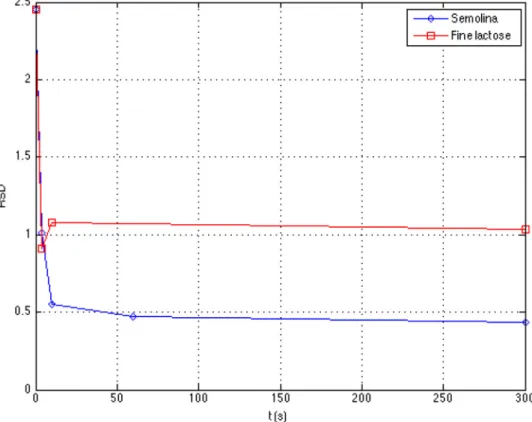
mechanism is slower than convection and allows the tracer present initially in zone 1 to interact with the agitated zones. All of this is transcribed by the RSD’s sharp decrease until the reach of a value comprised between 0.4 and 0.5 (Fig. 12). The avalanching mechanism creates an important flow of tracer towards zones 4, 5 and 6, so that the RSD decreases in a similar way as when the tracer is placed initially in zone 4. However the final mixing quality is slightly worse (RSD close to 0.44), since a part of the tracer present in zone 1 cannot communicate with the other zones.
3.1.3. Tracer initially in zone 3
The dissipation of the tracer when initially placed in zone 3 is presented inFig. 13, and may help to gain more insight into the slower mass transport mechanisms acting in this zone. A significant decrease of concentration in zone 3 is measured during the first ten seconds, after which the mixing of the tracer become much slower. It reaches a value close to 0.5 after 5 min of stirring. A more important quantity of powder remains in zone 3, as compared to the situations reported in the two previous sections. The concentrations in zones 1, 4, 5 and 6 increase and are all smaller than 0.1. A certain quantity of tracer seems to transit from zone 3 to zone 2, since after 60 s of stirring the decrease of concentration in zone 3 is fol-lowed by an increase of concentration in zone 2. This suggests the presence of a mass transport mechanism which is slower than convection and avalanching, between zones far from the free-surface and in which blades do not pass through.
The decrease of tracer proportion in zone 3, at the begin-ning of agitation, is mainly due to the fact that a part of zone 3 is dragged by shearing to the zones where blades are pass-ing. Since this shearing mechanism is relatively slow and may be viewed at a scale close to that of the particles, it will be
Fig. 9 – Compared homogenization kinetics for lactose and semolina’s tracers when they are initially placed in zone 4, ω= 57 rpm.
Fig. 10 – Evolution of the composition of each zone in the mixer for semolina, with a blade speed of 57 rpm and colored semolina initially placed in zone 1.
considered as a horizontal diffusion mechanism in this work. Indeed, the powder repartition inside zone 3 is far from being homogenous, a part of it being occupied by the tracer only (Fig. 14).
As in previous experiments, the RSD decreases sharply at the beginning of the operation, and more slowly after 10 s (Fig. 15). This slow decrease of the RSD attests the presence of the diffusion mechanism in the powder bed. The increase of tracer concentration in zone 2, and the decrease in zone 3 during the same time suggests that a vertical diffusion mech-anism may take place at least between these two zones.
3.2. Low-speed stirring of cohesive powders
This part focuses on the stirring experiments performed with lactose and its tracer at a rotational speed of 57 rpm, which corresponds to the rolling flow regime. Similar experiments as for semolina are performed. However, since three stirring times are investigated, the kinetic data is less accurate. The RSD obtained will be directly compared to that of semolina experiments presented in the last part, in order to evaluate the main differences between free-flowing and cohesive pow-ders.
Fig. 11 – Back view (left), front view (middle) and top view (right) of the mixer after 4 s of mixing at 57 rpm. Black arrows are showing the avalanching flow observed on the free-surface, white arrows are showing the blade rotation direction.
Fig. 12 – Compared homogenization kinetics for lactose and semolina’s tracers when they are initially placed in zone 1, ω= 57 rpm.
3.2.1. Tracer initially in zone 4
With an initial placement of tracer in zone 4, its proportions in cells 1, 4, 5 and 6 is stationary after just 4 s (Fig. 16). This indicates that the mechanism of convection described for semolina is also predominant for fine lactose. The mass frac-tion of tracer in zone 1 at a stirring time of 5 min is close to that in zones in direct contact with the blades. The tracer clearly cannot access zones 2 and 3, meaning that negligible exchange of powder takes place between these zones and the others. As the Carr Index may suggest, the compressibility of this powder is significant (seeTable 1), and may have led to the formation of blocks of packed powder in these zones.
The RSD has been calculated in the same way as for semolina mixtures and is represented inFig. 9. The evolution of the RSD is similar between the two particulate materials, with a sharp decrease of the RSD during the first seconds,
char-acteristic of the convection mechanism, followed by a slow decrease, typical of the diffusion mechanism. However, for the cohesive powder, the RSD is greater whatever the stirring time. This may be attributed to the unmixed powder that remains in zones 2 and 3, for which the zero content in tracer gives rise to high RSD’s.
3.2.2. Tracer initially in zone 1
When the tracer is initially placed in zone 1 (Fig. 17), an impor-tant decrease at the beginning of stirring takes place, attesting that a fast exchange of powder occurs between zone 1 and its neighboring zones, but after 5 min of stirring the proportion in tracer remains at 0.51, whereas it decreased to a value of 0.27 for semolina in the same conditions. A fraction of the tracer in zone 1 is not in contact with blades and remains in this zone because of the cohesion forces that hold the parti-cles together and limit the avalanching flow mechanism. As a
Fig. 13 – Evolution of the composition of each zone in the mixer for semolina, with a blade speed of 57 rpm and colored semolina initially placed in zone 3.
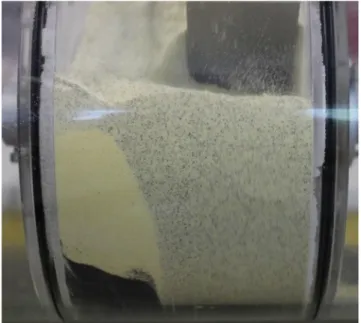
Fig. 14 – Front view of the blender after 5 min of stirring of semolina at 57 rpm, tracer initially placed in zone 3. result, the avalanching mechanism described for semolina is
less important for fine lactose.
The RSD measured in these operating conditions decreases quickly during the first seconds of stirring and then reaches a steady state for stirring times greater than 10 s (Fig. 12). Considering the RSD as a parameter to quantify mixing, the cohesive powders are clearly more difficult to blend than free-flowing powders when the tracer is placed initially in zone 1. It is also worth noting that stirring times longer than 60 s do not improve homogeneity, and that this homogeneity is worse compared to that obtained when the tracer is initially placed in zone 4.
3.2.3. Tracer initially in zone 3
If the tracer is initially placed in zone 3, a large amount of tracer, which is more important than for semolina, remains in this zone and is not put into contact with the neighboring zones (Fig. 18). After 5 min of mixing, the tracer proportion in zone 3 is 0.87 whereas for semolina this value was about 0.45. In all others zones a very small, steady and identical content
in tracer is measured. The diffusion mechanism that was still efficient for semolina to displace tracer particles of this “iso-lated” zone, is no longer able to disrupt the compacted lactose powder at the scale of individual particles.
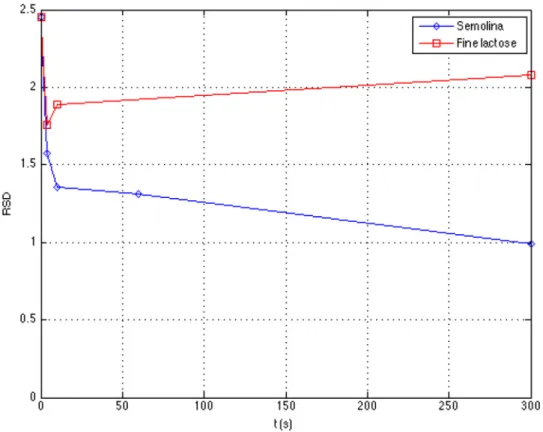
The RSD of fine lactose decreases sharply during the first seconds of agitation to reach a steady state around a value of 2 (seeFig. 15). As for free-flowing powders, a shearing may take place in a limited part of zone 3, close to the blades, the other part being almost a dead zone.
More globally, it has been shown that, whatever the case, the powder is never perfectly stirred since the steady-RSD is far from zero. The minimum is reached with a RSD value of 0.33 for the free-flowing material, when the tracer is initially placed in the blade zone (cell 4). It is clear with the RSD calcula-tions that the cohesive powder is stirred with more difficulties, the worst case being that of a tracer placed at the bottom of the vessel, out of the blade zone (cell 3). This zone can be assimilated as a stagnant zone for which an important pro-portion of the powder will never transit to the other zones of the vessel.
Fig. 15 – Compared homogenization kinetics for lactose and semolina’s tracers when they are initially placed in zone 3, ω= 57 rpm.
Fig. 16 – Evolution of the composition of each zone in the mixer for lactose, with a blade speed of 57 rpm and talc (tracer) initially placed in zone 4.
3.3. High-speed stirring of free-flowing powders
For rotational speeds greater than 86 rpm, the flow regime is cataracting. Cataracting is characterized by a movement of projection of the powder carried by the blades, since centrifu-gal force is greater than gravity. In the following, we report tracer distributions obtained after four seconds of mixing at a rotational speed of 143 rpm and compare it with the results presented in Section3.2.
3.3.1. Tracer initially in zone 4
When the tracer is initially in zone 4, its distribution over the other zones is faster for 143 rpm than for 57 rpm (Fig. 19). With the smaller rotational speed, the tracer is distributed over the
zones 4, 5 and 6, less in zone 1, while few quantities are present in zones 2 and 3. When the blade speed is greater, the tracer mass fractions in the blade zones 4, 5 and 6 decrease and the proportions in zones 1, 2 and 3 increase, meaning that the avalanching mechanism and the diffusion mechanism are still taking place, and to a greater extent. In a general viewpoint, the increase of the rotational speed promotes convection and leads to a better mixture for the same mixing time.
3.3.2. Tracer initially in zone 1
If the colored semolina is placed in zone 1, its quantity in this zone decreases by about a half when the rotational speed is 57 rpm. It is mainly distributed over zones 2, 4, 5, 6 and a bit less in zone 3 (Fig. 20). For the higher rotational speed, the
Fig. 17 – Evolution of the composition of each zone in the mixer for lactose, with a blade speed of 57 rpm and talc (tracer) initially placed in zone 1.
Fig. 18 – Evolution of the composition of each zone in the mixer for lactose, with a blade speed of 57 rpm and talc (tracer) initially placed in zone 3.
tracer proportion decreases below 0.3, the rest of it being also distributed over zones 2, 4, 5 and 6. The proportion in zone 3 is almost the same as at a small agitation speed. It seems that the higher speed induces more convection in the vessel, which is more efficient than avalanches and shear, and contributes to a better distribution of the tracer over the cells.
3.3.3. Tracer initially in zone 3
If colored semolina is placed initially in zone 3, its proportion in this cell after 4 s is slightly smaller at high speed and is more distributed towards cell 5 (Fig. 21). These variations of concentrations between rolling and cataracting regime are not as significant as for previous experiments. This is due to the location of zone 3 that is far from blades and from surface, in other words, where powder flow occurs.
3.4. High-speed stirring of cohesive powders
As for free-flowing powders, the comparison between the rolling regime and the cataracting regime, respectively reached at 57 rpm and 143 rpm of blade agitation speed, will
be presented in the following. Two stirring times, 4 s and 10 s, will also be considered.
3.4.1. Tracer initially in zone 4
For an initial placement of tracer in zone 4, after 4 s of mix-ing time with a blade speed of 57 rpm the tracer is not well distributed between zones 4, 5 and 6 (Fig. 22). A relatively important part is present in zone 6, as compared to the others. This may be a block of tracer, transported by convection that is not dispersed into zones 4 and 5. The distribution is more homogeneous in these states for the cataracting regime.
After 10 s of stirring, the tracer is almost equally distributed over the cells that are directly in contact with the blades (4, 5 and 6) whatever the flow regime or rotational speed. How-ever, for the cataracting regime, the tracer quantity present in these strongly agitated zones is smaller, and more distributed towards other zones than for the rolling regime. This can be attributed to the powder projection that allows the tracer to reach these zones, a phenomena that is enhanced by a higher blade speed that improves the powder exchange by diffusion at the common border of zones 4-5-6 and 1-2-3.
Fig. 19 – Impact of the rotational speed on the distribution of the free-flowing powder over the whole mixer, 4 s stirring time, tracer initially placed in zone 4.
Fig. 20 – Impact of the rotational speed on the distribution of the free-flowing powder over the whole mixer, 4 s stirring time, tracer initially placed in zone 1.
3.4.2. Tracer initially in zone 1
When the tracer is initially placed in zone 1, its transit to other zones is better achieved with the higher agitation speed, what-ever the stirring time (Fig. 23). As in the previous section, the
cataracting mechanism, which is enhanced by a higher speed, improves the distribution of the powder over the different zones of the blender.
Fig. 21 – Impact of the rotational speed on the distribution of the free-flowing powder over the whole mixer, 4 s stirring time, tracer initially placed in zone 3.
3.4.3. Tracer initially in zone 3
Fig. 24shows that, whatever the stirring time, zone 3 demon-strates very few exchange of tracer with the other zones. However, with a blade rotational speed of 143 rpm, more tracer is distributed towards zones 4, 5 and 6, while the proportions in zones 1 and 2 remain close to each other. This is observable especially after 10 s of agitation. This means that the tracer passes from zone 3 to agitated zones by a horizontal mass transport mechanism, which is promoted by the cataracting flow.
A deeper analysis based on the number of revolution, rather than on both the rotational speed and the mixing time is beyond the purpose of the actual study. It will be envisaged in future work so as to begin a dimensionless analysis of the problem.
4.
Discussion based on a Markov chain
frame
4.1. Some generalities on Markov chains
Markov chains have been developed and applied in the field of Chemical Engineering over the past 40 years (Tamir, 1998). In the case of particulate processes, it served as a tool for model-ing powder flow and transformation mechanisms (Berthiaux and Mizonov, 2004). In the present work, we will just consider this model as a frame to gather the experimental results pre-sented above and derive some general thoughts based on the parameters that can be identified in the Markov chain.
As applied to powder stirring, a Markov chain model can describe the mass proportion of tracer X’i passing from one
part of the blender (a state or a cell) to another part after one transition—or event—that lasts a fixed duration. In this study, a transition is represented by a single blade pass, i.e. a quarter
round of the shaft. The number of transitions is linked to the mixing duration t and the blade angular speed ω (Eq.(4)). n=2.ω.t
$ (4)
The theoretical mass repartition of the tracer in the states described in the previous section after n transitions is repre-sented by the state vector Sn(Eq.(5)), where each coefficient
X’iis the normalized mass of tracer present in cell i. The mass
proportion of powder transiting from cell i to cell j is denoted
pij,and is a transition probability of the Markov chain.
Transi-tions probabilities are gathered in the matrix P, which is made of pijtransition probabilities placed at the ith line and at the
jth row.
Knowing Snand P, it is possible to calculate the state vector
Sn+1, being the state vector after n + 1 transitions (Eq.(6)). The
third part of Eq.(6)is a simplification that can be made when the Markov chain is linear and homogenous, i.e. each pijdoes
not depend on Snand on n.
Sn=
⎛
⎜
⎜
⎜
⎜
⎜
⎜
⎜
⎜
⎜
⎜
⎝
X′1 X′2 X′3 X′4 X′5 X′6⎞
⎟
⎟
⎟
⎟
⎟
⎟
⎟
⎟
⎟
⎟
⎠
(5) Sn+1= P.Sn≈ Pn.S0 (6)In this type of model, it is therefore possible to predict the dynamic behavior of a system, knowing the initial
configu-Fig. 22 – Impact of the rotational speed on the distribution of the cohesive powder over the whole mixer, 4 s (left) and 10 s (right) stirring time, tracer initially placed in zone 4.
ration and the transition probabilities. These can be either derived directly form the experiments, without more physical basement (Inoue and Yamaguchi, 1970), or effectively based on a mechanistic approach in which transport coefficients can be identified (Fan and Shin, 1979). It is this last representation that will be followed in the present work.
4.2. Association of transition probabilities with mixing mechanisms
In terms of Markov chains, the cells that served to described the global particle flow are the state through which particles will transit, and the relative amounts of tracer passing from
Fig. 23 – Impact of the rotational speed on the distribution of the cohesive powder over the whole mixer, 4 s (left) and 10 s (right) stirring time, tracer initially placed in zone 1.
a cell to another one can be identified as a transition proba-bility. In order to have a moderate number of parameters in the model, we consider only horizontal and vertical transition probabilities, the others being equal to zero.
Three main mixing mechanisms have been observed and measured experimentally by tracer experiments. Convection can be represented as an exchange between cells 4, 5 and 6. The avalanching mechanism is an exchange of powder
Fig. 24 – Impact of the rotational speed on the distribution of the cohesive powder over the whole mixer, 4 s (left) and 10 s (right) stirring time, tracer initially placed in zone 3.
between cells 1 and 4, while diffusion is an exchange of powder between each neighboring cells. This mechanism is assumed to be negligible as compared to the convection and the avalanching mechanisms, and is therefore represented as a powder exchange between cells 1, 2, 3, 5 and 6 as shown in
Fig. 25. As vertical and horizontal mass transports are probably independent, the diffusion transition probabilities are repre-sented by two parameters, dvand dhrespectively. Convection
transition probabilities are represented by a single parameter
con-Fig. 25 – Schematic view of the 2D-Markov model and its transition probabilities adapted from mechanisms experimentally identified.
Table 4 – Markov chain model parameters identified for a rotational speed of 57 rpm.
Parameter c a dv dh
Semolina 0.4999 0.0347 0.0071 0
Fine lactose 0.4511 0.0279 0 0.0001
sidered. All these are unified in the transition matrix P (Eq. (7)): P=
⎛
⎜
⎜
⎜
⎜
⎜
⎜
⎜
⎜
⎜
⎝
1 − dv− a dv 0 a 0 0 dv 1 − 2dv− dh dv 0 dh 0 0 dv 1 − dv− dh 0 0 dh a 0 0 1 − a − c c 0 0 dh 0 c 1 − dh− 2c c 0 0 dh 0 c 1 − dh− c⎞
⎟
⎟
⎟
⎟
⎟
⎟
⎟
⎟
⎟
⎠
(7)4.3. Identification of transport parameters from tracer experiments
Transport parameters c, a, dvand dhhave been evaluated from
tracer experiments performed with the rotational speed of 57 rpm. The fitting procedure, a least squares method, is based on the minimization of a criterion % (Eq.(8)), y representing the initial cell position of the tracer, k the number of transitions,
X the experimental value of tracer mass proportion and X’ the
theoretical tracer mass proportion. For this, an optimization routine in a Matlab® program has been set up. It scans the parameters’ space several times, narrowing the intervals after each iteration. %=
'
y=1,3,4(
1146'
k=1)
(X′1− X1)2+ ... + (X′6− X6)2*
+
(8)An accuracy of the order of 10− 4on parameters values has
been obtained after three iterations. Calculation duration for one set of parameters is about 10 min with a processor Intel® CoreTMi5 of 2.4 GHz and a Random Access Memory DDR3 8 Go
of 1.6 GHz.
Each parameter has been calculated for semolina and fine lactose using the previously described method (Table 4).
For both powders, convection is the main parameter, with a value close to 0.5, meaning that after each transitions, about a half of the powder in a cell goes to a given neighboring cell. This can be linked with observations of a block of tracer mov-ing from one cell to another one in the zone agitated by blades, as inFig. 7. This value is still slightly smaller than 0.5, since the two other mechanisms, avalanching and diffusion, are taking place. These two mechanisms allow the tracer to communi-cate between directly-agitated cells (4, 5 and 6) and cells for which blades are not passing through (1, 2 and 3).
The a parameter has, for both powders, a value that is com-prised between the convection parameter and the diffusion parameter values. For simulations, a is a significant parameter for semolina since it is the only one allowing a mass transfer between agitated and non-agitated cells.
Diffusion is represented differently by the model, depend-ing on the powder considered: for semolina, diffusion is only represented by its vertical component dv, whereas for fine
lac-tose it is only represented by its horizontal component dh. The
value of dh= 0 for semolina can be explained by the important
value of c: the tracer present in cells 5 and 6 does not go to cells 2 and 3. Experimentally, a shear band can be observed between cells 1, 2, 3 and 4, 5, 6 (this can be slightly seen onFig. 7): the model and the optimization reach its limit to provide a com-plete view of powder flows in the blender. The small value of dh= 0.0001 for fine lactose shows how cohesive the powder
is: inter-particle attraction forces gather particles into nearly-clusters and impede their motion at a microscopic scale. This
value of dh is of the order of magnitude of the optimization
routine precision and must be interpreted with caution. Convection and avalanching parameters are greater for semolina, as compared to fine lactose values. Concerning dif-fusion, the parameter dvfor semolina is greater than the
parameter dh for fine lactose. This quantifies the different
flow behavior of a free-flowing (semolina) and a cohesive powder (fine lactose): the free-flowing system has indeed more ability to move between different parts of a convective blender.
In the graphs represented in Figs. 26 and 27, the model results can be compared with the experiments. Although it must be remembered that model parameters have been extracted from these particular data, the model gives an accu-rate description of the spatial evolution of the tracer in the mixer. This confers a certain value to the parameters calcu-lated here, even if a much deeper analysis is needed before any further conclusion.
5.
Concluding remarks
The tracer experiments performed in this work helped identi-fying the different agitation mechanisms that are appearing in
Fig. 26 – Comparison of model (plain lines) and experiments (stars) for semolina when the tracer is initially placed in cell 4.
Fig. 27 – Comparison of model (plain lines) and experiments (stars) for lactose when the tracer is initially placed in cell 1.
a horizontal convective blender, according to the type of pow-der and the rotational speed of the stirring system that is the main process parameter. The initial placement of the tracer in specific zones of the vessel is essential in this procedure. It has been demonstrated that the convection mechanism is predominant in zones in which blades are passing through, the avalanching mechanism takes place at the free-surface, and a slow diffusion mechanism may show up. This diffusion is a key mechanism to transport powder over zones that are not in contact with the free-surface or the blades.
In addition, the flow regime that is taking place shows a major influence on the homogenization kinetics. In particular, the cataracting regime looks more efficient to homogenize the bulk, whatever the particulate material studied.
Considering the maximum stirring time of 5 min investi-gated, a part of the zones that are not in direct contact with the blades can be considered as stagnant, especially the deep-est zone of the vessel (zone 3). There is indeed a segregated zone that is the fact of the flow itself in the configuration studied, not that of differences in particle’s characteristics. As
expected and because of a lesser particle mobility and com-paction of the powder in nearly stagnant zones, the cohesive material demonstrates a worse ability to homogenization than the free-flowing material.
Even with a distribution of the blades along the mixer’s length, the horizontal configuration will give rise to stagnant zones in the mixer and zones that are poorly mixed. This must be particularly taken into account in the context of industrial batch mixing processing. For example, the filling procedure of the vessel, that is sometimes disregarded, may lead to the placement of the key component in zones that are not favored by the stirring action. In addition, non-conformities are usu-ally detected at the beginning and at the end of batches and may be attributed to the emptying of unmixed zones that are placed close to the outlet valve gates. While this may be overcome by the use of continuous mixers, this is not always feasible because of production constraints. Direct technical solutions such as the inclination of the blades, the inclina-tion of the vessel, as well as a combinainclina-tion of both, may be considered. This is possible in the multifunction prototype presented here, and we will investigate these effects in future work. For this, the same experimental tracing procedure will be repeated.
The Markov chain model that has been derived in this work has been conceived as a first approach to modeling powder flow and is based on the mechanisms identified. It seems to catch most of the tendencies revealed experimen-tally. However, a finer analysis, based on the division of the volume into more cells, is needed before considering the val-idation of such a model. It is worth noting that the blender designed has also been elaborated to perform Particle Image Velocimetry, since the walls and the cylindrical vessel are transparent. This technique can be implemented with the use of an adapted tracker, as it allows to measure the different velocity fields of particles near the walls or at the powder bed surface. This would in turn help improve the markovian model by increasing the number of states and as a consequence its resolution.
At a longer term, the behavior of other powders will also be studied, so as to cover a wider spectrum of powder properties. In particular, cohesive powders of different shapes and sizes may reveal different flowabilities and drive to different trac-ing results. Tractrac-ing each powder durtrac-ing the establishment of an A/B mixture would also be meaningful in terms of under-standing flow interactions, such as particle segregation.
References
Aoki, R., Suzuki, M., 1971.Effect of particle shape on the flow and packing properties of non-cohesive granular materials. Powder Tech. 4, 102–104.
Aoun-Habbache, M., Aoun, M., Berthiaux, H., Mizonov, V., 2002. An experimental method and a Markov chain model to describe axial and radial mixing in a hoop mixer. Powder Technol. 128, 159–167,
http://dx.doi.org/10.1016/S0032-5910(02)00193-6, 3rd French Colloquium on Powder Science & Technology.
Ashton, M., Valentin, F.H., 1966.Trans. Inst. Chem. Eng., 44. Barling, D., Morton, D.A.V., Hapgood, K., 2015.Pharmaceutical dry
powder blending and scale-up: maintaining equivalent mixing conditions using a coloured tracer powder. Powder Technol. 270, 461–469.
Berthiaux, H., Mizonov, V., 2004.Applications of Markov chains in particulate process engineering—a review. Can. J. Chem. Eng. 82, 1143–1168.
Bonamy, D., 2001.Phénomènes collectifs dans les matériaux granulaires: écoulements de surface et réarrangements internes dans des empilements modèles. PhD thesis. Orsay, Paris 11.
Bridgwater, J., 1976. Fundamental powder mixing mechanisms. Powder Technol. 15, 215–236,
http://dx.doi.org/10.1016/0032-5910(76)80051-4.
Bridgwater, J., 2003.Powder mixers: what is going on inside? Budapest In: 4th International Conference for Conveying and Handling of Particulate Solids, vol. 2, 9.1–9.6.
Brone, D., Muzzio, F.J., 2000. Enhanced mixing in double-cone blenders. Powder Technol. 110, 179–189,
http://dx.doi.org/10.1016/S0032-5910(99)00204-1.
Chirone, R., Barletta, D., Lettieri, P., Poletto, M., 2016.Bulck flow properties of sieved samples of ceramic powder at ambient and high temperature. Powder Technol. 288, 379–387. Cuq, B., Gatumel, C., Berthiaux, H., 2013.Food powder mixing. In:
Bhandari, Bansal, Zhang, Shuck (Eds.), Handbook of Food Powders: Processes and Properties. , 1st ed. Woodhead Publishing Series in Food Science, Technology and Nutrition No. 255, August, ISBN 0 85709 513 7.
Daumann, B., Fath, A., Anlauf, H., Nirschl, H., 2009.
Determination of the mixing time in a discontinuous powder mixer by using image analysis. Chem. Eng. Sci. 64, 2320–2331, http://dx.doi.org/10.1016/j.ces.2009.01.032.
Fan, L.T., Shin, S.H., 1979.Stochastic diffusion model of non-ideal mixing in a horizontal drum mixer. Chem. Eng. Sci. 34, 811–820.
Fu, X., Huck, D., Makein, L., Armstrong, B., Willen, U., Freeman, T., 2012.Effect of particle shape and size on flow properties of lactose powders. Particuology 10, 203–208.
Hiseman, M.J.P., Laurent, B.F.C., Bridgwater, J., Wilson, D.I., Parker, D.J., North, N., Merrifield, D.R., 2002. Granular flow in a planetary mixer. Chem. Eng. Res. Des. Mater. Process. 80, 432–440,http://dx.doi.org/10.1205/02638760232022401. Inoue, I., Yamaguchi, K., 1970.Particle motion in a mixer. Mixing
in a two-dimensional V-type mixer. Int. Chem. Eng. 1 (3), 490–497.
Kaye, B.H., 1997.Powder Mixing in Technology and Engineering. Chapman and Hall ed., London.
Lacey, P.M., 1954.J. Appl. Chem. 4, 257.
Lacey, P.M., 1943.The mixing of solid particles. Trans. Inst. Chem. Eng. 21, 53.
Larachi, F., Chaouki, J., Kennedy, G., 1995.3-D mapping of solids flow fields in multiphase reactors with RPT. AIChE J. 41 (2), 439–443.
Leturia, M., Benali, M., Lagarde, S., Ronga, I., Saleh, K., 2014. Characterization of flow properties of cohesive powders: a comparative study of traditional and new testing methods. Powder Technol. 253, 406–423,
http://dx.doi.org/10.1016/j.powtec.2013.11.045.
Lumay, G., Traina, K., Boschini, F., Delaval, V., Rescaglio, A., Cloots, R., Vandewalle, N., 2016.Effect of relative air humidity on the flowability of lactose powders. J. Drug Deliv. Sci. Technol. 35, 207–212.
Marikh, K., Berthiaux, H., Mizonov, V., Barantseva, E., Ponomarev, D., 2006.Flow analysis and markov chain modelling to quantify the agitation effect in a continuous powder mixer. Chem. Eng. Res. Des. Trans. IChemE A 84-A (11),
1059–1074.
Massol-Chaudeur, S., Berthiaux, H., Muerza, S., Dodds, J., 2002.A numerical model to identify the structure of a high-dilution powder mixture. Powder Technol. 128, 195–204.
Mayer-Laigle, C., Gatumel, C., Berthiaux, H., 2015. Mixing dynamics for easy flowing powders in a lab scale Turbula®
mixer. Chem. Eng. Res. Des. 95, 248–261, http://dx.doi.org/10.1016/j.cherd.2014.11.003.
Rose, H.E., 1959.A suggested equation relating to the mixing of powders and its application to the study of the performance of certain types of machines. Trans. AIChE 37, 47.
Smith, J.C., 1955. Mixing chemicals with soil. Ind. Eng. Chem. 47, 2240–2244,http://dx.doi.org/10.1021/ie50551a020.
Tamir, A., 1998.Applications of Markov Chains in Chemical Engineering. Elsevier, Amsterdam.
Wightman, C., Muzzio, F.J., 1998a. Mixing of granular material in a drum mixer undergoing rotational and rocking motions I. Uniform particles. Powder Technol. 98, 113–124,
http://dx.doi.org/10.1016/S0032-5910(98)00010-2.
Wightman, C., Muzzio, F.J., 1998b. Mixing of granular material in a drum mixer undergoing rotational and rocking motions II. Segregating particles. Powder Technol. 98, 125–134, http://dx.doi.org/10.1016/S0032-5910(98)00011-4.