HAL Id: hal-02263670
https://hal-mines-albi.archives-ouvertes.fr/hal-02263670
Submitted on 20 Jan 2021
HAL is a multi-disciplinary open access
archive for the deposit and dissemination of
sci-entific research documents, whether they are
pub-lished or not. The documents may come from
teaching and research institutions in France or
abroad, or from public or private research centers.
L’archive ouverte pluridisciplinaire HAL, est
destinée au dépôt et à la diffusion de documents
scientifiques de niveau recherche, publiés ou non,
émanant des établissements d’enseignement et de
recherche français ou étrangers, des laboratoires
publics ou privés.
Modeling of the polymerization and crystallization
kinetic coupling of polyamide 6 synthesized from
ϵ-caprolactam
Céline Vicard, Olivier de Almeida, Arthur Cantarel, Gérard Bernhart
To cite this version:
Céline Vicard, Olivier de Almeida, Arthur Cantarel, Gérard Bernhart. Modeling of the polymerization
and crystallization kinetic coupling of polyamide 6 synthesized from ϵ-caprolactam. Polymer, Elsevier,
2019, 180, pp.121681. �10.1016/j.polymer.2019.121681�. �hal-02263670�
Modeling of the polymerization and crystallization kinetic coupling of
polyamide 6 synthesized from ε-caprolactam
Céline Vicard, Olivier De Almeida
∗, Arthur Cantarel, Gérard Bernhart
Institut Clément Ader (ICA), Université de Toulouse, CNRS, IMT Mines Albi, UPS, INSA, ISAE-SUPAERO, Campus Jarlard, 81013, Albi CT Cedex 09, France
Keywords:
Coupled polymerization-crystallization model DSC kinetics
Time–temperature–transformation diagram Liquid thermoplastic composite manufacturing Polyamide 6
A B S T R A C T
Optimization of polyamide 6 (PA6) composite manufacturing by liquid processes requires a better prediction of kinetics during synthesis. This study proposes a new modeling approach that considers the interaction between PA6 polymerization and crystallization over a wide temperature range (403–473 K). Different polymerization and crystallization models taken from literature were used in this study. Few attempts to describe the coupling between phenomena have been reported, and all have raised physical limitations. A new coupling equation was adapted from Hillier coupling, first introduced to model secondary crystallization of semi-crystalline thermo-plastics. This equation properly predicted kinetics at high temperature when the coupling is limited. However, it failed in predicting the particular crystallization kinetics in the early stages of polymerization at low tempera-ture, as crystallization may require that polymerized chains reach a certain length or concentration in the re-active mixture. A factor was successfully introduced in order to correct the crystallization behavior. From this new model, a wide isothermal Time-Temperature-Transformation (TTT) diagram was produced, which assists in cure path design for composite manufacturing.
1. Introduction
Reactive thermoplastic systems are promising alternatives to con-ventional thermoplastic matrices for the manufacturing of composite laminates. Contrary to high molecular weight thermoplastics, which high viscosity limits fiber impregnation rate and requires high pressure processes, the low viscosity of reactive systems make them compatible with liquid processes used for thermoset matrix composite manu-facturing (Resin Transfer Molding, Liquid Resin Infusion) [1]. Ther-moplastic composites made from reactive systems combine the ad-vantages of thermoset composite processes, that offer the possibility of manufacturing large and non-uniform 3D composite parts, and ther-moplastic matrix properties, which enable welding, reshaping and re-cycling composite parts afterwards.
Among the available reactive thermoplastic systems, polyamide 6
(PA6) synthesized by anionic ring-opening polymerization (AROP) of ε-caprolactam is particularly attractive for transportation and energy applications. It offers a suitable balance between mechanical properties and material cost [1] and does not required extensive modifications of standard liquid process equipment. PA6 polymerization is achieved in situ during and after impregnation of composite reinforcements. The synthesis can be parametrized using various pair and ratio of catalyst and activator and controlled by temperature [1–3].
The particularity of the PA6 synthesis is that the chains poly-merization and their crystallization can occur simultaneously de-pending on the temperature applied [4–6] and both affect the viscosity of the system. These phenomena are even coupled as the crystallization kinetics depend on the amount of polymer chains available. The un-derstanding of the polymerization/crystallization interaction is even more critical given that their temperature dependencies are contrary. A
∗Corresponding author.
high processing temperature accelerates the polymerization kinetics while disenabling crystallization (which will occur during cooling). Conversely, a low temperature slows down the polymerization but fa-cilitates crystallization; though issues due to the coupling between phenomena may appear.
Different hypotheses have been reported in the literature to explain how phenomena interact. Specifically, crystallization could not proceed right from the beginning of the reaction as a minimum concentration or a minimal length of polymerized oligomers are required for nucleation [7–10]. The crystallization could also change the concentration of re-actants in the mixture, either by reducing the volume available for polymerization (increases the concentration) or by entrapping reactive species in crystals (decreases the concentration), which would have an impact on the synthesis kinetics [5,7,11–13].
As the temperature range of PA6 synthesis coincides with that of crystallization, a proper control of the reaction advancement and a prediction of final composite properties are complex yet crucial. To avoid expensive trial-and-error empirical optimization, a process si-mulation can be developed in order to optimize the cycle time, com-posite properties and dimensional stability after demolding. In parti-cular, this requires a modeling of the synthesis kinetics including both polymerization and crystallization. This modeling also allows con-struction of a Time-Temperature-Transformation (TTT) diagram, which summarizes the events occurring over time at different temperatures [14]. Such diagrams represent a convenient tool for assessing a cure path and final properties of composites involving reactive matrices. From a unique diagram, different processing routes can be defined for any process while avoiding use of complex simulations.
The global heat flow φ [W g−1] recorded during the PA6 AROP from ε-caprolactam is the sum of the polymerization heat flow φpand the crystallization heat flowφc(eq.(1)).
= +
φ t( ) φ tp( ) φ tc( ) (1)
To model the evolution ofφ, the relative degree of conversion α [−] and the relative degree of crystallinityβ [−] are generally preferred as they allow using kinetic differential equations.α is defined by equation
(2), whereXp[wt.%] is the mass fraction of polymerization and∆Hp∞[J
g−1] is the final enthalpy of polymerization.
∫
= ∞ = ∞ α t( ) X tXp( ) ∆H1 φ τ τ( ) d p p t p 0 (2)In the case of the PA6 synthesis, the polymerization kinetics are modeled either through a mechanistic differential equation based on chemical reaction kinetics and monomer concentration [15–20], or by using a semi-empirical equation [19,21–27]. Wittmer et al. early pro-posed a first-order equation with an Arrhenius temperature dependence [21]. Malkin et al. [22,24,28] improved this polymerization equation by introducing an autocatalytic reaction rate term and Camargo et al. [29] proposed to use annth-order reaction. This model has since been
extensively used in the literature [13,30–35] and remains the reference. In a similar manner, the crystallization heat flow is defined through the relative degree of crystallinityβ [−] by equation(3), whereXc[wt.
%] is the mass fraction crystallinity.
∫
= ∞ = ∞ β t( ) X tXc( ) ∆H1 φ τ τ( ) d c c t c 0 (3)In order to model the crystallization during the PA6 synthesis, the literature proposed to use models describing bulk polymer crystal-lization, such as the Avrami-Kolmogorov model [23,33]. Malkin et al. [24,36–39] have proposed a new differential equation to describe ei-ther bulk polymer crystallization and PA6 crystallization during synthesis. This model includes an autocatalytic term improving the kinetic prediction at the end of crystallization.
To model the coupling behavior between polymerization and crys-tallization, different levels of interaction have been considered in the
literature. A recent study [40] proposed to use a simple sum (eq.(4)), considering that both transformations are independent. The total heat flow of reactionφ is calculated fromφ∞
p andφc∞[W g−1], that refer
respectively to the final heat of polymerization and crystallization of the system at the end of the reaction, and from the degree of conversion α and the degree of crystallinity β. This approach is however not valid from a physical point of view as crystallization necessarily depends on the availability of polymerized chains.
= ∞ + ∞ φ t φ α t φ βt ( ) d d d d p c (4)
In the literature [13,41], the most used coupling equation has been proposed by Malkin and Bolgov (eq.(5)). The term B [−] has been defined in this study as the degree of crystallinity within the reactive mixture. It differs from the relative degree of crystallinity of equation
(3)that corresponds to the crystallization of the bulk polymer. Al-though if no coupling with polymerization is considered, thenB β.=
In equation(5), the crystallization kineticsβ˙ are proportional to the
degree of conversionα at any time and both phenomena are initiated simultaneously with temperature. It thus assumes that crystallization can occur right from the beginning of the reaction, even when the system only consists of monomers and oligomers. Moreover, the crys-tallization kinetics of a newly synthesized chain is assumed to be only dependent on the time elapsed since the beginning of the reaction, with no consideration to the moment it was actually formed. These as-sumptions induce issues with the applicability of the Malkin coupling equation. = ∞ + ∞ φ t( ) φ αp ddt φc ddβtα t( ) B t d d (5)
The aim of this study is to investigate the limitations of the Malkin coupling model and to overcome them by proposing a new coupling equation. Models are based on a previous experimental study of the PA6 AROP from ε-caprolactame [10]. The reaction kinetics were directly identified using calometric method (DSC), contrary to most of the lit-erature dealing with this synthesis, which are based on templit-erature measurements in an adiabatic reactor. DSC results could be directly used for the identification of kinetic models.
The polymerization kinetic model was identified on this experi-mental database and complementary experiments of crystallization from the melt were achieved in order to define an appropriate crys-tallization model. The results obtained with the Malkin coupling model are then compared and a new coupling equation is presented. It was adapted from a kinetic coupling developed by Hillier to model the crystallization of bulk polymers when they exhibit a secondary crys-tallization [42]. After presenting the coupling formulation, the accu-racy of the model to predict the total heat flow over time and its co-herence with physical phenomena are discussed. Finally, an isothermal TTT diagram of the PA6 synthesis was built based on the model pro-posed, gathering both polymerization and crystallization evolutions. 2. Experimental
2.1. Synthesis kinetics and coupling behavior
The modeling of PA6 synthesis was based on experimental data detailed in Ref. [10]. In this previous study, PA6 was synthesized by anionic ring-opening polymerization from ε-caprolactam with products supplied by Brüggemann Chemical, Germany. The products used for PA6 polymerization were the ε-caprolactam monomer “AP-Nylon®“, caprolactam magnesium bromide as catalyst (MgBrCL - “Nyrim C1®” 1.4 mol kg−1in caprolactam) and bifunctional hexamethylene-1,6-di-carbamoylactam as activator (HDCL - “Brüggolen C20P®” 2.0 mol kg−1 in caprolactam). Syntheses were achieved with a reactive mixture
which MgBrCL/HDCL ratio was 0.79/1.10 mol.% of CL.
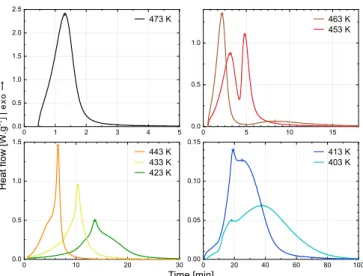
The global heat flowφ [W g−1] released during synthesis was re-corded by DSC at various temperatures between 403 and 473 K (Fig. 1) and heating rates. The degree of global transformationγ [−] was de-fined by equation(6), whereQtot [J g−1] is the total heat of reaction (both polymerization and crystallization). The global synthesis kinetics
γ˙ [s−1] are obtained from the temporal derivative of the degree of global transformationγ.
∫
= γ t Q φ τ τ ( ) 1 ( ) d tot t 0 (6)The DSC curves and data recorded by TGA, DSC and WAXS on polymerized samples were used to quantify the total heat of reaction
Qtot[J g−1], the degree of conversionX∞
p [wt.%] and the crystallization
enthalpy ∆Hc [J g−1] for each isothermal synthesis temperature
(Table 1). The theoretical total enthalpy of polymerization∆Hp100%was
also calculated and estimated as123.5 ±4.1 J g−1.
From the analysis of this experimental dataset, specific behaviors of the coupling between polymerization and crystallization have been identified. When the PA6 synthesis is achieved at high temperature, i.e. above 473 K, the low supercooling prevents the crystallization to occur and the synthesis only depends on the polymerization kinetics. The crystalline structure is formed afterward during the cooling and the final PA6 properties are similar to a standard PA6. At lower synthesis temperature, the polymerization kinetics are reduced and the higher degree of supercooling activates the crystallization in a second stage of the synthesis. Below 433 K, the crystallization kinetics strongly depend on the kinetics of chain extension and the polymerization thus controls the overall synthesis time.
The previous results also highlighted that a high degree of linity and a thick lamellar morphology are obtained when crystal-lization occurs simultaneously with polymerization, probably due to a higher mobility of polymer chains within the monomer medium. Finally, at low temperature, it was observed that crystallization does not start at the early stage of the synthesis. This was explained by the fact that nucleation requires a minimal chain length [7,8,43,44] or a minimal concentration of oligomers [7,9] to proceed.
2.2. Isothermal crystallization from the melt
The experimental study in Ref. [10] was completed with a DSC crystallization from the melt campaign performed on a PA6 sample synthesized atTiso = 423 K. Tests were conducted with a
power-com-pensated PerkinElmer 8500 DSC under nitrogen on 9–12 mg samples sealed in aluminum pans. The sample was first heated at 543 K, i.e. above the equilibrium melting temperature of an infinite crystalTm0
(533 K for PA6). A dwell time of 8 min was used in order to erase the thermal history. The sample was then cooled down at −150 K min−1to different isothermal temperatureTiso c, between 453 and 463 K (every
2 K). Crystallization control tests at −10 K min−1were repeated before and after the campaign and confirmed the sample stability along the thermal cycles.
The heat flow curves of crystallization are presented inFig. 2. The higher the applied temperatureTiso c,, the slower the kinetics and longer
induction time, which is expected in this temperature range for PA6 [45] since the supercooling is lower. The crystallization is also char-acterized by unsymmetric peaks that reflect a kinetic slowdown at the end of the crystallization and suggests the existence of a secondary crystallization [46].
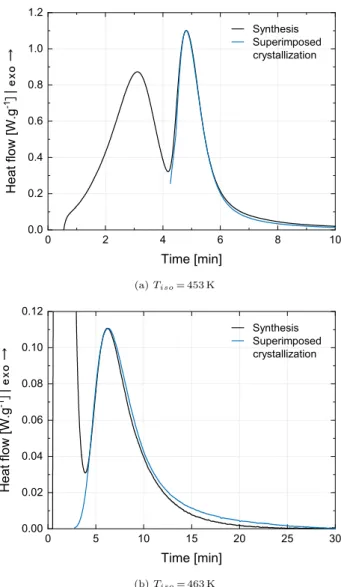
Fig. 3shows the superposition of the crystallization curve obtained from the melt atTiso c, = 453 and 463 K with the second peak
(corre-sponding to the crystallization) of the synthesis curve at the same temperature. The good agreement between curves indicates that when crystallization occurs separately from the polymerization, its kinetics correspond to the one obtained from the melt. This result suggests that the crystallization process is similar during synthesis and from the melt when polymerization and crystallization are almost decoupled. 3. Numerical methods
3.1. Synthesis kinetic formulation
By using a normalized kinetic formulation, the synthesis kinetics are expressed irrespective of the enthalpies associated to polymerization and crystallization. A weight factor of polymerizationwp[−] has been
Fig. 1. PA6 global synthesis kineticsγ˙ measured in isothermal conditions with
DSC.
Table 1
Total heat of reaction, mass fraction of polymerization and crystallization en-thalpy measured during the PA6 synthesis at different isothermal temperatures.
Synthesis temperature Total heat of reaction Mass fraction of polymerization Crystallization enthalpy Tiso[K] Qtot[J g−1] X∞p [wt.%] ∆Hc[J g−1] 403 196.3 ± 11.1 91.8 ± 0.1 82.8 ± 11.8 413 205.6 ± 14.5 93.8 ± 0.6 90.3 ± 15.1 423 219.8 ± 3.3 94.3 ± 1.2 102.3 ± 5.2 433 211.9 ± 1.8 94.8 ± 0.5 95.2 ± 4.4 443 198.4 ± 8.3 94.9 ± 1.1 80.3 ± 9.2 453 194.7 ± 6.3 96.7 ± 0.1 75.1 ± 7.5 463 142.3 ± 10.1 95.8 ± 0.6 24.0 ± 10.9
473 121.7 ± 4.5 94.6 ± 0.7 4.3 ± 6.0 Fig. 2. Isothermal crystallization from the melt of a PA6 sample previouslypolymerized atT iso423 K.
defined as the ratio of the final enthalpy of polymerization∆H∞
p to the
total heat of reactionQtotaccording to equation(7). The weight factor of crystallization wc [−] is defined in a similar manner, involving
+ = wp wc 1. = ∞ = ∞+ ∞∞ w Tp( ) ∆Q TH Tp( )( ) ∆H ∆H∆H T( ) tot p p c (7)
As shown inTable 1, the total heat of reactionQtotdecreases with the increase in the synthesis temperature, while the mass fraction of polymerization X∞
p remains globally constant whatever the synthesis
condition, with an average of X‾p∞ = 94.2 ± 1.4 wt%. The weight
factorswpandwcwere therefore mainly dependent on the variation of
crystallization enthalpy∆Hcwith temperature. For sake of simplicity, a
constant value was thus considered for the final enthalpy of poly-merization∆H∞
p. It was calculated from the average mass fraction of
polymerizationX‾p∞and the theoritical total enthalpy of polymerization
H
∆ p100%.
As for crystallization, a second-order polynomial equation (eq.(8)) was used to model the temperature dependence of∆H T∞( )
c (Fig. 4).
Beyond the roots of the polynomial curve, i.e. below 365.4 K and above 472.4 K, the crystallization was assumed impossible which was in good agreement with experimental observations reported in Ref. [10].
= − + −
∞
H T T T
∆ c ( ) 0.0354 2 29.651 6107.5 (8)
Using eqs.(7) and (8), the degree of global transformationγ (eq.
(6)) can be used to define the coupling equation without using en-thalpies of phenomena. The Malkin coupling model (eq.(5)) can be thus rearranged as equation(9).
∫
= + − γ t w T α t w T α θ θβ θ θ ( ) ( ) ( ) (1 ( )) ( ) d d ( ) d p p t B t 0 ( ) (9)3.2. Model parameters identification procedure
The polymerization, crystallization and coupling models were identified sequentially on the experimental data of the degree of con-versionα, the degree of crystallinity β and the degree of global trans-formationγ respectively. A least squares method involving an interior-point optimization algorithm developed in Matlab® was used for de-termining model parameters. The identification was achieved on all datasets together, meaning that temperature dependent parameters and constant parameters could be distinguished.
The objective function was normalized by the number of data points on curvesNm(eq.(10)) and by the number of curvesNc(eq.(11)). The
identification was run several times with different sets of initial para-meters in order to avoid the convergence of the optimization algorithm into a local minimum set of parameters.
∑
= ⎛ ⎝ ⎜ − ⎞ ⎠ ⎟ = f xj( ) N1 Ymax(YY )( )x m i N j iexp j isim jexp 1 , , 2 m (10)∑
= = f xtot( ) N1 f x( ) c j N j 1 c (11)4. Polymerization and crystallization models 4.1. Isothermal polymerization modeling
The polymerization kinetics α˙ were described by the differential equation(12)proposed by Camargo et al. [29] based on Malkin's work [22,24,28]. This model presents an Arrhenius temperature dependence in whichA0[s−1] is a constant representative of the number of
colli-sions between molecules, B0 [−] is an autocatalytic factor,np [−]
corresponds to the reaction order,Ea[J mol−1] is the activation energy of the polymerization and R [J K−1mol−1] is the universal gas con-stant.
Fig. 3. Superposition of isothermal crystallization curves obtained from the melt with the crystallization peak recorded during synthesis at the same tem-perature.
Fig. 4. Temperature dependence of the crystallization enthalpy ∆H∞ c and
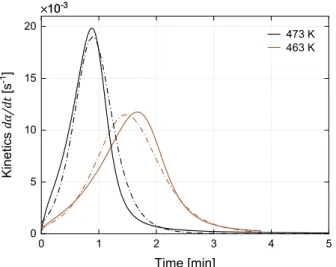
= − + ⎛ ⎝− ⎞⎠ α t A α B α RTE d d 0(1 ) (1np 0 )exp a (12) Between 463 and 473 K, the polymerization peak is completely se-parated from the crystallization, which allowed the assessment of the four parameters of the Malkin-Camargo model by optimization.Fig. 5
compares the experimental polymerization kineticsα˙ with the model prediction. The good agreement between results demonstrates the re-levance of the model. Final parameters of the model were optimized with the coupling model and the full temperature range of isothermal synthesis.
4.2. Isothermal crystallization modeling
As previously mentioned, crystallization during synthesis is similar to crystallization from the melt (Fig. 3) when it is decoupled from the polymerization (Tiso=453 and 463 K). It was thus decided to identify the
crystallization model from results recorded on the synthesized PA6 sample and presented inFig. 2. This strategy to model crystallization from bulk crystallization was postulated by Malkin et al. [23,25,37–39]. It implies that the interaction with the polymerization progress is only considered through the coupling equation.
Among available models describing the crystallization from the melt of thermoplastic polymer, the Nakamura model [47,48] was selected as it enables modeling isothermal and non-isothermal crystallization with a unique simple equation. The relative degree of crystallinity β was expressed with equation (13), in which KN [s−1] is the Nakamura
global kinetic constant and n [−] the Avrami exponent distinctive of the type of nucleation (instantaneous or sporadic) and geometry of crystal growth.
∫
⎜ ⎟ = − ⎛ ⎝ ⎜−⎛ ⎝ ⎞ ⎠ ⎞ ⎠ ⎟ β t( ) 1 exp tK T θN( ( )) dθ n 0 (13)The temperature dependent kinetic constant K TN( ) was modeled using the Hoffman-Lauritzen equation (eq.(14)) [49]. In equation(14), U* refers to the activation energy of macromolecular motion in the molten state, that was set to 6300 J mol−1,Kgis a constant related to crystallization growth, the temperatureT∞corresponds to the
differ-enceTg−30K,Tm0refers to the equilibrium melting temperature of PA6
crystals and f defines a corrective factor introduced by Hoffman for high supercooling conditions. This factor is given by the relationf= +T
T T
2 (m0 ).
The parameters n,K0andKgwere determined by optimization whileT∞
andTm0were set to 293 K and 533 K respectively [50].
⎜ ⎟ ⎜ ⎟ = ⎛ ⎝− − ∞ ⎞⎠ ⎛⎝− − ⎞⎠ K TN( ) Kexp R T T( U ) exp T T( KgT f) m 0 * 0 (14)
The main advantage of this model is that it considers the tempera-ture dependence of macromolecular diffusion and nucleation in a temperature range lasting from the glass transition temperature up to the equilibrium melting temperature of PA6 crystalTm0. It allows
re-presenting the maximum crystallization kinetics around 413 K and the reduction of crystallization kinetics close toTgandTm0, that have been
observed for PA6 by MaGill on spherulite growth rate [45] or by fast scan DSC measurements more recently [51,52].
Besides the crystallization kinetic equation, an induction timet Tc,0( ) was introduced in the model in order to consider the time required for the nucleus to form before crystal growth can start. This induction time was modeled with an Arrhenius equation related to the equilibrium melting temperatureTm0 (eq.(15)). The induction time introduced two
parameters to be identified by optimization: a pre-exponential factorAt
and an activation energyEt.
⎜ ⎟ = ⎛ ⎝ − ⎞⎠ t Tc ( ) Atexp R T( Et T) m ,0 0 (15)
Fig. 6 compares the measured crystallization kinetics β˙ and the
model predictions (eqs.(13) and (14)); here the time is normalized with the induction time, i.e.t tc,0− . The latter observed experimentally (Fig. 2) is compared with the Arrhenius model (eq.(15)) inFig. 7.
Results inFig. 6are in good agreement except by the end of crys-tallization where a possible secondary cryscrys-tallization can occur. In order to take into account this phenomenon, a coupling equation be-tween two crystallization models could be used, like the couplings proposed by Hillier [42], Velisaris and Seferis [53] or Cebe [54]. However it was decided to limit the complexity of the crystallization model to a single Nakamura model. It is indeed aimed at modeling PA6 crystallization during synthesis between 403 and 473 K but it was identified on experimental curves recorded only between 453 and 463 K. The extrapolation of the crystallization model was therefore considered critical with regards to the secondary crystallization process and a reduced number of parameters was preferred.
Table 2 presents the crystallization parameters obtained by the global optimization. It appears that n is relatively small and is not consistent with the spherulitic geometry usually observed for PA6 crystallized from the melt. This result could be a consequence of using a unique Nakamura model to represent the entire transformation without considering the secondary crystallization. Parameters obtained are thus an average of the ones attributed to each mechanism. The crystal-lization parameters identified from the melt will be fixed for the cou-pling modeling, being therefore excluded to the global optimization.
Fig. 5. Simulation of decoupled isothermal polymerization with Malkin-Camargo model; (−)exp and (-⋅-).sim
Fig. 6. Simulation of the relative degree of crystallinity during the bulk crys-tallization of a synthesized PA6 sample; (−)βexpand (-⋅-).βsim
Fig. 8shows the crystallization curves simulated with Nakamura-Hauffman-Lauritzen model and the induction time over the tempera-ture range used for PA6 synthesis from ε-caprolactam, i.e. from 403 to 473 K. At low temperature, whereKN is maximal, crystallization only
lasts 10 s. Conversely, 5 h are required to complete crystallization at 473 K.
5. Coupling modeling 5.1. Malkin coupling
In order to take into account the coupling between polymerization and crystallization, Malkin et al. [23,25] proposed that the term due to crystallization depends on the degree of conversionα achieved at time t as shown in equation(5)and rearranged as equation(9)using equa-tions(1)–(7). This coupling has been used in the literature to model the temperature rising during adiabatic syntheses [13,23,25,55].
The introduction of the induction time of crystallizationtc,0 gives
equation(16), which distinguishes two cases depending on the sign of −
θ t Tc,0( )described with the Heaviside step function H.
∫
= + − × − − γ t w T α t w T H θ t T α θ β θ t T θ ( ) ( ) ( ) (1 ( )) ( ( )) ( ) ( ( )) d p p t c θ c B t 0 ,0 dd ,0 ( ) (16)This coupling assumes that both polymerization and crystallization start at the beginning of the reaction and occur at the same time. It means that at each new increment of polymerization, the formed phase is involved in the global crystallization in progress. Moreover, it does not consider the possible influence of the crystallization on the poly-merization at low synthesis temperature, even if this possibility has been mentioned in literature [5,7,10,12,13].
Fig. 9presents results atTiso = 413 and 443 K obtained with Malkin
coupling (eq. (16)), the Malkin-Camargo polymerization model (eq.
(12)) and the Nakamura-Hoffman-Lauritzen crystallization model (eqs.
(13)–(15)) compared to experimental data from DSC. Fig. A in Sup-plementary data gathers the synthesis curves simulated from Tiso
= 403–473 K. It appears that this coupling equation completely inhibits crystallization.
These results are a direct consequence of the form of the term B in the Malkin coupling (eq.(16)), which could reached 1 only if phe-nomena are perfectly decoupled, i.e. if the polymerization is completed (α = 1) prior to crystallization. However, the crystallization model extrapolation, especially at low temperature (403–423 K), implies very high kinetics (Fig. 8) within a time scale of tens of seconds while the polymerization takes one to 2 h. The product of the two components in term B is thus almost zero and leads to a reaction only described by the polymerization kinetics.
This incoherence is inherent of the hypothesis of a global crystal-lization starting at the beginning of the synthesis. At low temperature, it means both that the crystallization starts even though chains are not yet polymerized, and that chains formed after the end of the global crys-tallization cannot crystallize despite the thermal conditions being fa-vorable for a crystalline organization.
5.2. Hillier coupling
In order to counterbalance the lack of physical meaning involved in the Malkin coupling, the Hillier equation [42] has been adapted to the case of the PA6 polymerization and crystallization coupling (eq.(17)). The difference with the Malkin coupling (eq.(9)) is in the time de-pendence of the local decoupled crystallization termβ. Indeed the term B, which represents the coupled crystallization, corresponds here to the degree of crystallinity at time t of an element that was polymerized at timeθ. In other words, each new polymerized part (new increment of α) starts its crystallization with its own initiation time and its own ki-netics.
Hillier coupling thus represents the influence of polymerization on crystallization in terms of the availability of chain segments, which corresponds to the experimental observations. Nevertheless, as with the Malkin coupling, this adaptation of Hillier coupling assumes that crystallization does not influence polymerization, although this possi-bility has been mentioned previously [1].
∫
= − − − − γ t( ) w T α tp( ) ( ) (1 w Tp( )) tα θ( ) ddθβ t θ θ( ) d B t 0 ( ) (17)By introducing the crystallization induction timetc,0(eq.(15)) into
equation(17), the coupling is described according to equation(18),
Fig. 7. Simulation of the induction timetc,0appearing prior crystallization from
the melt of a synthesized PA6 sample. Table 2
Parameters of Nakamura-Hoffman-Lauritzen model identified by optimization on curves of crystallization from the melt.
Parameter Value Unit
K0 7.59 10× 8 [s−n]
Kg 6.63 10× 5 [K2]
N 1.59 [−]
At 5.17 10× −2 [s−1]
Et 4.45 [kJ mol−1]
Fig. 8. Simulation of the degree of crystallinity β through the Nakamura-Hoffman-Lauritzen model including the induction timetc,0over the temperature
where H is the Heaviside step function.
∫
= − − × − − − − γ t w T α t w T H t θ t T α θ β t θ t T θ ( ) ( ) ( ) (1 ( )) ( ( )) ( ) ( ( )) d p p t c θ c 0 ,0 dd ,0 (18) with:∫
∫
− − = − − − − − − − β t θ t T K T τ nK T K T τ ( ( )) exp( ( ( ) d ) ) ( )( ( ) d ) θ c t θ t T N n N t θ t T N n d d ,0 0 ( ) 0 ( ) 1 c c ,0 ,0The identification of the four parameters of the Malkin-Camargo polymerization model (eq.(12)) was performed on theγ sigmoid ob-tained for the isothermal syntheses between 403 and 473 K (every 10 K).
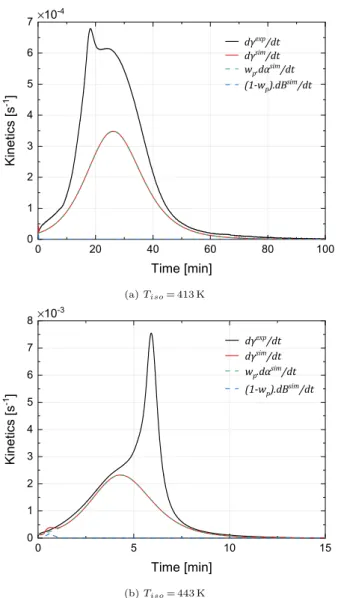
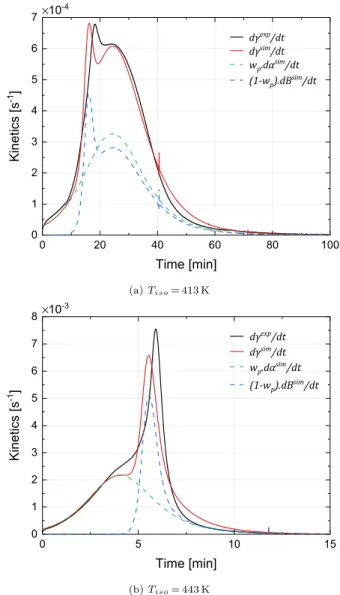
Fig. 10details the kinetic curves simulated at 413 and 443 K com-pared to experimental data from DSC and Fig. B in Supplementary data gathers the synthesis curves simulated fromTiso = 403–473 K. Unlike
the Malkin coupling, the crystallization is predicted for all tempera-tures. At low temperature, the crystallization is limited by the poly-merization and then adopts its kinetics, since each new increment crystallizes almost instantaneously. This is consistent with the inter-pretation of the kinetic results obtained in Ref. [10]. At 463 K, the coupling slightly shifts the crystallization compared to the Malkin
coupling, which improves the prediction (see Fig. B).
However, since the crystallization starts at the beginning of the polymerization, the model does not reproduce the crystallization peaks in the early stages of the polymerization between 403 and 413 K and the shoulders observed between 423 and 443 K. As previously men-tioned, these peaks are due to the germination that cannot start in the first moments of the polymerization. Thus at 413 K (Fig. 10a), the germination seems to start from about 10 min and at 443 K (Fig. 10b) after 4 min. The induction time of the crystallizationtc,0only translates
the influence of the temperature on the crystallization initiation and does not consider the effect of molar masses or the concentrations reached.
If the use of the Hillier coupling with the Malkin-Camargo and Nakamura-Hoffman-Lauritzen crystallization models improves the si-mulation of PA6 synthesis by correcting the absence of crystallization at low temperature predicted with the Malkin coupling, all the physical phenomena are not taken into account. The introduction of a corrective factor in the crystallization term B was therefore proposed in order to improve the prediction of synthesis kinetics.
5.3. Corrective factor
An empirical corrective factor was added to the coupling equation to correct the particular crystallization kinetics observed during early
Fig. 9. Simulation of PA6 synthesis kineticsγ˙, polymerization kinetics α˙ and
crystallization kineticsB˙ with Malkin coupling (eq.(16)) versus DSC data.
Fig. 10. Simulation of PA6 synthesis kineticsγ˙, polymerization kinetics α˙ and
stages of polymerization at the low temperature, i.e. between 403 and 443 K. It was inspired by the diffusion factor introduced in thermoset-ting curing models to take into account the drastic decrease of the crosslinking kinetics due to vitrification. The corrective factor fd in
equation (20) depends on the degree of conversion α and the tem-perature T. fddisplays a sigmoid shape defined between 0 and 1 and
parametrized by C and D [−], which govern the half-height slope and the shift of fdsigmoid onα axis respectively.
= − + − +
f α Td( , ) 1 1 exp( ( )(C T α1 1) D T( )) (19) adding the corrective factor fdinto the coupling equation(18) gives
equation (21).
∫
= − − × − − − − γ t w T α t w T H t θ t T f α θ T α θ β t θ t T θ ( ) ( ) ( ) (1 ( )) ( ( )) ( ( ), ) ( ) ( ( ))d p p t c d θ c 0 ,0 dd ,0 (20)An overall optimization was performed on sigmoidal γ curves of isothermal syntheses in order to refine the four parameters of the Malkin-Camargo polymerization model (eq. (12)) and to identify parameters C and D for eachTisosince their temperature dependence is
not known a priori. For their identification, constraints were imposed on these parameters: D was set higher than 6.9 in order to getfd(0.999, )T
= 1 andC D > 6.9 to get f− d(0.001, )T = 0.
Fig. 11details the kinetic curves simulated atTiso = 413 and 443 K
compared to experimental data from DSC. Results of all synthesis temperatures are presented in Figs. C to F in Supplementary data. The results clearly show the contribution of the corrective factor fd, as the
model reproduces the particular crystallization kinetic behavior ob-served at the beginning of polymerization by delaying its initiation.
Fig. 12presents the evolution of the corrective factorfdas a
func-tion of the degree of conversionα for each temperature. The higher the synthesis temperature, the higher the degree of conversionα for which the sigmoidfdproceeded. This is consistent with the fact that the higher
the temperature, the higher the critical nucleus size to reach and therefore the higher the molar mass or the concentration. At higher temperature (Tisobetween 453 and 463 K) fdhas little effect since the
induction time of crystallizationtc,0is enough to take into account the
late crystallization observed. It is consistent with the experimental observations presented previously (Fig. 1): the crystallization is de-coupled from the polymerization and its kinetics is similar to that taking place from the molten state. At 473 K crystallization does not occur, meaning that fdhas no effect at this temperature.
Fig. 13shows the evolution of the parameters C and D as a function of the synthesis temperature. No proper model was found to correctly represent their temperature dependence due to the high sensitivity to parameters C and D. The values necessary for the simulation of the synthesis at other isothermal temperatures or under non-isothermal conditions were thus interpolated from the parameters C and D iden-tified at the differentTiso.
Table 3summarizes the polymerization parameters obtained by a global optimization with the Hillier coupling and the corrective factor
fd. The activation energy of the reaction Ea reaches more than
90 kJ mol−1, whereas the values reported in the literature with the same catalyst (MgBrCL) are between 53 and 84 kJ mol−1[12,55,56]. However, it should be noted that the results of Davé et al. [12] and Teuwen [55] were obtained by modeling the temperature rise of the medium in an adiabatic reactor, which limits the measurement sensi-tivity for an accurate characterization of the temperature dependence of phenomena contrary to the DSC characterization used in this study. Moreover, results of Merna et al. [56] correspond to copolymerization with the ε-caprolactone monomer (forming polycaprolactone), which may explain the different activation energies Ea obtained. In the lit-erature, most of the modeling studies have focused on the sodium ca-prolactamate (NaCL) catalyst, which has a reaction activation energyEa
comprised between 62.8 and 104.3 kJ mol−1
[13,22,24,25,29,31,32,57] for adiabatic synthesis.
The reaction ordernpidentified is in good agreement with literature
for the MgBrCL catalyst [12,55], which reports values between 0.93
Fig. 11. Simulation of PA6 synthesis kineticsγ˙, polymerization kinetics α˙ and
crystallization kineticsB˙ with Hillier coupling including the corrective factor fd
(eq. (21)) versus DSC data.
Fig. 12. Evolution of the corrective factorfdwith the degree of conversionα for
and 1.2. The autocatalytic factorB0is greater than the range of 7–21
reported by literature [12,55]. Finally, the parameter A0 is hardly
comparable because its value depends directly on the identified acti-vation energyEa(Arrhenius law).
This empirical corrective factor reveals current limits of the cou-pling equation proposed in this study. The influence of the poly-merization on crystallization at the early stages of synthesis could be achieved by introducing polymerization-dependent parameters into the crystallization model, instead of adding a corrective factor dependent on the degree of conversionα. The crystallization kinetic parameters would be either temperature dependent and functions of the molecular weight, as already evoked in the literature [58,59], or the chain con-centration within the mixture. However, this would increase the level of complexity of the identification of parameters as it can no longer be separately identified on crystallization from the melt of a synthesized PA6.
In addition, the influence of crystallization on the polymerization should be considered in a further improvement of the synthesis kinetic model as it affects the degree of conversionX∞
p forTiso< 443 K [10].
5.4. Time-Temperature-Transformation diagram
Isothermal TTT diagram of the PA6 synthesis was developed due to the new model proposed in this study and is shown onFig. 14. This diagram represents iso-polymerization curves (Xpfrom 1 to 94 wt% in
green) and iso-crystallinity curves (Xcfrom 1 to 43 wt% in blue). This
diagram must be horizontally read at a constant temperature. Readers should keep in mind that the studied experimental range is between 403 and 473 K, thus simulations outside of these boundaries have not been characterized.
The strong coupling between polymerization and crystallization appears clearly onFig. 14for low synthesis temperature (383–433 K), since the crystallization is restrained by the polymerization progress. At higher temperature, phenomena progressively separate due to the polymerization acceleration and crystallization deceleration, until a limit temperature of 468 K, above which the newly formed chains do not crystallize.
6. Conclusion
The Hillier's formalism demonstrated its ability in predicting the overall synthesis of polyamide 6 from its monomer ε-caprolactam. It accurately describes the influence of polymerization on the crystal-lization kinetics when synthesis is achieved at high temperature, i.e. when the coupling level of both phenomena is limited. This coupling equation resolves the lack of physical meaning of previous models from the literature as the level of coupling does not affect the final crystal-lization enthalpy.
Although the sole coupling fails in predicting the synthesis kinetics when crystallization is faster than polymerization at low temperature, it allows consideration that a PA6 molecule crystallizes as in bulk case with its own kinetics from the moment it is polymerized, but it does not consider the case of short molecules crystallizing in a dilute medium of reactive mixture.
This can be solved by introducing a corrective factor into the cou-pling without modifying the bulk crystallization model. This empirical factor, which depends on the degree of conversionα and temperature, provides a convenient and simple solution for that purpose. A better understanding of the crystallization of low molecular weight PA6 in the reactive mixture is however required to obtain a predictive modeling of PA6 synthesis that is suitable for non-isothermal modeling as well. An alternative to that corrective factor could be a crystallization model involving parameters that directly depend on the degree of conversion α.
Appendix A. Supplementary data
Supplementary data to this article can be found online athttps:// doi.org/10.1016/j.polymer.2019.121681.
References
[1] K. van Rijswijk, H.E.N. Bersee, Reactive processing of textile fiber-reinforced thermoplastic composites - an overview, Compos. Appl. Sci. Manuf. 38 (2007) 666–681.
[2] K. Khodabakhshi, M. Gilbert, P. Dickens, Monitoring of small-scale anionic poly-merization of caprolactam; a method to be used in an additive manufacturing process, Polym. Adv. Technol. 24 (2013) 503–510.
[3] K. Khodabakhshi, M. Gilbert, S. Fathi, P. Dickens, Anionic polymerisation of ca-prolactam at the small-scale via DSC investigations, J. Therm. Anal. Calorim. 115 (1) (2014) 383–391.
[4] O. Wichterle, J. Sebenda, J. Kralicek, The anionic polymerization of caprolactam, Adv. Polym. Sci. 2/4 (1961) 578–595.
[5] T. Komoto, M. Iguchi, H. Kanetsuna, T. Kawai, Formation of spherulites during
Fig. 13. Parameters C and D of the corrective factor fd versus synthesis
temperature.Tiso
Table 3
Parameters of Malkin-Camargo polymerization model identified by optimiza-tion on synthesis curves with Hillier coupling,
Nakamura-Hoffman-Lauritzen-tc,0crystallization model and corrective factor.fd
Parameter Value Unit
A0 1.86 10× 7 [s−1]
Ea 91.2 [kJ mol−1]
B0 47.4 [−]
np 1.14 [−]
polymerization of lactams, Makromol. Chem. 135 (1) (1970) 145–164. [6] O. Wichterle, J. Sebenda, J. Tomka, Adiabatic crystallization of amorphous
poly-caprolactame, J. Polym. Sci. B Polym. Phys. 57 (1962) 785–791.
[7] B. Wunderlich, Macromolecular Physics - Crystal Nucleation Growth Annealing vol. 2, Academic Press, 1976.
[8] V.V. Korshak, T.M. Frunze, S.P. Davtyan, V.V. Kurashev, T.V. Volkova, V.A. Kot’elnikov, R.B. Shleifman, Kinetics of activated anionic polymerization of ε-caprolactam under non-isothermal conditions, Polym. Sci. U. S. S. R. 21 (9) (1979) 2161–2169.
[9] S.P. Davtyan, P.V. Zhirkov, S.A. Vol’fson, Problems of non-isothermal character in polymerisation processes, Russ. Chem. Rev. 53 (2) (1984) 150.
[10] Céline Vicard, Olivier De Almeida, Cantarel Arthur, Gérard Bernhart, Experimental study of polymerization and crystallization kinetics of polyamide 6 obtained by anionic ring opening polymerization of ε-caprolactam, Polymer 132 (Supplement C) (2017) 88–97.
[11] K. van Rijswijk, Thermoplastic Composite Wind Turbine Blades - Vacuum Infusion Technology for Anionic Polyamide-6 Composites, Thèse, Technische Universiteit Delft, 2007.
[12] R.S. Davé, K. Udipi, R.L. Kruse, L.R. Stebbins, Polyamides from lactams via anionic ring-opening polymerization: 2. Kinetics, Polymer 38 (4) (1997) 939–947. [13] K.H. Lee, S.C. Kim, Reaction-induced crystallization kinetics during the anionic
polymerization of ε-caprolactam, Polym. Eng. Sci. 28 (1) (1988) 13–19. [14] A. Luisier, P.E. Bourban, J.-A.E. Månson, Time–Temperature–Transformation
dia-gram for reactive processing of polyamide 12, J. Appl. Polym. Sci. 81 (4) (2001) 963–972.
[15] E. Sittler, J. Sebenda, Alkaline polymerization of 6-caprolactam. XXXII. The kinetics of polymerization activated by N,N,N’,N’-tetraacetylhexamethylenediamine, Collect. Czechoslov. Chem. Commun. 33 (1968) 270–277.
[16] R.Z. Greenley, J.C. Stauffer, J.E. Kurz, The kinetic equation for the initiated anionic polymerization of ε-caprolactam, Macromolecules 2 (6) (1969) 561–567. [17] H.K. Reimschuessel, Ring-Opening Polymerization, Chapter Chapter 7. Kinetics of
Hydrolytic Polymerization, Marcel Dekker, 1969, pp. 303–326.
[18] A. Rigo, G. Fabbri, G. Talamini, Kinetic study of anionic polymerization of 6-ca-prolactam by differential calorimetry, J. Polym. Sci., Polym. Lett. Ed. 13 (8) (1975) 469–477.
[19] D.J. Lin, J.M. Ottino, E.L. Thomas, A kinetic study of the activated anionic poly-merization of ε-caprolactam, Polym. Eng. Sci. 25 (18) (Dec 1985) 1155–1163. [20] R.A. Cimini, D.C. Sundberg, A mechanistic kinetic model for the initiated anionic
polymerization of ε-caprolactam, Polym. Eng. Sci. 26 (8) (1986) 560–568. [21] P. Wittmer, H. Gerrens, Über die anionische schnellpolymerisation von
capro-lactam, Makromol. Chem. 89 (27) (1965).
[22] A. Ya Malkin, V.G. Frolov, A.N. Ivanova, Z.S. Andrianova, The nonisothermal an-ionic polymerization of caprolactam, Polym. Sci. U. S. S. R. 21 (3) (1979) 691–700. [23] S.A. Bolgov, V.P. Begishev, A. Ya Malkin, V.G. Frolov, Role of the functionality of activators during isothermal crystallization accompanying the activated anionic polymerization of ε-caprolactam, Polym. Sci. U. S. S. R. 23 (6) (1981) 1485–1492. [24] A. Ya Malkin, S.L. Ivanova, V.G. Frolov, A.N. Ivanova, Z.S. Andrianova, Kinetics of anionic polymerization of lactams. (Solution of non-isothermal kinetic problems by the inverse method), Polymer 23 (12) (1982) 1791–1800.
[25] A. Ya Malkin, V.P. Beghishev, S.A. Bolgov, The exothermal effects of superimposed processes of activated anionic polymerization of ε-caprolactam and crystallization of the polymer formed, Polymer 23 (3) (1982) 385–390.
[26] M.R. Kamal, S. Sourour, Kinetics and thermal characterization of thermoset cure, Polym. Eng. Sci. 13 (1) (1973) 59–64.
[27] S. Sourour, M.R. Kamal, Differential scanning calorimetry of epoxy cure: isothermal cure kinetics, Thermochim. Acta 14 (1–2) (1976) 41–59.
[28] A. Ya, Malkin. Rheology in polymerization processes, Polym. Eng. Sci. 20 (15) (1980) 1035–1044.
[29] R.E. Camargo, V.M. Gonzalez, C.W. Macosko, M. Tirrell, Bulk polymerization ki-netics by the adiabatic reactor method, Rubber Chem. Technol. 56 (4) (1983) 774–783.
[30] J.-L. Yeh, J.-F. Kuo, C.-Y. Chen, Adiabatic anionic polymerization of caprolactam in the presence of N-acylated caprolactam macroactivator: kinetic study, J. Appl. Polym. Sci. 50 (10) (1993) 1671–1681.
[31] K.J. Kim, Y.Y. Kim, B.S. Yoon, K.J. Yoon, Mechanism and kinetics of adiabatic anionic polymerization of ε-caprolactam in the presence of various activators, J. Appl. Polym. Sci. 57 (11) (1995) 1347–1358.
[32]K.J. Kim, D.S. Hong, A.R. Tripathy, Kinetics of adiabatic anionic copolymerization of ε-caprolactam in the presence of various activators, J. Appl. Polym. Sci. 66 (6) (1997) 1195–1207.
[33]J.J.E. Teuwen, A.A. van Geenen, H.E.N. Bersee, Novel reaction kinetic model for anionic polyamide-6, Macromol. Mater. Eng. 298 (2) (2013) 163–173. [34]S. Russo, S. Maniscalco, P. Moretti, L. Ricco, Fast-activated anionic polymerization
of ε-caprolactam in the bulk under quasi-adiabatic conditions: comparison of dif-ferent kinetic models, J. Polym. Sci. A Polym. Chem. 51 (20) (2013) 4474–4480. [35]J. Nagy, L. Reith, M. Fischlschweiger, G. Steinbichler, Modeling the influence of
flow phenomena on the polymerization ofε-caprolactam, Chem. Eng. Sci. 111 (0) (2014) 85–93.
[36]A. Ya Malkin, S.G. Kulochikhin, V.G. Frolov, M.I. Demina, Rheokinetics of anionic polymerization of caprolactam, Polym. Sci. U. S. S. R. 23 (6) (1981) 1471–1479. [37]A. Ya Malkin, V.P. Beghishev, I.A. Keapin, Macrokinetics of polymer crystallization,
Polymer 24 (1) (1983) 81–84.
[38]A. Ya Malkin, V.P. Beghishev, I.A. Keapin, S.A. Bolgov, General treatment of polymer crystallization kinetics - Part 1. A new macrokinetic equation and its ex-perimental verification, Polym. Eng. Sci. 24 (18) (1984) 1396–1401.
[39]A. Ya Malkin, V.P. Beghishev, I.A. Keapin, Z.S. Andrianova, General treatment of polymer crystallization kinetics - Part 2. The kinetics of nonisothermal crystal-lization, Polym. Eng. Sci. 24 (18) (1984) 1402–1408.
[40]K. Taki, N. Shoji, M. Kobayashi, H. Ito, A kinetic model of viscosity development for in situ ring-opening anionic polymerization of ε-caprolactam, Microsyst. Technol. 23 (5) (2017) 1161–1169.
[41] J.J.E. Teuwen, Large Thermoplastic Composite Wind Turbine Blades - Process Optimization for Vacuum Infusion of Large Blades. Technical Report, We@Sea, 2009.
[42] I.H. Hillier, Modified Avrami equation for the bulk crystallization kinetics of spherulitic polymers, J. Polym. Sci. - Part A Gen. Pap. 3 (9) (1965) 3067–3078. [43]J.D. Hoffman, Theoretical aspects of polymer crystallization with chain folds: bulk
polymers, Polym. Eng. Sci. 4 (4) (1964) 315–362.
[44]P.H. Lindenmeyer, Imperfections in polymer crystals, Kolloid-Z. Z. Polym. 231 (1) (1969) 593–605.
[45]J.H. Magill, Crystallization kinetics study of nylon 6, Polymer 3 (0) (1962) 655–664.
[46]P. Cebe, S.-D. Hong, Crystallization behaviour of poly(ether-ether-ketone), Polymer 27 (8) (1986) 1183–1192.
[47] K. Nakamura, T. Watanabe, K. Katayama, T. Amano, Some aspects of nonisothermal crystallization of polymers. I. Relationship between crystallization temperature, crystallinity, and cooling conditions, J. Appl. Polym. Sci. 16 (5) (1972) 1077–1091. [48] K. Nakamura, K. Katayama, T. Amano, Some aspects of nonisothermal
crystal-lization of polymers. II. Consideration of the isokinetic condition, J. Appl. Polym. Sci. 17 (4) (1973) 1031–1041.
[49] J.D. Hoffman, Treatise on Solid State Chemistry, Springer US, 1976. [50]K.-H. Illers, H. Haberkorn Schmelzverhalten, Struktur und Kristallinität von
6-Polyamid, Makromol. Chem. 142 (1) (1971) 31–67.
[51]I. Kolesov, D. Mileva, R. Androsch, C. Schick, Structure formation of polyamide 6 from the glassy state by fast scanning chip calorimetry, Polymer 52 (22) (2011) 5156–5165.
[52]C. Schick, V. Mathot, Fast Scanning Calorimetry, first ed., Springer International Publishing, 2016.
[53]C.N. Velisaris, J.C. Seferis, Crystallization kinetics of polyetheretherketone (PEEK) matrices, Polym. Eng. Sci. 26 (22) (1986) 1574–1581.
[54]P. Cebe, Application of the parallel avrami model to crystallization of poly(ether-etherketone), Polym. Eng. Sci. 28 (18) (1988) 1192–1197.
[55]J.J.E. Teuwen, Thermoplastic Composite Wind Turbine Blades - Kinetics and Processability, Thèse Technische Universiteit Delft, 2011.
[56]J. Merna, D. Chromcova, J. Brozek, J. Roda, Polymerization of lactams: 97. Anionic polymerization of ε-caprolactam activated by esters, Eur. Polym. J. 42 (7) (2006) 1569–1580.
[57] P.W. Sibal, R.E. Camargo, C.W. Macosko, Designing nylon-6 polymerization sys-tems for RIM, Polym. Process Eng. 1 (2) (1984) 147–169.
[58]N. Okui, S. Umemoto, R. Kawano, A. Mamun, Temperature and Molecular Weight Dependencies of Polymer Crystallization, Springer Berlin Heidelberg, Berlin, Heidelberg, 2007, pp. 391–425.
[59]B. Crist, J.M. Schultz, Polymer spherulites: a critical review, Prog. Polym. Sci. 56 (2016) 1–63.