Biodiversity mediates top-down control in eelgrass ecosystems: A
global comparative-experimental approach
J. Emmett Duffy1,2, Pamela L. Reynolds1, Christoffer Boström3, James A. Coyer4, Mathieu
5
Cusson5, Serena Donadi6, James G. Douglass7, Johan S. Eklöf8, Aschwin H. Engelen9, Britas Klemens Eriksson6, Stein Fredriksen10, Lars Gamfeldt11, Camilla Gustafsson12, Galice Hoarau13, Masakazu Hori14, Kevin Hovel15, Katrin Iken16, Jonathan S. Lefcheck1, Per-Olav Moksnes11, Masahiro Nakaoka17, Mary I. O'Connor18, Jeanine L. Olsen6, J. Paul Richardson1, Jennifer L. Ruesink19, Erik E. Sotka20, Jonas Thormar10, Matthew A. Whalen21, and John J. Stachowicz21
10
1. Virginia Institute of Marine Science, Gloucester Point, VA 23062-1346, USA. ([email protected], [email protected], [email protected], [email protected])
2. Tennenbaum Marine Observatories Network, Smithsonian Institution, Washington, DC 20013-7012, USA. ([email protected])
15
3. Åbo Akademi University, Department of Biosciences, Environmental and Marine Biology, 20520 Åbo, Finland. ([email protected], [email protected])
4. Shoals Marine Laboratory, Cornell University, Portsmouth, NH 03801, USA. ([email protected]) 5. Département des sciences fondamentales & Québec-Océan, Université du Québec à Chicoutimi,
Chicoutimi (Québec), G7H 2B1 Canada. ([email protected]) 20
6. Centre for Ecological and Evolutionary Studies, University of Groningen, 9747 AG Groningen, The Netherlands. ([email protected], [email protected], [email protected])
8. Department of Ecology, Environment and Plant Sciences, Stockholm University, 106 91 Stockholm Sweden. ([email protected])
25
9. Centro de Ciências do Mar do Algarve (CCMAR), University of Algarve, 8005 139 Faro, Portugal. ([email protected])
10. University of Oslo, Department of Biosciences, 0316 Oslo, Norway. ([email protected], [email protected])
11. Department of Biological and Environmental Sciences, University of Gothenburg, SE-405 30 30
Göteborg, Sweden. ([email protected], [email protected]) 12. Tvärminne Zoological Station, University of Helsinki, 10900 Hanko, Finland..
13. Faculty of Biosciences and Aquaculture, University of Nordland, 8049, Bodø, Norway. ([email protected])
35
14. Fisheries Research Agency, 739-0452 Hiroshima, Japan. ([email protected]) 15. Department of Biology, San Diego State University, San Diego, CA 92182, USA.
16. School of Fisheries and Ocean Sciences, University of Alaska Fairbanks, AK 99775, USA. ([email protected])
40
17. Akkeshi Marine Station, Field Science Center for Northern Biosphere, Hokkaido University, Aikappu, Akkeshi, Hokkaido 088-1113, Japan. ([email protected])
18. Department of Zoology and Biodiversity Research Centre, University of British Columbia, Vancouver, B.C., Canada V6T 1Z4. ([email protected])
19. Department of Biology, University of Washington, Seattle, WA 98195, USA. 45
20. Grice Marine Laboratory, College of Charleston, Charleston, SC 29412, USA. ([email protected])
21. Department of Evolution and Ecology, 1 Shields Ave, University of California, Davis CA 95616, USA. ([email protected], [email protected])
50
Statement of authorship: J.E.D. designed the study; J.E.D. and P.L.R. coordinated the Zostera Experimental Network; P.L.R. and J.P.R. led logistics; all authors performed field research and lab analyses; J.L.O. and J.A.C. conducted the genetic analyses; J.E.D., P.L.R., and J.S.L. 55
analyzed the data; J.E.D. drafted the manuscript, with substantial input from P.L.R., and J.J.S.; C.B., J.A.C., M.C., J.S.E., B.K.E., S.F., L.G., C.G., M.H., K.H., K.I., P.-O.M., M.N., J.S.L., M.I.O, P.L.R., J.P.R., J.L.R., E.E.S., J.J.S., J.T., M.A.W. commented on and edited the MS.
Running title: Biodiversity and top-down control in eelgrass 60
Keywords: biodiversity-ecosystem functioning | bottom-up control | coordinated experiments | food webs | metabolic ecology | structural equation modeling | top-down control
Manuscript information 65
Type of article: Letter Abstract: 150 words Main text: 5407 words References: 50
Figures and tables: 3, 1 70
J. Emmett Duffy
Tennenbaum Marine Observatories Network PO Box 37012, NHB MRC 106 75 Smithsonian Institution Washington, DC 20013-7012 E-mail: [email protected] Phone: 202-633-4037 Fax: 202-633-0490 80
Abstract
Nutrient pollution and reduced grazing each can stimulate algal blooms as shown by numerous 85
experiments. But because experiments rarely incorporate natural variation in environmental factors and biodiversity, conditions determining the relative strength of bottom-up and top-down forcing remain unresolved. We factorially added nutrients and reduced grazing at 15 sites across the range of the marine foundation species eelgrass (Zostera marina) to quantify how top-down and bottom-up control interact with natural gradients in biodiversity and environmental forcing. 90
Experiments confirmed modest top-down control of algae, whereas fertilization had no general effect. Unexpectedly, grazer and algal biomass were better predicted by cross-site variation in grazer and eelgrass diversity than by global environmental gradients. Moreover, these large-scale patterns corresponded strikingly with prior small-scale experiments. Our results link global and local evidence that biodiversity and top-down control strongly influence functioning of
95
threatened seagrass ecosystems, and suggest that biodiversity is comparably important to global change stressors.
INTRODUCTION
Nutrient pollution and alteration of food webs by exploitation and invasion are two of the 100
dominant human impacts on natural ecosystems. A wealth of evidence from controlled experiments confirms that each can be important in certain situations, fueling a long-running debate about the conditions favoring bottom-up versus top-down forcing and their management implications (Hunter & Price 1992; Cloern 2001; Heck & Valentine 2007; Gruner et al. 2008; Eriksson et al. 2009). Manipulative approaches have greatly advanced our understanding of how 105
systems are often unclear. By design such experiments hold constant many other environmental and human factors known to strongly influence ecosystem processes, raising the question of how important the manipulated factors are relative to other drivers. These include, in particular, the spatial variation in environment and biodiversity that are characteristic of wild ecosystems but 110
that are rigorously controlled in most experiments. Resolving these issues poses formidable challenges, requiring new approaches that can integrate the power of experiments with observational data on those regional processes that cannot be manipulated (Grace 2006;
Cardinale et al. 2012). One such hybrid approach involves a coordinated experimental network, in which simple controlled experiments are replicated across space, allowing for the
115
incorporation of environmental context into the analysis. Such networks have made important advances, for example, in understanding nutrient dynamics in terrestrial grasslands (Borer et al. 2014).
The Zostera Experimental Network (ZEN, www.zenscience.org) seeks to understand how complex regional and local processes interact to mold community and ecosystem structure by 120
focusing on communities associated with the marine foundation species, eelgrass (Zostera
marina), which is distributed across a broad range of conditions and biogeographic provinces
(Moore & Short 2006). Eelgrass creates habitat for productive and economically important communities along coasts and estuaries throughout the northern hemisphere, supporting assemblages of epifaunal herbivores and detritivores, including small crustaceans, gastropod 125
mollusks, and polychaete worms. These mesograzers feed on micro- and macroalgae that grow on seagrass blades and are important conduits of production to higher trophic levels including commercial and recreational fisheries (Valentine & Duffy 2006). Seagrass dominance requires low biomass of competing algae, which is maintained by a combination of grazing and low
nutrient conditions. This balance can be upset by food-web perturbations that reduce grazing on 130
algae, or by nutrient loading that stimulates algal accumulation, but the relative importance of these bottom-up and top-down factors in the dynamics of seagrass systems remains a subject of debate (Hughes et al. 2004; Heck & Valentine 2007).
Complementing the long interest in relative importance of top-down and bottom-up forcing, a parallel line of research has focused on biodiversity—including species and genetic 135
richness—as an important driver of ecosystem structure and functioning. Numerous experiments have now converged on the conclusion that declining variety of species, genetic lineages, and functional types generally results in declining ecosystem productivity and stability across a range of systems (Cardinale et al. 2011; 2012). In eelgrass systems specifically, prior experiments implicate both genetic and species richness in mediating the key interaction between grazers and 140
epiphytic algae in eelgrass beds: plots planted with genotypically diverse eelgrass recruited denser fauna (Hughes & Stachowicz 2004; Reusch et al. 2005), and plots seeded with species-rich grazer assemblages more effectively controlled epiphytic algae (Duffy et al. 2003; 2013). Yet it remains unclear how results from controlled experiments in mesocosms or single field sites translate to nature where many factors interact to drive productivity, trophic transfer, and 145
other ecosystem processes (Srivastava & Vellend 2005).
Community functional composition and richness are potentially central in mediating the strength of top-down control and responses to changing resources (Strong 1992; Polis & Strong 1996; Oksanen & Oksanen 2000; Duffy et al. 2007). We sought to link these research traditions by testing whether the signature of biodiversity effects are apparent across larger scales, in 150
naturally variable ecosystems, and specifically whether they influence the relative importance of top-down versus bottom-up forcing. To do so we conducted coordinated manipulations of
nutrients and grazing across 15 sites spanning the northern hemisphere (Fig. 1a, Table S1) and encompassing the global spectrum of environments supporting eelgrass, including a natural gradient in grazer species richness from 5 to 27 species (Fig. S1). Our experimental treatments 155
simulated two major human influences on coastal ecosystems: nutrient pollution and fishing-induced food web changes that weaken top-down control (Heck & Valentine 2007; Duffy et al. 2013). Both types of perturbation have been demonstrated at various locations to cause blooms of epiphytic algae that compete with eelgrass, reducing its dominance (Duffy et al. 2013) and potentially tipping the system between states dominated by seagrass versus epiphytic algae 160
(Reynolds et al. 2014). We evaluated how these bottom-up and top-down processes are influenced by environment and biodiversity, specifically eelgrass genetic and grazer species diversity, of the local community using path analysis (Grace 2006), by integrating experimental data with natural variation among communities and controlling statistically for cross-site variation in biodiversity, environmental, and potential anthropogenic drivers.
165
We used path analysis to test the following hypotheses (Fig. 2a). First we expected that grazing impacts on plants should increase with environmental temperature (O'Connor 2009), and with plant nitrogen content (Mattson 1980). Based on prior experimental work we hypothesized that biodiversity (grazer species richness) should increase resistance to perturbations, in this case experimental nutrient addition, and that increasing grazer richness should increase grazer
170
biomass and grazing pressure on algae (Duffy et al. 2003). Human influence is likely to have strong impacts on structure and functioning of eelgrass systems through a variety of mechanisms but the specific expectations for grazer and algal biomass depend on food-web structure and the specific types of impact. Our comparative-experimental study demonstrated that grazer reduction has generally stronger effects on algal biomass in eelgrass ecosystems than does local nutrient 175
addition, and that grazer and algal biomass were better predicted by cross-site variation in biodiversity than by global environmental gradients.
MATERIALS AND METHODS The ZEN field experimental module 180
In summer 2011 we conducted identical field experiments at 15 sites (Fig. 1a, Table S1) encompassing the geographic range of eelgrass (32-67° N) and a broad range in environmental conditions (Fig. S1). Each experiment was a 2-way factorial experiment crossing nutrient fertilization with crustacean mesograzer reduction. Forty plots were established at each site at depths between 0.5-3 m below mean low water. Each plot was defined by three PVC stakes 185
forming a triangle ~50 cm on a side. Crustacean grazer reduction was accomplished by attaching a plaster block containing the degradable insecticide carbaryl (Poore et al. 2009; Whalen et al. 2013), hereafter deterrent, or alternatively a plaster control block to each stake. Fertilization was accomplished by attaching a mesh bag containing 300 g of slow-release fertilizer (Plantacote™, N:P:K = 14:14:14), or an empty mesh control bag, to one pole of each plot. Thus, there were ten 190
plots of each of the four combinations of fertilizer (present, absent) and grazer deterrent (present, absent) at each site. Carbaryl effects on crustaceans extended ~60 cm from the source (Whalen et
al. 2013). Plots were separated by > 2 m. The experiment was maintained for approximately four
weeks at each site, a period long enough to see effects in pilot studies (Whalen et al. 2013). At the end of the experiment we measured the abundance and species composition of 195
epifauna, including mesograzers, in each plot by enclosing eelgrass and associated fauna in a 500 µm-mesh bag underwater, removing the fauna from the plants in the lab, and preserving in 70% ethanol. Epifaunal animals (excluding meiofauna) were identified and size-fractionated to
estimate biomass using empirical equations (Edgar 1990). Faunal biomass was standardized to above-ground plant biomass (mg fauna g plant-1). A separate eelgrass shoot was removed from 200
each plot and scraped to obtain microalgal biomass (µg chl a g dry Zostera-1), which was
measured spectrophotometrically or fluorometrically (Duffy et al. 2003). Biomasses of epiphytic algae, grazing crustaceans, and grazing gastropods constituted the response variables of primary interest. Eelgrass leaf nitrogen content was quantified in standardized young leaf material from five pooled shoots in each plot at the end of the experiment using a CHN analyzer.
205
Site characteristics
We collected data on several variables to assess how experimental effects varied across environmental context. At the site level, we measured water temperature throughout the experiment using HOBO Pendant ® temperature loggers, and salinity via
210
refractometers. Eelgrass leaf % N was measured from ambient (control) plots and averaged across plots to obtain a proxy for site-level nutrient status (Burkholder et al. 2007). As a rough measure of anthropogenic influences, we obtained estimates of human population density near each site using the LandScan™ Global Population Database (Oak Ridge National Laboratory), implemented in National Geographic’s Mapmaker Interactive
215
(http://mapmaker.education.nationalgeographic.com); this tool presents human population density on a 5-point ordinal scale (bins) from <1 to >500 per cell.
We measured two aspects of biodiversity shown previously to influence eelgrass
ecosystem properties in experiments. Eelgrass genotypic richness at a site was calculated as the sum of unique genotypes found among the 40 plots. Mesograzer species richness was estimated 220
aggregate diversity at the site level as we consider the list of species sampled at the site a better measure of the species potentially visiting a plot during the experiment than the single, final sampling point from that plot. To assess whether our richness estimates were affected by the number of individuals sampled, we employed fixed-coverage subsampling, a variant of 225
rarefaction (Chao & Jost 2012). This approach extrapolates site-level estimates of richness based on sample ‘completeness,’ or the proportion of individuals in the community estimated to belong to species detected by sampling, and thus can be used to determine whether our efforts yielded richness estimates close to their asymptotic maximum.
All statistical analyses were conducted using R 3.03 (R Development Core Team 2013). 230
Eelgrass genetic analyses
Collection of eelgrass samples (40 ramets per site, i.e., one per plot), DNA extraction,
microsatellite amplification and genotyping followed Olsen et al. (2013). Six microsatellite loci (CT2, CT35, CT12, CT17D, CT19, CT20) were scored (Reusch et al. 1999; Reusch 2000). The 235
numbers of genets sampled at a site was distinguished with GENCLONE 2.0 (Arnaud-Haond &
Khalid 2007), considering as identical only those genets with non-significant probabilities of identity by chance (Psex (FIS)). Genotypic richness, R (number of unique genets, G–1 divided by
the number of sampled ramets, N–1) was also calculated with GENCLONE 2.0. Here we report
values of genotypic richness per site (R). 240
Path analysis of combined experimental and observational data
We expressed hypotheses about the integrated functioning of the eelgrass ecosystem as graphical networks of interaction paths, and analyzed each as a set of linked equations using path analysis
(a variant of the broader field of structural equation models, but which uses only observed rather 245
than latent variables, Figs. 2a, S3). An advantage of SEM for studying complex systems is that, by linking together component models for different response variables, it allows rigorous
estimation of indirect effects and tests of the overall fit of a complex, causal network of influence (Grace 2006). Models were fit using data from the 40 plots at each of 15 sites for a total of 600 sampling units. Predictors included the following exogenous variables, i.e., whose variance arose 250
outside the model: (1) experimental treatments (grazer deterrent, fertilization, their interaction, and unmanipulated control), (2) biogeographic variation (latitude, ocean [Atlantic vs. Pacific]), (3) abiotic forcing factors, including temperature, salinity, nutrient availability proxied as eelgrass % N (Burkholder et al. 2007), and (4) human population density. Endogenous variables are those whose variation the model seeks to explain (response variables), including in our case 255
biodiversity (eelgrass genotypic richness, grazer species richness), and biomasses of crustacean grazers, gastropod grazers, and algae.
Preliminary exploration found that simple models with few explanatory variables had poor overall fit via D-separation tests (see below). Therefore we developed a set of candidate models by first removing paths from the “full” model (containing nearly all possible paths, 260
Figure 2a, Table 1) to test their hypothesized importance. Next we used the best fitting models from this process and added interaction terms to test specific hypotheses about how bottom-up and top-down processes should vary with latitude, temperature, and biodiversity. Including the full model 1 incorporating all paths of interest, we fit 14 candidate models that tested the influence of the experimental and environmental variables listed above on biomasses of algae, 265
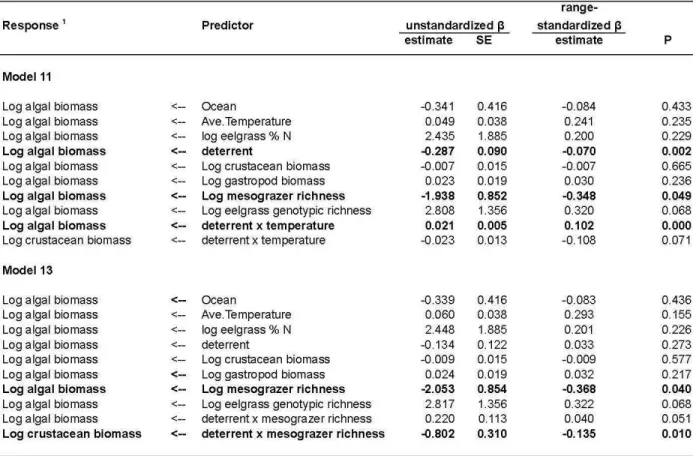
crustacean and gastropod grazers (models 2-10), along with interactions motivated by theory (models 11-14, Table 1, Figure S3). To test the metabolic hypothesis that grazing impacts
(measured as effect of grazer deterrent on algae) should increase with environmental
temperature, model 11 incorporated an interaction between grazer deterrent and temperature. We also tested the related hypothesis that grazer impacts should decrease with latitude by
270
incorporating an interaction of deterrent effect and latitude (model 12). We tested the hypothesis that grazing is more effective where grazer richness is higher by incorporating an interactive effect of grazer richness and grazer deterrent on algae (model 13); the hypothesis is supported if the interaction is significant and positive. Finally, model 14 tested the hypothesis that grazer richness promotes resistance against nutrient loading; this hypothesis is supported if fertilization 275
increases algal biomass less at sites with higher grazer richness (negative interaction of grazer richness and fertilization effect on algae). Because we used mean leaf % nitrogen of control plots as a proxy for site nutrient status in the path analyses, effects of experimental treatments on leaf % nitrogen were estimated separately across sites.
Our study design produced hierarchical (i.e., multilevel) data at two nested levels (40 280
plots within each of 15 sites, for a total of 600 plots), As a result the analysis proceeded in two phases. In the first phase, we sought to explain variation in the two endogenous variables measured at the site level, i.e., grazer species richness and eelgrass genotypic richness (all other endogenous variables were measured at the plot level). Because these two biodiversity variables were measured at the site level (taking 15, rather than 600, unique values), they had no
285
hierarchical structure and were therefore modeled using standard multiple linear regressions. This analysis showed that the only significant predictor of grazer and eelgrass richness was latitude (compare models 1 and 2, Table 1), so the influence of latitude was retained as the sole predictor of grazer species richness and eelgrass genotypic richness in all subsequent models (models 3-14) that focused on the plot-level variables of algal and grazers biomasses. 290
In the second, main phase of analysis we sought to understand the drivers of plot-level biomasses of algae and crustacean and gastropod grazers, corresponding to the hypotheses described in Table 1. Because some predictor variables were measured at plot level (with 600 unique values) and others at the site level (with 15 unique values), we modeled the responses with linear mixed effects models, including a random effect modeling variation in intercepts 295
among the 15 sites. In this phase we used Shipley’s (2009) approach to estimating a multilevel path model using directional separation (D-sep) tests. This approach constructs the path model as a set of hierarchical linear mixed models, each of which was fit using restricted maximum
likelihood with the nlme package (version 3.1-117), in R, and the overall path model (the SEM) was fit using the R package piecewiseSEM (Lefcheck & Duffy 2014). Prior to fitting the models 300
we graphically examined distributions of all variables for outliers and severe departures from normality. Most biological variables were log10-transformed to improve normality. One path in
the final model—connecting biomasses of crustacean and gastropods (Fig. 2b), was considered a correlated error rather than a directed causal path because the positive coefficient seemed best interpreted as reflecting parallel responses to unmeasured forcing variables.
305
We selected among candidate models using two criteria. First, goodness of fit was estimated for each path model using Shipley’s (2009) test of directional separation (d-sep), which combines the significance of unrealized paths into a single, χ2-distributed Fisher’s C statistic. For each candidate model that passed this test of adequate fit (P > 0.05) we then computed an AIC value using Shipley's (2013) general approach to computing AIC in path 310
analyses. Finally, AIC weights were calculated and compared to evaluate the relative support for each candidate model. We graphically assessed the validity of model assumptions by plotting the residuals against the fitted values of each component model.
Once a model was chosen, we compared the relative importance of its predictor variables using standardized path coefficients. We standardized coefficients to the relevant ranges of the 315
component variables as recommended by Grace (2006). A raw coefficient βxy expressing the effect of x on y is range-standardized as β.rangexy = βxy * (xmax – xmin) / (ymax - ymin), where the
max and min values represent the largest and smallest values of the variables recorded in the data set (see Fig. S1). This approach produces a dimensionless coefficient that is easily interpretable in the original units. For example a β.std value of -0.349 for effect of grazer richness on
320
microalgal biomass means that microalgal biomass is expected to decline by 35% of its measured range as one moves across the entire measured range of grazer richness, when the influence of other variables is controlled for. Marginal R2 values for endogenous variables were calculated from the best model (model 10) using an approach designed for hierarchical mixed models (Nakagawa & Schielzeth 2013).
325
Finally, to visualize key relationships among variables in our best model while accounting for the influence of other covariates, we generated partial correlation plots. The partial correlation between X and Y measures the association between X and Y when effects of all other variables in the model have been controlled statistically; it is visualized by plotting r(X|others) vs r(Y|others), where r(X|others) consists of the residuals of X from the linear model that
330
regresses X on all variables included in the final model except for Y. Similarly, r(Y|others) are the
residuals of the model that regresses Y on all variables except X. Where the model contains only site-level predictors the residuals used to calculate the partial correlation will take only as many values as there are sites (15 in our case) on the x axis (Fig. 3a,c), whereas when the model contains a predictor measured at the plot level (e.g., crustacean biomass) the residuals are not so 335
Meta-analysis of prior experiments
To explore parallels between the cross-site patterns found in our study and those of previous small-scale experiments, we extracted and summarized data from previous experiments 340
manipulating biodiversity and/or nutrient fertilization in eelgrass systems (Table S3). We focused on experiments that manipulated eelgrass genotypic richness, species richness of eelgrass-associated mesograzers, and/or experiments that measured responses of both algae and grazers to nutrient fertilization (references are cited in Table S3). For comparison on a common scale, all values were standardized to a range of zero to one by dividing each value by the highest 345
value within that study.
RESULTS
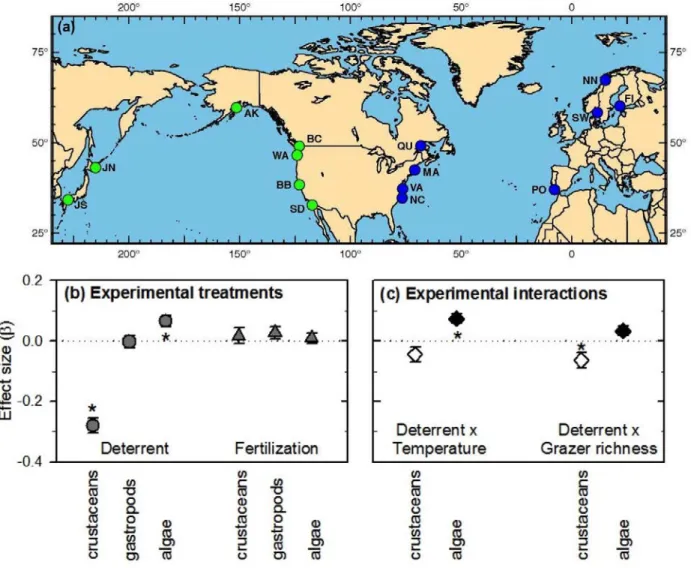
The coordinated experiment revealed stronger top-down control of microalgae by grazers than bottom-up control by fertilization, on average, across the geographic range of eelgrass (Fig. 1). 350
This pattern of top-down control was also supported by path analysis showing negative covariation of algae and grazer assemblages across the 15 sites. Path analyses integrating the experimental (within-site) and observational (cross-site) data produced two very similar models, which compared with the other 12 models examined, had a combined AIC weight of 0.98 (Models 9 and10, Table 1, Figure 2b). Two additional models estimated to test the a priori 355
hypotheses of interactions of grazer deterrent with temperature (model 11) and grazer richness (model 13) had poorer overall fit (each with AIC weight of 0.07) but significant interaction paths (Table S2b). All four models included a highly significant negative effect of deterrent on
microalgae (Fig. 1b, Table S2a,b). In contrast, none of the best models included a significant 360
effect of experimental fertilization on algal biomass (Fig. 1b, Table S2b), and removal of paths representing fertilization effects improved model fit (i.e., AIC, compare model 3 with 2, Table 1). The importance of top-down control of algae by mesograzers is further emphasized by the model (4) that omitted the path between deterrent and grazer biomass, which had by far the least explanatory power of any candidate model (delta AIC = 157). The absence of experimental 365
fertilization effects on microalgae or grazers raises the question whether the treatment was adequate to raise local nutrient levels. A separate analysis suggests that it was, since
experimental fertilization did increase average eelgrass nitrogen content (P = 0.044, Fig. S2) The dominance of top-down versus bottom-up control of algae in the experiments was mirrored by patterns in the observational data, i.e., cross-site relationships among nutrient status, 370
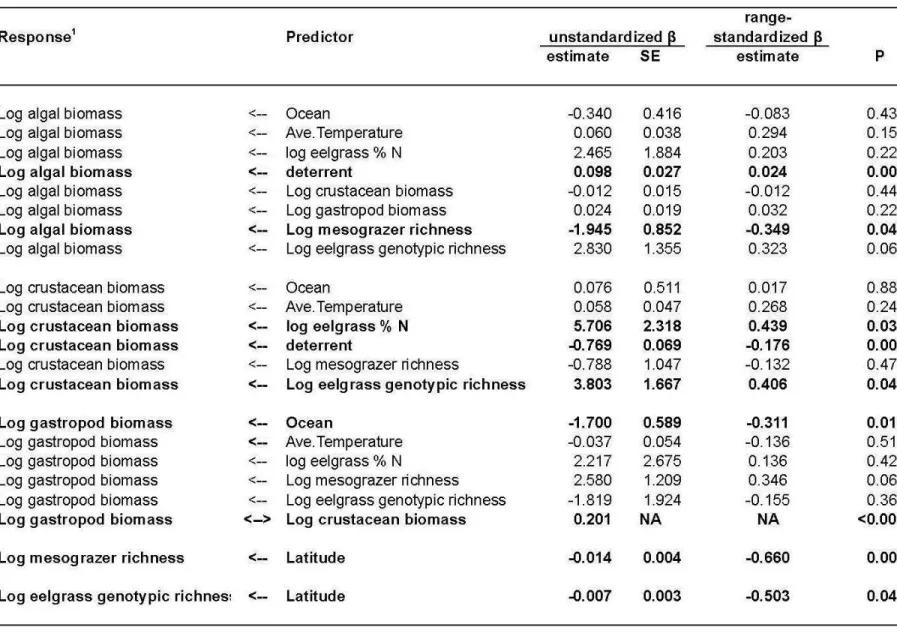
grazers, and algal biomass. Specifically, none of the best path models showed a significant path from eelgrass nitrogen content (a proxy for site nutrient status) to algal biomass, whereas all included a strong effect of this proxy for nutrient status on crustacean grazer biomass (Fig. 2b, Table S2). The latter result confirms that, as in the experiment, variation in site nutrient status was ecologically significant but did not affect local algal biomass, presumably due to efficient 375
trophic transfer of the nitrogen through algae to grazers as a result of strong top-down control by grazers.
We tested four a priori hypotheses to explain geographic variation in top-down control by fitting interactions between grazing impact (estimated as deterrent effect on algae) and environmental factors or biodiversity. Model 11, testing the role of temperature on grazing, 380
revealed a strong positive interactive effect of temperature and deterrent on algae (P < 0.001), suggesting that top-down control generally strengthened in warmer areas (Fig. 1c). Model 13,
testing how grazing varied with grazer richness, showed a tendency for higher grazing impact (i.e., more positive deterrent effect on algae) at sites with higher grazer richness (P = 0.051, Fig. 1c). Although the paths corresponding to these a priori hypotheses were supported, the models 385
had considerably lower AIC support (AIC weight = 0.07 for each) compared with the best model 10. Model 14’s hypothesis that more diverse grazer assemblages confer resistance to nutrient loading was not supported, as indicated by the poor fit of this model, which included a negative interaction between grazer richness and fertilization effect on algae (Table 1, Fig. 1c). Model 12, testing whether grazing impact declined with latitude, independent of covarying gradients in 390
temperature, was also poorly supported (Table 1, Fig. 1c), suggesting that temperature alone is a better predictor of grazing impact than latitude.
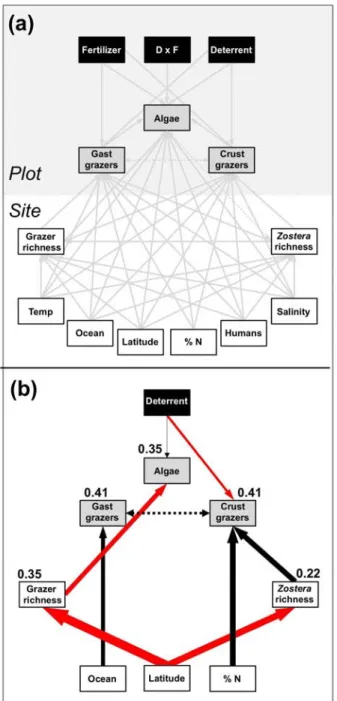
Analysis of cross-site patterns indicated that top-down impacts on algal biomass were mediated primarily by variation in grazer species richness rather than by variation in grazer biomass (Fig. 2b). Indeed the best-supported path models revealed, surprisingly, that eelgrass 395
genotypic richness and grazer species richness were equally strong predictors of algal and grazer biomass as were among-site differences in resource (nitrogen) status. The biodiversity variables also were stronger predictors than variation across the global range in temperature or salinity, neither of which significantly affected grazer or algal biomass (Fig. 2b, Table S2). A model (5) that omitted effects of biodiversity (grazer species richness and eelgrass genotypic richness) on 400
algal and grazer biomass had an AIC weight near zero (Table 1). Both grazer species richness and eelgrass genotypic richness declined with increasing latitude, and the models show that these large-scale gradients in biodiversity were the dominant direct influences on grazer and algal biomass (Fig. 2b). Sites with more genotypically diverse eelgrass supported higher biomass of crustacean grazers (Fig. 2b, 3a) and sites with higher grazer species richness supported lower 405
algal biomass (Fig. 2b, 3b); indeed natural variation in grazer richness had an order of magnitude stronger effect on algae in the model than did variation in grazer biomass (Table S2). Finally, sites with more grazer species supported higher biomass of gastropod grazers (Fig. 2b).
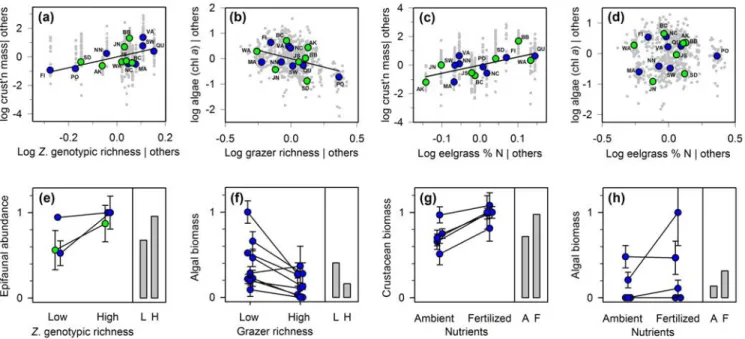
When effects of biodiversity were isolated by controlling statistically for other factors using partial correlations, the strong influences of biodiversity emerging from cross-site 410
comparison (100s to 1000s of km) in our analysis were strikingly similar to patterns documented in prior experiments comparing mesocosm or replicate field plots separated by meters to 10s of meters (Fig. 3a,b, Table S3). These cross-site comparisons also corroborate prior results showing that experimental fertilization tends to raise biomass of crustacean grazers but not of algae (Fig. 3c,d).
415
DISCUSSION
Our coordinated experiment showed that removing grazers had a considerably stronger average effect on microalgal biomass than did local addition of nutrients at sites across the global range of eelgrass ecosystems, and that the importance of grazers in controlling algae increased with 420
temperature and with species richness of the grazer assemblage. Integrated analysis of
experimental and observational data via path analysis revealed two surprising results. First, the influence of cross-site variation in biodiversity (eelgrass genotypes and mesograzer species richness) and environmental drivers generally overwhelmed experimental effects of grazer and nutrient manipulation across the global range. Eelgrass and grazer richness were as strong 425
predictors of algal and grazer biomass as differences in resource (nitrogen) status, and were stronger predictors than temperature or salinity, neither of which affected biomass in the best models. Path analysis showed that latitude explained variation in biodiversity, which in turn
strongly influenced both plant and animal biomass. In contrast, the major environmental factor varying with latitude, temperature, had no main effect on algal and grazer biomass after 430
controlling for grazer species richness (Fig. 2b, Table S2) although top-down control tended to be stronger at warmer sites (Fig. 1c).
Second, the strong influences of biodiversity in our global analysis were strikingly similar to results of prior small-scale experiments. This concordance addresses the common concern that biodiversity effects on functioning documented in experiments may derive from 435
simplified conditions of questionable relevance to nature (Srivastava & Vellend 2005). Several points illustrate the match between our observational data, comparing sites around the globe, and prior small-scale experimental data. First, the higher crustacean biomass at sites with more genotypically diverse eelgrass (Fig. 3a) matches previous experimental findings of increased invertebrate abundance in genotypically diverse eelgrass (Fig. 3e). This can be due to greater 440
eelgrass biomass in genotypically diverse plots (Hughes & Stachowicz 2004; Reusch et al. 2005), or because growth of individual herbivores is greater on diets of mixed genotypic composition (Tomas et al. 2011). Second, the lower algal biomass at sites with more grazer species (Fig. 3b) mirrors the stronger control of algal growth by diverse grazers in numerous eelgrass mesocosm experiments (Fig. 3f). Although we were unable to collect data on change in 445
eelgrass biomass in our experiments, small scale experiments find that stronger grazing on algae does increase eelgrass growth (Hughes et al. 2004; Reynolds et al. 2014).
This concordance of patterns from previous experiments and from our global
comparative analysis also extended to bottom-up control of grazer production. Nutrient status, proxied by eelgrass tissue nitrogen content (Burkholder et al. 2007), was strongly positively 450
3c,d). Similarly, in prior experiments, fertilization consistently increased the biomass of eelgrass-associated grazers, but not of epiphytic algae (Moksnes et al. 2008; Spivak et al. 2009; Baden et
al. 2010) (Fig. 3g,h). This pattern of fertilization “bypassing” plants to increase grazers suggests
that nitrogen enhances algal productivity, but that (initially at least) it is immediately grazed and 455
channeled into increasing herbivore biomass. Why then did experimental fertilization not increase crustacean biomass in our plots (Fig. 1b,c, Fig. 2b)? The most likely explanation is that these epifaunal crustaceans are sufficiently mobile that they dispersed from the small plots or were consumed by predators, resulting in no net accumulation of grazer biomass. In contrast, previous experiments used cages or mesocosms, which prevent the predation or export of 460
nutrient-stimulated grazer production. Our results thus reinforce prior findings that moderate nutrient loading often fails to stimulate algal blooms when natural grazing pressure is maintained (Heck & Valentine 2007; Eriksson et al. 2009; Hughes et al. 2013) and that intact food webs may provide resistance against eutrophication in seagrass ecosystems.
The effects of biodiversity in our global analyses derive from comparisons among sites 465
differing naturally in eelgrass and grazer richness, raising the possibility that these effects might not be causal. We consider this unlikely for several reasons. First, our results corroborate theory predicting that higher grazer richness both depresses producer biomass and increases grazer biomass (Holt & Loreau 2002). Second, the patterns we observed match those documented at smaller scales in multiple controlled experiments in eelgrass (Fig. 3, Table S3) and other systems 470
(Cardinale et al. 2012). Third, the mechanisms involved should apply across scales: control of algae by diverse grazers involves both differences in feeding biology among species
(complementarity) and dominance of strong grazer species (sampling effects) (Duffy et al. 2003; Best et al. 2013), both of which seem equally likely to operate at regional and small plot scales.
Fourth, the effects of biodiversity in our study emerged from path models that controlled 475
statistically for many potentially confounding influences including latitude, temperature, and nutrients. Finally, a mechanistic link between grazer richness and top-down control is also consistent with the positive, albeit marginally significant, interactive effect of deterrent and grazer richness on algae (model 13, P = 0.051), indicating that grazing pressure tends to be stronger—and grazer deterrent is thus more effective at stimulating algal accumulation—at sites 480
with high grazer richness.
It is also conceivable that the direction of causality might be opposite that of our predictions in some cases. Specifically, environmental conditions promoting higher abundance might also accumulate more species (rather than vice versa as we have hypothesized) because a larger random sample of individuals tends to contain more species from a given source pool. To 485
test for such artifacts we employed a fixed-coverage subsampling approach (Chao & Jost 2012). This analysis revealed that observed richness ranged from 89-100% completeness across our 15 sites, with a mean of 98%, strongly suggesting that our estimates of grazer richness are robust and comparable among sites. Moreover, such sampling effects could not easily explain the negative relationship, across trophic levels, of grazer richness with algal biomass (Fig. 3), i.e., it 490
is unclear how low algal biomass could promote high grazer richness via sampling effects. Nor is high grazer biomass likely to enhance eelgrass genotypic richness since most herbivores in our system do not consume eelgrass. Instead our results seem best explained by higher richness promoting more effective resource use as predicted by theory (Holt & Loreau 2002) and demonstrated in numerous experiments (Cardinale et al. 2012).
495
Our results have implications for coastal management, which has focused extensively on the threat posed by nutrient loading and associated algal blooms to seagrasses and other coastal
habitats (Cloern 2001; Burkholder et al. 2007). Surprisingly, we found little evidence that local fertilization increased epiphytic microalgae (Fig. 1b), and sites with higher nitrogen availability supported more grazing crustaceans but not more algae (Fig. 2b, 3c,d), despite wide variation in 500
nutrient status (Fig. S1). Thus, while sustained nutrient loading can clearly have detrimental impacts on submerged vegetation (Cloern 2001; Burkholder et al. 2007), both our experimental results and our cross-site comparisons bolster the growing consensus that food web perturbations can have comparable or even greater impacts on estuarine producer biomass compared with moderate nutrient increases (Heck & Valentine 2007; Eriksson et al. 2009; Baden et al. 2010; 505
Hughes et al. 2013).
To inform management effectively in an era of global change, ecology must move beyond demonstrating which processes occur to quantifying their importance and interactions under ambient conditions. Our comparative-experimental analysis shows that biodiversity is a strong predictor of fundamental ecosystem processes, including producer and consumer biomass 510
accumulation, in naturally complex field ecosystems on a global scale and is comparable in importance to large-scale gradients in temperature, salinity, and nutrients. Moreover, these processes appear related to biodiversity at both genetic and species levels. The qualitative
concordance of our results, and other recent large-scale observations (Frank et al. 2007; Paquette & Messier 2010; Mora et al. 2011; Maestre et al. 2012; Gamfeldt et al. 2013), with results of 515
small-scale experiments supports the emerging conclusion that biodiversity is a fundamental controller of how ecosystems work, and is of comparable quantitative importance to major environmental drivers of metabolism, organismal fitness, and ecosystem processes (Cardinale et
al. 2012; Hooper et al. 2012).
Acknowledgements
We thank the many staff, students, and volunteers who assisted with field and lab research; Jim Grace and Jarrett Byrnes for advice on structural equation modeling; Brad Cardinale and Jonathan Losos for comments that improved the MS; and the home institutions of all project partners, who provided invaluable in-kind support. Primary funding was provided by the 525
National Science Foundation (OCE-1031061 to J.E.D.).
References
1.Arnaud-Haond, S. & Khalid, B. (2007). GENCLONE: a computer program to analyse
genotypic data, test for clonality and describe spatial clonal organization. Mol Ecol Notes, 7, 15– 530
17.
2.Baden, S., Boström, C., Tobiasson, S., Arponen, H. & Moksnes, P.-O. (2010). Relative
importance of trophic interactions and nutrient enrichment in seagrass ecosystems: A broad-scale field experiment in the Baltic-Skagerrak area. Limnol Oceanogr, 55, 1435.
3.Best, R.J., Caulk, N.C. & Stachowicz, J.J. (2013). Trait vs. phylogenetic diversity as predictors 535
of competition and community composition in herbivorous marine amphipods. Ecol Letters, 16, 72–80.
4.Borer, E.T., Seabloom, E.W., Gruner, D.S., Harpole, W.S., Hillebrand, H., Lind, E.M., et al. (2014). Herbivores and nutrients control grassland plant diversity via light limitation. Nature, 508, 517–520.
540
5.Burkholder, J., Tomasko, D. & Touchette, B. (2007). Seagrasses and eutrophication. J Exp
Mar Biol Ecol, 350, 46–72.
Biodiversity loss and its impact on humanity. Nature, 486, 59–67.
7.Cardinale, B.J., Matulich, K.L., Hooper, D.U., Byrnes, J.E., Duffy, E., Gamfeldt, L., et al. 545
(2011). The functional role of producer diversity in ecosystems. Amer J Bot, 98, 572–592. 8.Chao, A. & Jost, L. (2012). Coverage-based rarefaction and extrapolation: standardizing samples by completeness rather than size. Ecology, 93, 2533–2547.
9.Cloern, J. (2001). Our evolving conceptual model of the coastal eutrophication problem. Mar
Ecol Prog Ser, 210, 223–253.
550
10.Duffy, J.E., Cardinale, B.J., France, K.E., McIntyre, P.B., Thébault, E. & Loreau, M. (2007). The functional role of biodiversity in ecosystems: incorporating trophic complexity. Ecol Letters, 10, 522–538.
11.Duffy, J.E., Moksnes, P.-O. & Hughes, A.R. (2013). Ecology of Seagrass Communities. In:
Marine Community Ecology and Conservation (eds. Bertness, M.D., Bruno, J.F., Silliman, B.R.
555
& Stachowicz, J.J.). Sinauer Associates, Sunderland, Massachusetts, pp. 271–297.
12.Duffy, J.E., Richardson, J.P. & Canuel, E.A. (2003). Grazer diversity effects on ecosystem functioning in seagrass beds. Ecol Letters, 6, 637–645.
13.Edgar, G.J. (1990). The use of the size structure of benthic macrofaunal communities to estimate faunal biomass and secondary production. J Exp Mar Biol Ecol, 137, 195–214. 560
14.Eriksson, B.K., Ljunggren, L. M. A.S., Johansson, G., Mattila, J., Rubach, A., et al. (2009). Declines in predatory fish promote bloom-forming macroalgae. Ecol Appl, 19, 1975–1988. 15.Frank, K., Petrie, B. & Shackell, N. (2007). The ups and downs of trophic control in continental shelf ecosystems. Trends Ecol Evol, 22, 236–242.
16.Gamfeldt, L., Snäll, T., Bagchi, R., Jonsson, M., Gustafsson, L., Kjellander, P., et al. (2013). 565
Communications, 4, 1340.
17.Grace, J.B. (2006). Structural Equation Modeling and Natural Systems. Cambridge University Press.
18.Gruner, D.S., Smith, J.E., Seabloom, E.W., Sandin, S.A., Ngai, J.T., Hillebrand, H., et al. 570
(2008). A cross-system synthesis of consumer and nutrient resource control on producer biomass.
Ecol Letters, 11, 740–755.
19.Heck, K.L. & Valentine, J.F. (2007). The primacy of top-down effects in shallow benthic ecosystems. Est Coasts, 30, 371–381.
20.Holt, R.D. & Loreau, M. (2002). Biodiversity and ecosystem functioning: The role of trophic 575
interactions and the importance of system openness. In: The functional consequences of
biodiversity (eds. Kinzig, A.P., Pacala, S.W. & Tilman, D.). Princeton University Press,
Princeton, pp. 246–262.
21.Hooper, D.U., Adair, E.C., Cardinale, B.J., Byrnes, J.E.K., Hungate, B.A., Matulich, K.L., et
al. (2012). A global synthesis reveals biodiversity loss as a major driver of ecosystem change.
580
Nature, 486, 105–108.
22.Hughes, A.R. & Stachowicz, J.J. (2004). Genetic diversity enhances the resistance of a seagrass ecosystem to disturbance. Proc Natl Acad Sci USA, 101, 8998–9002.
23.Hughes, A.R., Bando, K.J., Rodriguez, L.F. & Williams, S.L. (2004). Relative effects of grazers and nutrients on seagrasses: a meta-analysis approach. Mar Ecol Prog Ser, 282, 87–99. 585
24.Hughes, B.B., Eby, R., Van Dyke, E., Tinker, M.T., Marks, C.I., Johnson, K.S., et al. (2013). Recovery of a top predator mediates negative eutrophic effects on seagrass. Proc Natl Acad Sci
USA, 110, 15313–15318.
roles of bottom-up and top-down forces in natural communities. Ecology, 73, 723–732. 590
26.Lefcheck, J.S. & Duffy, J.E. (2014). Multitrophic functional diversity predicts ecosystem functioning in experimental assemblages of estuarine consumers. PeerJ.
27.Maestre, F.T., Quero, J.L., Gotelli, N.J., Escudero, A., Ochoa, V., Delgado-Baquerizo, M., et
al. (2012). Plant Species Richness and Ecosystem Multifunctionality in Global Drylands. Science,
335, 214–218. 595
28.Mattson, W.J., Jr. (1980). Herbivory in relation to plant nitrogen content. Annu Rev Ecol Syst, 119–161.
29.Moksnes, P.O., Gullström, M., Tryman, K. & Baden, S. (2008). Trophic cascades in a temperate seagrass community. Oikos, 117, 763–777.
30.Moore, K. & Short, F. (2006). Zostera: biology, ecology, and management. Seagrasses: 600
biology, ecology and conservation. Springer, Dordrecht. pp. 361–386.
31.Mora, C., Aburto-Oropeza, O., Bocos, A.A., Ayotte, P.M., Banks, S., Bauman, A.G., et al. (2011). Global human footprint on the linkage between biodiversity and ecosystem functioning in reef fishes. PLoS Biol, 9, e1000606.
32.Nakagawa, S. & Schielzeth, H. (2013). A general and simple method for obtaining R2 from 605
generalized linear mixed‐effects models. Methods Ecol Evol, 4, 133–142.
33.O'Connor, M.I. (2009). Warming strengthens an herbivore-plant interaction. Ecology, 90, 388–398.
34.Oksanen, L. & Oksanen, T. (2000). The logic and realism of the hypothesis of exploitation ecosystems. Am Nat, 155, 703–723.
610
35.Olsen, J.L., Coyer, J.A., Stam, W.T., Moy, F.E., Christie, H. & Jørgensen, N.M. (2013). Eelgrass Zostera marina populations in northern Norwegian fjords are genetically isolated and
diverse. Mar Ecol Prog Ser, 486, 121–132.
36.Paquette, A. & Messier, C. (2010). The effect of biodiversity on tree productivity: from temperate to boreal forests. Global Ecol Biogeography, 20, 170–180.
615
37.Polis, G. & Strong, D. (1996). Food Web Complexity and Community Dynamics. Am Nat, 147, 813–846.
38.Poore, A.G.B., Campbell, A.H. & Steinberg, P.D. (2009). Natural densities of mesograzers fail to limit growth of macroalgae or their epiphytes in a temperate algal bed. J Ecology, 97, 164–175.
620
39.Reusch, T.B. (2000). Five microsatellite loci in eelgrass Zostera marina and a test of cross-species amplification in Z. noltii and Z. japonica. Mol Ecol, 9, 371–373.
40.Reusch, T.B., Stam, W.T. & Olsen, J.L. (1999). Microsatellite loci in eelgrass Zostera marina reveal marked polymorphism within and among populations. Mol Ecol, 8, 317–321.
41.Reusch, T.B.H., Ehlers, A., Hämmerli, A. & Worm, B. (2005). Ecosystem recovery after 625
climatic extremes enhanced by genotypic diversity. Proc Natl Acad Sci USA, 102, 2826–2831. 42.Reynolds, P.L., Paul Richardson, J. & Emmett Duffy, J. (2014). Field experimental evidence that grazers mediate transition between microalgal and seagrass dominance. Limnol Oceanogr, 59, 1053–1064.
43.Shipley, B. (2009). Confirmatory path analysis in a generalized multilevel context. Ecology, 630
90, 363–368.
44.Shipley, B. (2013). The AIC model selection method applied to path analytic models compared using a d-separation test. Ecology, 94, 560–564.
45.Spivak, A.C., Canuel, E.A., Duffy, J.E. & Richardson, J.P. (2009). Nutrient enrichment and food web composition affect ecosystem metabolism in an experimental seagrass habitat. PLoS 635
ONE, 4, e7473.
46.Srivastava, D.S. & Vellend, M. (2005). Biodiversity-ecosystem function research: is it relevant to conservation? Annu Rev Ecol Evol Syst., 36, 267–294.
47.Strong, D.R. (1992). Are trophic cascades all wet? Differentiation and donor-control in speciose ecosystems. Ecology, 73, 747–754.
640
48.Tomas, F., Abbott, J.M., Balk, M., Steinberg, C., Williams, S.L. & Stachowicz, J.J. (2011). Plant genotype and nitrogen loading influence seagrass productivity, biochemistry, and plant-herbivore interactions. Ecology, 92, 1807–1817.
49.Valentine, J. & Duffy, J. (2006). The central role of grazing in seagrass ecology. Seagrasses:
Biology, ecology, and conservation. Springer, 463–501.
645
50.Whalen, M.A., Duffy, J.E. & Grace, J.B. (2013). Temporal shifts in top-down versus bottom-up control of epiphytic algae in a seagrass ecosystem. Ecology, 94, 510–520.
Figure 1. Effects of experimental fertilization, grazer reduction, and their interactions with environment and biodiversity across the range of eelgrass. (a) Map of the 15 Zostera
Experimental Network sites, with blue and green site codes (Table S1) identifying Atlantic (plus Baltic) and Pacific sites, respectively. (b) Mean (+ s.e.m.) effects of grazer deterrent and
fertilization on log biomasses of crustacean and gastropod grazers and epiphytic microalgae, estimated as partial regression coefficients from the full path model (1). (c) Influence of cross-site variation in temperature and grazer richness on grazing impact (Deterrent effect), estimated from interaction terms in SEM models 11 and 13 (Tables 1, S2b, Figure S3).
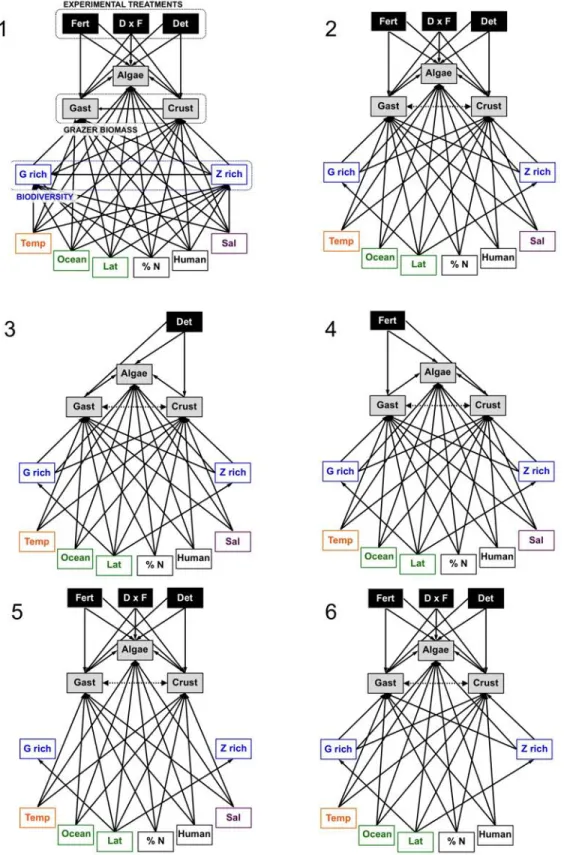
Figure 2. Path analysis of combined experimental and regional controls on grazer and algal biomass across the range of eelgrass. (a) Schematic representation of variables included in the model: those measured at site and plot levels are shown in in lower white and upper gray sections of panel, respectively. Experimental treatments are black.
Biomasses of crustacean (Crust) and gastropod (Gast) grazers and algae were modeled as a function of temperature (Temp), salinity, site nutrient status (% N), latitude, ocean (Atlantic vs. Pacific), and richness of grazer species and eelgrass genotypes. (b) Best model 10 (AIC weight = 0.61, Table 1). Thickness of black (positive) and red (negative) paths is proportional to range-standardized path coefficient. Marginal R2 values are shown for endogenous variables. The double-headed, dashed arrow represents a correlated error rather than a hypothesized directed causal path.
5
Figure 3. Predictors of algal and grazer biomass in global comparisons (this study) and prior plot- or mesocosm-scale experiments. (a-d) Partial correlations from the best SEM (model 10, Fig. 2b, Table S2), i.e. influence of a predictor when other variables (“others”) are controlled statistically. Gray symbols denote values (model residuals) for individual plots, larger symbols are site means. (e-h) Results of prior experiments. Values are standardized (see Methods) and bars show mean values across the studies summarized in Table S3 (L=low, H=high, A=ambient, F=fertilized).
Table 1. Candidate structural equation models (see Figure S3 for structures). Fit was determined using D-separation tests. Models were compared via the Akaike Information Criterion (AIC), estimated from D-separation tests (Shipley 2013). Delta AIC is the difference in AIC score relative to the model with the lowest value (most parsimonious model) and AIC Weight (Wt) is the relative support for the model. Models in bold had AIC Weight > 0.10 (see Materials and Methods for details).
10
15
20
25
Table S2a. Parameter estimates (β) from the best-supported structural equation model (model 10, Figure 2b). Double-headed arrows indicate correlated errors, rather than directed paths, and are shown in the column for unstandardized estimate.
Table S2b. Parameter estimates for paths in models 9, 11, and 13 (Figure S3). Coefficients for other paths in these models are are identical to corresponding paths in model 10.
35
Table S3. Summary of results from prior experiments manipulating diversity or nutrient loading in eelgrass systems shown in Figure 3.
Table S3 (continued). References Cited: 40
Baden, S., C. Boström, S. Tobiasson, H. Arponen, and P.-O. Moksnes. 2010. Relative
importance of trophic interactions and nutrient enrichment in seagrass ecosystems: A broad-scale field experiment in the Baltic-Skagerrak area. LIMNOLOGY AND OCEANOGRAPHY
55:1435. 45
Blake, R. E., and J. E. Duffy. 2010. Grazer diversity affects resistance to multiple stressors in an experimental seagrass ecosystem. Oikos 119:1625–1635.
Blake, R. E., and J. E. Duffy. 2012. Changes in biodiversity and environmental stressors influence community structure of an experimental eelgrass Zostera marina system. Marine 50
Ecology Progress Series 470:41–54.
Duffy, J. E., K. S. Macdonald, J. M. Rhode, and J. D. Parker. 2001. Grazer diversity, functional redundancy, and productivity in seagrass beds: an experimental test. Ecology 82:2417–2434. 55
Duffy, J. E., J. P. Richardson, and E. A. Canuel. 2003. Grazer diversity effects on ecosystem functioning in seagrass beds. Ecology Letters 6:637–645.
Duffy, J. E., J. P. Richardson, and K. France. 2005. Ecosystem consequences of diversity depend on food chain length in estuarine vegetation. Ecology Letters 8:301–309.
60
Eklöf, J. S., C. Alsterberg, J. N. Havenhand, K. Sundbäck, H. L. Wood, and L. Gamfeldt. 2012. Experimental climate change weakens the insurance effect of biodiversity. Ecology Letters 15:864–872.
65
France, K. E., and J. E. Duffy. 2006a. Consumer diversity mediates invasion dynamics at multiple trophic levels. Oikos 113:515–529.
France, K. E., and J. E. Duffy. 2006b. Diversity and dispersal interactively affect predictability of ecosystem function. Nature 441:1139–1143.
70
Hughes, A. R., and J. J. Stachowicz. 2004. Genetic diversity enhances the resistance of a seagrass ecosystem to disturbance. Proceedings of the National Academy of Sciences of the United States of America 101:8998–9002.
75
Moksnes, P. O., M. Gullström, K. Tryman, and S. Baden. 2008. Trophic cascades in a temperate seagrass community. Oikos 117:763–777.
Reusch, T. B. H., A. Ehlers, A. Hämmerli, and B. Worm. 2005. Ecosystem recovery after climatic extremes enhanced by genotypic diversity. Proceedings of the National Academy of 80
Reynolds, P. L., J. Paul Richardson, and J. Emmett Duffy. 2014. Field experimental evidence that grazers mediate transition between microalgal and seagrass dominance. LIMNOLOGY AND OCEANOGRAPHY 59:1053–1064.
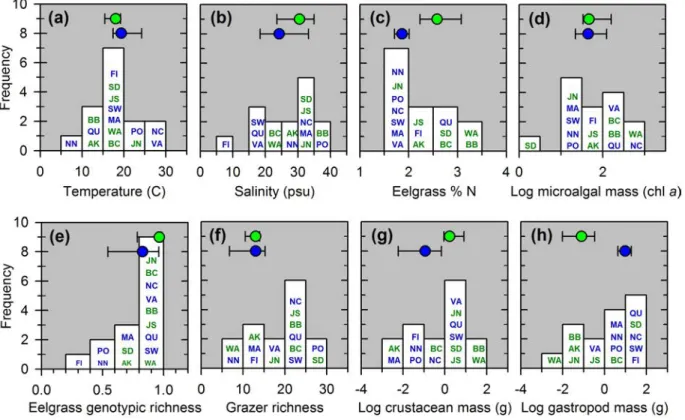
Figure S1. Variation among sites in environmental and biological parameters. Histograms show the frequency of values across sites for each variable, with two-letter codes within histograms referring to sites listed in Table S1. Symbols at top of each panel show the median and
interquartile range of values for Atlantic (blue) and Pacific (green) sites. Eelgrass %N, epiphytic algal (microalgal) biomass, and biomasses of crustacean and gastropod grazers are ambient values, i.e., means of samples from unmanipulated (control) plots at each site. Richness of eelgrass genotypes and grazer species represent site-level values and are summed across all plots at a site.
Figure S2. Effects of experimental grazer reduction (Deterrent), fertilization, and their interaction on biomass of grazers and epiphytic algae, and eelgrass leaf %N, at individual sites. Symbols show mean (+ 1 s.e.m.) effects on biomasses of (a-c) crustacean grazers, (d-f) gastropod grazers, and (g-i) epiphytic microalgae (as chl a), and of (j-l) eelgrass leaf % N as coefficients from the linear models. Site codes and symbols as in Fig. 1. * P < 0.05 in 2-factor ANOVA estimated for that site.
Figure S3 (part 1). Candidate structural equation models compared using AIC. See Materials and Methods for descriptions of models and Table 1 for model fits and AIC values.
90
Figure S3 (part 2). Candidate structural equation models compared using AIC. See Materials and Methods for descriptions of models and Table 1 for model fits and AIC values.
95
Figure S3 (part 3). Candidate structural equation models compared using AIC. See Materials and Methods for descriptions of models and Table 1 for model fits and AIC values.