Contrasting impacts of two weed species on
lowbush blueberry fertilizer nitrogen uptake
in a commercial field
Charles Marty1, Jose´e-Anne Le´vesque1, Robert L. Bradley2, Jean Lafond3, Maxime C. Pare´ID1*
1 Laboratoire d’e´cologie ve´ge´tale et animale, De´partement des sciences fondamentales, Universite´ du Que´ becàChicoutimi, Saguenay, QC, Canada, 2 De´ partement de biologie, Universite´ de Sherbrooke, Sherbrooke, QC, Canada, 3 Agriculture and Agri-Food Canada, Soils and Crops Research and Development Centre, Normandin, QC, Canada
*Maxime_Pare@uqac.ca
Abstract
Numerous studies have speculated that lowbush blueberry (Vaccinium angustifolium) is less efficient than weed species at taking up inorganic nitrogen (N) derived from fertilizers, thus raising questions as to the effectiveness of N fertilization in commercial fields. How-ever, competition for acquiring N as well as specific interactions between blueberry and companion weeds characterized by contrasted functional traits remain poorly documented. Here, we assessed fertilizer-derived N acquisition efficiency and biomass production in low-bush blueberry and two common weed species that have different functional traits—sweet fern (Comptonia peregrina), a N2-fixing shrub, and poverty oat grass (Danthonia spicata), a
perennial grass—in a commercial blueberry field in Que´bec, Canada. In 2015,15N-labelled ammonium sulfate was applied at a rate of 45 kg ha-1to 1 m2field plots containing lowbush blueberry and one of the two weeds present at several different density levels (0 to 25 plants m-2). In 2016, each plot was harvested to determine vegetative biomass and the percentage of fertilizer-derived N recovered (PFNR) in each species. The PFNR was higher in blueberry (24.4±9.3%) than in sweet fern (13.4±2.6%) and poverty oat grass (3.3±2.9%). However, lowbush blueberry required about four times more root biomass than sweet fern and poverty oat grass to uptake an equivalent amount of N from ammonium sulfate. The PFNR in pov-erty oat grass increased with plant density (from 0.8% to 6.4% at 2–3 and>6 plants m-2, respectively), which resulted in a decrease in blueberry’s PFNR (from 26.0±1.4% to 8.6± 1.8%) and aboveground vegetative biomass production (from 152±58 to 80±28 g m-2). The increase in biomass production and N content in sweet fern with increasing plant den-sity was not accompanied by an increase in PFNR (29.7±8.4%), suggesting an increasing contribution of atmospherically-derived N. This mechanism (i.e., N sparing) likely explained blueberry’s higher biomass production and N concentration in association with sweet fern than with poverty oat grass. Overall, our study confirms lowbush blueberry low efficiency (on a mass basis) at taking up N derived from the fertilizer as compared to weeds and reveals contrasted and complex interactions between blueberry and both weed species. Our results also suggest that the use of herbicides may not be necessary when poverty oat grass is
a1111111111 a1111111111 a1111111111 a1111111111 a1111111111 OPEN ACCESS
Citation: Marty C, Le´vesque J-A, Bradley RL,
Lafond J, Pare´ MC (2019) Contrasting impacts of two weed species on lowbush blueberry fertilizer nitrogen uptake in a commercial field. PLoS ONE 14(4): e0215253.https://doi.org/10.1371/journal. pone.0215253
Editor: Sergio Saia, Consiglio per la Ricerca e la
Sperimentazione in Agricoltura, ITALY
Received: January 24, 2019 Accepted: March 28, 2019 Published: April 12, 2019
Copyright:© 2019 Marty et al. This is an open access article distributed under the terms of the Creative Commons Attribution License, which permits unrestricted use, distribution, and reproduction in any medium, provided the original author and source are credited.
Data Availability Statement: All relevant data are
within the manuscript and its Supporting Information files.
Funding: M.P. and R.L.B. received funding from
Fonds de recherche axe´ sur l’agriculture nordique (FRAN-02), the Fonds de recherche du Que´bec – Nature et technologies (FRQNT), and the Fonds de de´veloppement de l’Universite´ du Que´becà Chicoutimi (FUQAC). The funders had no role in study design, data collection and analysis, decision to publish, or preparation of the manuscript.
present at a low density (<15 plants of poverty oat grass m-2) and that adding inorganic N fertilizer is counterproductive when this species is present at a high density as it takes up as much fertilizer as lowbush blueberry.
Introduction
Lowbush blueberry (Vaccinium angustifolium) is an ericaceous shrub native to eastern North
America that grows on disturbed sites [1,2]. It is an economically significant crop in Que´bec,
Canada’s Maritimes Provinces and Maine [3], where it is managed for its fruits from naturally
occurring plant populations [4]. Commercial lowbush blueberry fields are often developed on
forest clear cuts where plants regrow from their large rhizomatic network and clones can
spread naturally [2,5,6]. Lowbush blueberry fruits are produced generally through a 2-year
crop cycle; the shrubs are pruned to near ground level in the first year (vegetative year) to
stim-ulate new shoot production, and the plants bloom and produce fruits in the second year [6,7].
Lowbush blueberry lives in symbiosis with ericoid mycorrhizal fungi, which gives the plant
access to otherwise inaccessible nutrients, especially from recalcitrant soil organic matter [8–
10]. Although lowbush blueberry is well adapted to low nutrient availability and has low N
requirements, repeated use of inorganic or organic fertilizers has been shown to increase leaf
nutrient concentrations and growth [7,11–14] as well as fruit yields [11,14–16]. Weed control
is, however, often necessary for fertilizers to be efficient [4,6,11,13,17,18].
The weed flora in lowbush blueberry stands consists of a broad range of native herbaceous and woody perennial species, the specific taxa varying with soil type, moisture and fire history
[6]. The Polygonaceae sheep sorrel (Rumex acetosella L.), the Myricaceae sweet fern
(Compto-nia perigrina L.), the Poaceae poverty oat grass (Dantho(Compto-nia spicata L. P. Beauv. Ex Roem. &
Schult.) and the Ericaceous species sheep laurel (Kalmia angustifolia L.), Canada
rhododen-dron (Rhododendron canadense L.) and Labrador tea (Ledum groenlandicum Oeder) are
among the most common weed species found in commercial blueberry fields of Que´bec and
other Canadian provinces [6,19–21]. Although several studies have shown the detrimental
effect of weeds on blueberry’s fertilizer uptake and yield [6,11,22], the specific interactions
between lowbush blueberry, weed species and weed density have not been investigated in detail. However, it is likely that the specific functional traits and morphology of weed taxa con-trol these interactions and, therefore, lowbush blueberry’s growth and fruit production. The
presence of N2-fixing species often increases N availability for companion species both in
culti-vated [23–27] and natural ecosystems [28–30] due to direct or indirect N transfers from the
N-fixing to the companion species [29] or due to “N sparing” [28], i.e. lower competition of
N-fixing species for soil inorganic N by their ability to acquire N from the atmosphere. Therefore, it is likely that the interaction of blueberry with sweet fern, an actinorhizal N-fixing shrub
(0.3–1.5 m in height) with a deep root system [31–33] is different than its interaction with
pov-erty oat grass, a grass having a dense and superficial root system [34]. Sweet fern, like several
Myricacea species, develops cluster roots, allowing this species to colonize sterile soils, such as
abandoned fields and pine barrens [33]. These traits, combined with its ability to acquire N
from the atmosphere through its symbiotic association with the actinobacteriumFrankia,
increase its fitness in habitats marked by low nutrient availability and a short growing period, such those found in the boreal zone, and make it one of the most serious weed problems in
Canada’s commercial lowbush blueberry fields [33]. The development of cluster roots by this
species also provides the plant the ability to access scarce and non-labile essential nutrients Competing interests: The authors have declared
such as inorganic P [33,35]. Therefore, while sweet fern may not be a strong competitor for N fertilizer, it may impact lowbush blueberry growth by competing for other resources such as P,
that can be a limiting factor for blueberry’s growth and yields [36]. In contrast, N fertilization
in stands marked by a high density of poverty oat grass—a species native to North America
[37] and often dominant grass in pastures of southern Que´bec and the Maritime provinces
[34]—may be counterproductive. This species has a dense, fibrous and superficial root system
that may allow it to capture most N applied to the soil surface. Fertilization may thus increase weed growth rather than favouring a greater lowbush blueberry yield. Such a detrimental effect of fertilization has been observed in southern Estonia lowbush blueberry fields, where liming
increased soil pH and resulted in increased weed density and decreased blueberry growth [38].
Due to the economic significance of lowbush blueberry in northeastern North America and the potential growth of this market in several countries, it is important to better understand the N requirements of lowbush blueberry and how this plant interacts with neighbouring spe-cies, so as to adapt fertilization and cultural practices.
In this study, we investigated how lowbush blueberry grows and competes for acquiring N fertilizer in mixtures with sweet fern or poverty oat grass in a commercial blueberry field in the Lac-Saint-Jean region, Que´bec, Canada. Experimental plots were delimited within a com-mercial lowbush blueberry stand as a function of the presence/absence and density of sweet fern and poverty oat grass. In particular, we assessed i) the proportion of the fertilizer recov-ered in lowbush blueberry versus weed species, ii) the impact of weed density on blueberry’s acquisition of fertilizer N and biomass production, and iii) the weed species having the most detrimental effect on blueberry’s acquisition of N and biomass production. We hypothesized that lowbush blueberry would be a poor competitor for fertilizer compared to the two studied weed species and that increasing weed density would decrease lowbush blueberry fertilizer-derived N uptake and biomass production as a result of competition for N and other resources. We also hypothesized that poverty oat grass would compete more strongly with lowbush blue-berry for acquiring N from the fertilizer than sweet fern due to the superficial root system of poverty oat grass and sweet fern’s ability to acquire N from the atmosphere.
Material and methods
Study site
We conducted this experiment in a commercial lowbush blueberry field in Saint-Eugène d’Argentenay in the Saguenay–Lac-Saint-Jean (SLSJ) region, Que´bec, Canada (48˚59’N, 72˚ 18’W; 163m a.s.l.). The Saint-Eugène d’Argentenay’s Coop (i.e., producers’ association) granted us full permission to conduct this research work on their land. The SLSJ region
con-tains 82% of Que´bec’s commercial lowbush blueberry surface area [3]. Soils in the lowbush
blueberry stands are podzols, characterized by fine sand originating from fluvioglacial deposits
and low water retention capacity; they are thus non-fertile [39]. Soil pH in the study field is
moderately acidic (pH of ~5) but characterized by high Al concentrations and low CEC (~17 meq/100g) and base saturation (~5%). The organic matter content in the mineral horizons
was ~4% (SeeS1 Tablefor details). The region is characterized by a cold and humid climate
with a mean annual air temperature of 0.8˚C. Mean precipitation and air temperature during the growing season (May to August) average 989 mm and 14˚C, respectively. The lowbush blueberry stand was established in 2005 and is currently run over a 2-year cycle. The lowbush blueberry plants are pruned in the fall or in early spring, which results in the vegetative growth and in the development of flower buds the following growing season. This vegetative year is followed by the fruit production year. After fruit harvesting, the stand is mown again either at the end of fall or early in the following spring to start a new production cycle.
Experimental design
The commercial field was scrutinized during the autumn of 2014 to identify areas colonized
either by sweet fern or poverty oat grass. Initial weed density (number of plants m-2) was
esti-mated visually, and 1× 1 m plots were established in areas defined by four levels of plant
den-sity (D1–D4) for each weed (Table 1). A narrow trench was dug (~40 cm deep) around each
experimental plot and filled with two layers of polyethylene tarpaulin to isolate root systems
and to retain the maximum amount of15N within the plots. The vegetation was then mowed
~0.5 cm above the soil level, according to standard management. Each of the four weed density plots were replicated three times (three blocks), resulting in a total number of 24 plots (2 weed
species× 4 density levels × 3 replicates = 24 plots).
In early spring of 2015, the equivalent of 45 kg N ha-1(i.e., the recommended N fertilization
rate in the region) was added to each plot by pulverizing 2 L of a solution containing 22.5 g of
dissolved15N-enriched ammonium sulfate salt [(NH4)2SO4; 21% N; 5%15N]. No pesticide was
used during the study period. Sweet fern and poverty oat grass were the only weed species present in the experimental plots.
Sampling and analyses
In August 2016, the vegetative biomass of the two weed species (sweet fern and poverty oat grass) and lowbush blueberry was harvested from each plot (~0.5 cm above the soil level) and
taken to the lab. Belowground biomass was collected from within a 50× 50 cm frame that was
placed at the center of each plot. A fine trench was dug around the frame to a depth of ~15–20 cm. A wood board was thrust with a hammer ~15–20 cm beneath the surface to collect the
entire rhizosphere within the 50 x 50 cm plot. The 50× 50 × 15–20 cm samples were then
wrapped with plastic sheets and taken to the lab. Belowground biomass was sorted among spe-cies and rinsed with demineralized water. The aboveground and belowground biomass of each plot was then dried at 60˚C for 72 h, weighed and then ground using a cutting mill (Pulveri-sette 19, Fritsch, Idar-Oberstein, Germany). One subsample (~10 g DW) per plot was ran-domly taken from this roughly ground plant biomass sample and ground to a finer powder with a ball mill (Mixer Mill MM 200, Retsch, Haan, Germany). About 6 mg of this fine powder was then wrapped in tin capsules and sent to the Centre de recherche en ge´ochimie et
ge´ody-namique (GEOTOP; UQÀM, Que´bec, Montre´al) for total N and15N analyses. Total N was
measured with an automatic elemental analyzer in continuous flow mode (Vario Micro Cube, Elementar, Germany). N isotopic ratios were measured using an elemental analyzer in contin-uous flow mode, coupled to an isotope ratio mass spectrometer (IRMS; Micromass Isoprime
Isoprime 100, Cheadle, UK). Values ofδ15N are expressed in ‰ versus air (± 0.2‰ at 1σ). Raw
values were corrected with a calibration line obtained from two reference materials: urea and
dogfish tissue (δ15
N = -0.22‰ and +14.36‰, respectively). Internal reference materials were
normalized to IAEA-N1, N-2, and N-3 scales forδ15
N. A third internal reference material was
used to verify the precision of the calibration (leucineδ15N = -0.06‰). For each species, the
Table 1. Sweet fern and poverty oat grass density (plants m-2) of the four levels of weed density (D1-D4). Weed density level Sweet fern
(plants m-2)
Poverty oat grass (plants m-2) D1 0–1 0–1 D2 2–3 5–10 D3 4–5 15–20 D4 6+ 25+ https://doi.org/10.1371/journal.pone.0215253.t001
amount of15N (ABM; g) in excess in plant biomass was calculated as follows:
ABM¼N � m � e Eq 1
whereN and m are plant N concentration (g N g-1) and dry mass (g), respectively, ande the
15
N atom percent excess in plant biomass relative to the standard (atmosphere).
The percentage of fertilizer-derived N recovered (PFNR) was then calculated for each spe-cies as follows:
PFNR ¼ ABM
AFertilizer
� 100 Eq 2
where AFertilizeris the amount of15N applied as (15NH4)2SO4to each plot. The acquisition of
15
N by plants was also normalized as a function of root biomass (RBM;μg15N g-1root) to
esti-mate fertilizer uptake efficiency (FUeff):
FUeff ¼
ABM
RBM
Eq 3
Statistical analyses
Mixed model analyses were performed on i) lowbush blueberry’s PFNR and biomass with weed species (two levels) and weed density (four levels) as fixed effects and blocks (three
blocks) as the random effect; and ii)FUeffwith species as fixed effects and blocks as the random
effect. Analyses were performed in R (R Development Core Team, 2013) with thelmerTest
package, which uses the Satterthwaite’s degrees of freedom method [40]. The package
emmeans, which is an updated version of the lsmeans package [41] was used to estimate
mar-ginal means and to conduct a post-hoc pairwise comparisons of least-square means among factors’ levels (Tukey’s method). Linear regression and analyses of covariance (ANCOVA) were performed between both aboveground vegetative biomass production and belowground biomass, and PFNR across species.
Results
Blueberry aboveground vegetative biomass production and belowground
biomass
There was a significant effect of weed species and an interaction between weed density and weed species on lowbush blueberry aboveground vegetative biomass (i.e., stems + leaves)
pro-duction (Table 2). On average, lowbush blueberry aboveground vegetative biomass was 30%
lower in plots with poverty oat grass (123± 30 g m-2) than in plots with sweet fern (178± 33 g
m-2). In association with poverty oat grass (Fig 1A), lowbush blueberry aboveground vegetative
biomass production tended to be lower at higher weed densities rather than at lower densities,
whereas it tended to increase with sweet fern density (Fig 1B).
There was also a significant effect of weed species and an interaction between weed density
and weed species on lowbush blueberry belowground biomass (Table 2). Blueberry
below-ground biomass was 35% lower in plots having poverty oat grass (1371± 600 g m-2) than in
those having sweet fern (2101± 251 g m-2), especially in D4 plots (Fig 1C and 1D).
The aboveground vegetative biomass/belowground biomass ratio did not vary significantly
among density levels and weed species. It averaged 0.11± 0.06 g g-1in poverty oat grass and
Weed above and belowground biomass
Aboveground biomass production of sweet fern was about five times higher (321± 132 g m-2)
than that of poverty oat grass (64± 61 g m-2
). Although the biomass tended to increase with
weed density (Fig 1Eto1F), the effect of the weed density level was not significant (Table 2).
Belowground biomass was also much higher in sweet fern than in poverty oat grass
(306± 198 g m-2vs. 79± 95 g m-2;Fig 1G and 1H), but belowground biomass varied strongly
among density levels (Table 2). In both species, belowground biomass increased with weed
density (Fig 1G and 1H).
The aboveground biomass production/belowground biomass ratio was on average 30%
higher in poverty oat grass than in sweet fern (2.0± 2.4 vs. 1.5 ± 1.2, respectively); however, it
strongly decreased with increasing density for both species: from 3.8± 3.7 in D2 plots to
1.3± 0.9 in D3 plots to 0.81 ± 0.5 in D4 plots for poverty oat grass and from 2.4 ± 1.9 in D2
plots to 1.7± 0.8 in D3 plots to 0.8 ± 0.2 in D4 plots for sweet fern.
N concentrations in aboveground and belowground biomass
Mean N concentration in aboveground vegetative biomass across all weed density levels was
lower in poverty oat grass (0.78± 0.12%) than in lowbush blueberry (1.15 ± 0.04%) and sweet
fern (1.22± 0.06%). Weed density had no effect on lowbush blueberry aboveground biomass
(stem + leaves) N concentrations (Table 3) but N concentrations were significantly lower in
plots with poverty oat grass than in those with sweet fern (Fig 2A) (1.02± 0.13% vs.
1.28± 0.23%).
Mean belowground biomass N concentration was higher in sweet fern (1.36± 0.45%) than
in poverty oat grass (0.59± 0.02%) and lowbush blueberry (0.30 ± 0.04%). Nitrogen
concentra-tion in lowbush blueberry belowground biomass was significantly lower in associaconcentra-tion with
poverty oat grass (0.26± 0.03) than in association with sweet fern (0.34 ± 0.12) (Table 3;Fig
2B).
Nitrogen concentration was higher in sweet fern than in poverty oat grass both in
above-ground and belowabove-ground biomass (Fig 2C and 2D). Weed density had no effect on weed
tis-sues N concentration (Table 3).
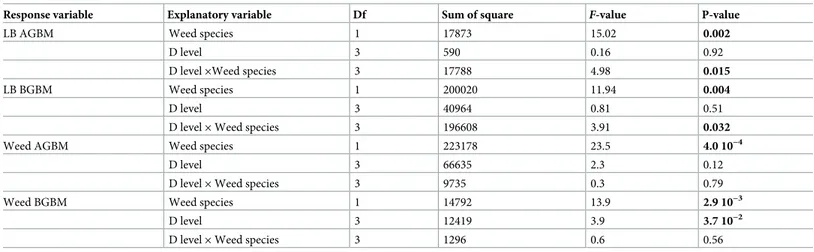
Table 2. Results of the mixed model analysis conducted on lowbush blueberry (LB) and weed aboveground biomass (AGBM) production (g m-2) and belowground
biomass (BGBM; g m-2).
Response variable Explanatory variable Df Sum of square F-value P-value
LB AGBM Weed species 1 17873 15.02 0.002
D level 3 590 0.16 0.92
D level×Weed species 3 17788 4.98 0.015
LB BGBM Weed species 1 200020 11.94 0.004
D level 3 40964 0.81 0.51
D level× Weed species 3 196608 3.91 0.032
Weed AGBM Weed species 1 223178 23.5 4.0 10−4
D level 3 66635 2.3 0.12
D level× Weed species 3 9735 0.3 0.79
Weed BGBM Weed species 1 14792 13.9 2.9 10−3
D level 3 12419 3.9 3.7 10−2
D level× Weed species 3 1296 0.6 0.56
Weed species and weed density level were used as fixed effects and blocks as random effect. The table shows the results of type III analyses of variance computed via Satterthwaite’s degree of freedom method. Significant effects (P<0.05) are shown in bold characters.
Percentage of fertilizer-derived N recovered (PFNR) in blueberry and
weeds
PFNR was much higher in lowbush blueberry (24.4± 9.3%) than in sweet fern (13.4 ± 5.9%)
and poverty oat grass (3.3± 3.1%). The PFNR in lowbush blueberry was similar in association
with either poverty oat grass or sweet fern at low weed density levels (D1 and D2), ranging
from 22.1% to 29.6% (Fig 3A). However, whereas the PFNR in lowbush blueberry did not
decrease with increasing sweet fern density, it decreased significantly with increasing density
of poverty oat grass (Fig 3A).
D1 D2 D3 D4 0 1 00 200 300 ab ab ab a LB A G VBM (g m − 2 ) a D1 D2 D3 D4 ab ab b b b D1 D2 D3 D4 0 1000 2 000 3000 ab ab ab a LB BGBM (g m − 2 ) w/ POG c D1 D2 D3 D4 ab ab ab b w/ SF d D1 D2 D3 D4 0 2 00 400 6 00 800 a a a W eed A G BM (g m − 2 ) e D1 D2 D3 D4 b b b f D1 D2 D3 D4 0 2 00 400 6 00 800 a a ab POG W eed BGBM (g m − 2 ) g D1 D2 D3 D4 ab ab b SF h
Fig 1. Aboveground vegetative biomass (AGVBM) production and belowground biomass (BGBM) (g m-2) in the three study plant species. (a–d) AGBVM and BGBM in lowbush blueberry (LB) in mixtures with poverty oat grass
(POG; dark grey bars) or sweet fern (SF; light grey bars). (e–h) AGBVM and BGBM in POG (dark grey bars) or SF (light grey bars) in mixtures with LB. Values are mean± SD (n = 3) and are shown for the four levels of weed density (D1-D4). Values not sharing the same letters are significantly different atP < 0.05.
The PFNR in sweet fern did not increase significantly with plant density, taking up between
11.6% and 16.4% of fertilizer-derived N across all density levels (Fig 3B). In contrast, the PFNR
in poverty oat grass did increase with density.
Fertilizer uptake efficiency in blueberry and weed species
Fertilizer uptake efficiencyFUeff, i.e. uptake of fertilizer-derived N per unit of root mass, was
about four times higher in both sweet fern (129.8± 81.8 mg N-fertilizer kg-1root) and poverty
oat grass (155.5± 149.9 mg N-fertilizer kg-1root) than in lowbush blueberry (33.3± 9.4 mg
N-fertilizer kg-1root) (Fig 4).
Relationship between PFNR and plant biomass
There was a positive correlation between aboveground biomass production and PFNR for
both lowbush blueberry and the weed species (Fig 5A); however, the slope of this relationship
was significantly higher for the weed species (13.8 and 16.5 g m-2PFNR-1), for sweet fern and
poverty oat grass, respectively) than for lowbush blueberry (4.0 g m-2PFNR-1). The intercept
was higher for sweet fern (156.2 g m-2) than for poverty oat grass (16.4 g m-2) and lowbush
blueberry (52.1 g m-2) (S1 Table). There was also a strong positive relationship between
below-ground biomass and PFNR for the three species (Fig 5B). There was a significant species effect
but no significant interaction between belowground biomass and PFNR (S2 Table), although
the slopes tended to be higher for the weed species (0.086 and 0.123 PFNR g m-2in sweet fern
and poverty oat grass, respectively) than for lowbush blueberry (0.036 PFNR g m-2).
Discussion
Fertilizer uptake by lowbush blueberry and weed species
Fifteen months after the application of15N-labelled fertilizer, a much larger proportion of15N
was recovered in lowbush blueberry than in both weed species. The strong and positive
rela-tionship between belowground biomass and PFNR for all species (Fig 5B) shows that this
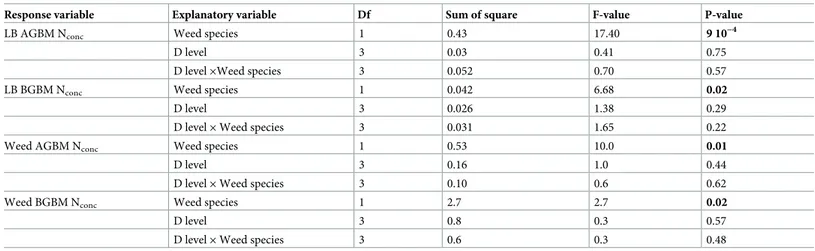
higher fertilizer acquisition resulted from a much higher belowground biomass in lowbush Table 3. Results of the mixed model analysis conducted on N concentration (%) in lowbush blueberry (LB) and weed aboveground (AGBM Nconc) and belowground
biomass (BGBM Nconc).
Response variable Explanatory variable Df Sum of square F-value P-value
LB AGBM Nconc Weed species 1 0.43 17.40 9 10−4
D level 3 0.03 0.41 0.75
D level×Weed species 3 0.052 0.70 0.57
LB BGBM Nconc Weed species 1 0.042 6.68 0.02
D level 3 0.026 1.38 0.29
D level× Weed species 3 0.031 1.65 0.22
Weed AGBM Nconc Weed species 1 0.53 10.0 0.01
D level 3 0.16 1.0 0.44
D level× Weed species 3 0.10 0.6 0.62
Weed BGBM Nconc Weed species 1 2.7 2.7 0.02
D level 3 0.8 0.3 0.57
D level× Weed species 3 0.6 0.3 0.48
Weed species and weed density level were used as fixed effects and blocks as the random effect. The table shows the results of type III analyses of variance computed via Satterthwaite’s degree of freedom method. Significant effects (P<0.05) are shown in bold characters.
blueberry than in the weed species. Lowbush blueberry also produced more aboveground bio-mass than both weed species, but this production was low relative to belowground biobio-mass. More than 10 g of belowground biomass was required to produce 1 g of aboveground biomass as compared with only 0.5 and 0.7 g for poverty oat grass and sweet fern, respectively. The lower slope coefficient of the linear regression between PFNR and aboveground biomass pro-duction in lowbush blueberry than for the weed species reflected a lower fertilizer-derived N
use efficiency for lowbush blueberry (Fig 5A). A greater amount of fertilizer was necessary to
produce a given amount of aboveground biomass in lowbush blueberry than in the weed spe-cies. The intercept of the regression line represents the theoretical aboveground biomass pro-duction in the absence of fertilizer-derived N. This parameter was much higher in sweet fern than in poverty oat grass and lowbush blueberry, suggesting that sweet fern has access to other sources of N to support its high aboveground biomass production. A major portion of this N likely came from atmospheric N-fixation since sweet fern has a symbiotic association with Frankia, a N-fixing actinobacterium; in addition, sweet fern’s deep and clustered root system may give this weed access to soil ammonium and nitrate present in the soil, albeit at very low
concentration [32,33]. In contrast, the very low intercept (close to zero) for poverty oat grass
suggests that this weed is much more dependent on the N fertilizer to support its growth.
w/ POG w/ SF LB A G VBM N conc (%) 0.0 0 .5 1.0 1 .5 2.0 2 .5 a b a POG SF W eed A G BM N conc (%) 0.0 0 .5 1.0 1 .5 2.0 2 .5 a b c w/ POG w/ SF LB BGBM N conc (%) 0.0 0 .5 1.0 1 .5 2.0 2 .5 a b b POG SF W eed BGBM N conc (%) 0.0 0 .5 1.0 1 .5 2.0 2 .5 a b d
Fig 2. Total N concentration (%) in aboveground biomass (AGBM) and belowground biomass (BGBM) in the three study species. (a) Total N (%) in lowbush blueberry (LB) in mixtures with poverty oat grass (POG). (b) Total N
(%) in LB in mixtures with sweet fern (SF). (c) Total N (%) in POG in mixtures with LB. (d) Total N (%) in SF in mixtures with LB. Values are mean± SD (n = 3). Values not sharing the same letters are significantly different at
P < 0.05.
These results agree with our hypotheses that i) the dense and superficial root system of poverty oat grass allows it to take up the fertilizer efficiently; and ii) sweet fern does not rely upon the fertilizer to support its N demand as much as poverty oat grass due to its ability to fix atmo-spheric N.
Although lowbush blueberry captured most of the added inorganic N, our results show that lowbush blueberry’s root system is inefficient in acquiring fertilizer-derived inorganic N rela-tive to that of both weed species, especially poverty oat grass. Fertilizer uptake efficiency, i.e. fertilizer uptake normalized with belowground biomass, was about four times lower in
low-bush blueberry than in both weed species (Fig 4). Thus, lowbush blueberry must invest four
times more resources and energy in its belowground biomass than the weed species to acquire equivalent amounts of inorganic N from fertilizer. This low nutrient absorption efficiency is
D1 D2 D3 D4
PNFR in LB (%)
0 1 02 03 04 05 06 0 a a a a a b a c a w/ Oatgrass w/ Sweet fern D1 D2 D3 D4PNFR in w
eeds (%)
0 5 10 15 20 25 30 b a c ab c b c Oatgrass Sweet fernweed density level
Fig 3. Proportion of fertilizer-derived N recovered (PFNR) in the three study species. (a) PFNR in lowbush
blueberry (LB) in mixtures with poverty oat grass (POG) or sweet fern (SF). (b) PFNR in POG and SF in mixtures with LB. Values are mean± SD (n = 3) and are shown for the four levels of weed density (D1-D4). Values not sharing the same letters are significantly different atP < 0.05.
common to most blueberry species and results from a low proportion of root hairs [42]. In addition, ericaceous species have low N requirements as they have evolved adaptations to sur-vive in habitats having low inorganic N availability and mineralization rates, especially cold
cli-mate species, such as lowbush blueberry [43]. Their use of nitrate is generally insignificant
because ericaceous species have small or null nitrate reductase activity in their leaves and roots
[44,45]. Ericaceous species rather support their N demand by taking up organic N molecules
through their ericoid mycorrhizal associations [9,44,46]. Although several studies have shown
that ammonium inputs increase lowbush blueberry growth and N status [7,11,12,14], our
results support the hypothesis of a lower N fertilizer uptake and use efficiency in lowbush blue-berry than in the two weed species. This low fertilization uptake ability of blueblue-berry species
generally results in low fertilizer recovery in15N-labelling experiments (~5–40% depending on
crop management, species and on the phenological stage the tracer is applied) [47,48]. A recent
study has shown that unadapted N fertilization (fertilization rate, timing and type) could lead to decreased yields, increased soil electrical conductivity and nitrate leaching in highbush
LB
POG
SF
FU
eff(mg N−f
e
rt
iliz
er kg
− 1root)
0
5
0
100
150
200
250
300
350
a
b
b
Fig 4. Fertilizer uptake efficiency (FUeff) (mg N kg-1root) of lowbush blueberry (LB), sweet fern (SF) and poverty
oat grass (POG). Values are mean± SD across weed density levels. Values not sharing the same letters are significantly different atP < 0.05.
blueberry fields [49]. Our results show that N fertilizer should also be used with caution, depending on local neighboring species and densities. Adding N fertilizer may be
0 10 20 30 40 0 100 200 300 400 500 600
PNFR (%)
A
GBM (g m
− 2)
a
0 100 200 300 400 500 600 700 0 102 03 04 0BGBM (g m
−2)
PNFR (%
)
b
LB SF POGFig 5. Relationships between the percentage of fertilizer-derived N recovered (PFNR) and aboveground biomass (AGBM; g m-2) and belowground biomass (BGBM; g m-2) in the three study plant species. (a) Relationship between
PFNR and AGBM; y = 52.12 + 4.02x (R2= 0.49;
P < 0.001) for LB; y = 156.2 + 13.77x (R2= 0.44;
P = 0.05) for SF;
y = 16.38 + 16.46x (R2= 0.74;P = 0.005) for POG. (b) Relationship between BGBM and PFNR; y = 8.72 + 0.036x (R2= 0.47;P < 0.001) for LB; y = 6.77 + 0.086x (R2= 0.58;
P < 0.05) for SF; y = 0.91 + 0.123x (R2= 0.87;
P < 0.001) for POG.
LB, SF and POG stand for lowbush blueberry, sweet fern and poverty oat grass, respectively. https://doi.org/10.1371/journal.pone.0215253.g005
counterproductive in situations where the lowbush blueberry root system is not well developed and where poverty oat grass is present at a high density. Our data show that adding N fertilizer
in areas where poverty oat grass density >10 plants m-2may indeed provide a greater benefit
to poverty oat grass and have a detrimental effect on lowbush blueberry growth. In contrast, N fertilization may not require systematic weed suppression in areas where poverty oat grass
density is low (<10 plants m-2) and where sweet fern is the sole weed species, as these
condi-tions did not impact lowbush blueberry’s fertilizer uptake.
Interactions between lowbush blueberry and the weed species
In agreement with our hypotheses, sweet fern and poverty oat grass interacted differently with lowbush blueberry. First, lowbush blueberry vegetative biomass was higher in the plots with
sweet fern than in those with poverty oat grass (Fig 1). Second, whereas both aboveground and
belowground biomass of lowbush blueberry tended to decrease with increasing poverty oat grass density, lowbush blueberry aboveground vegetative biomass production tended to increase with sweet fern density; this resulted in the significant interaction between weed
spe-cies and weed density (Table 2). A part of these opposite trends could be explained by the
higher lowbush blueberry belowground biomass in association with sweet fern than with pov-erty oat grass (there was a positive relationship between belowground biomass and
above-ground vegetative biomass production in lowbush blueberry:r = 0.55; P < 0.005), rather than
from a stimulation of lowbush blueberry aboveground vegetative biomass by sweet fern. Indeed, the production of aboveground vegetative biomass per unit root biomass was similar
across density levels and in both mixture types (0.11± 0.06 and 0.09 ± 0.02 in poverty oat grass
and sweet fern, respectively). This absence of change in the aboveground: belowground bio-mass ratio across the different treatments (weed species and weed density) contrasts with other studies reporting changes in biomass allocation in response to competition with other
species and resources limitations [50,51].
It is not clear why lowbush blueberry belowground biomass was higher in plots with sweet fern than in those with poverty oat grass. However, the fact that this trend was true even in
plots with very few or no weeds (i.e. 0–1 plant m-2in D1 plots) suggests that sweet fern may
have an indirect effect on lowbush blueberry root growth, by for instance changing soil phy-sico-chemical characteristics in the long-term (e.g., soil N concentration, soil structure). Yet, available soil data seem to indicate that soil is more nutrient-depleted in areas colonized by
sweet fern than in those colonized by poverty oat grass (S1 Table). More research is required
to clarify this point. It is also not clear why this biomass decreased with increased poverty oat
grass density, whereas no such trend was observed with sweet fern (Fig 1A and 1B). This
pat-tern may be a result of lower competition for root development in association with sweet fern than in association with poverty oat grass, or it may simply be due to sweet fern colonizing the field later when lowbush blueberry belowground biomass was already well developed. How-ever, sweet fern tends to colonize lowbush blueberry fields earlier than poverty oat grass (per-sonal observation). As such, we believe that lowbush blueberry root development is hampered more by poverty oat grass than by sweet fern. In addition, the decrease in PFNR in lowbush blueberry with increasing poverty oat grass density is evidence of competition between these two species for acquiring fertilizer-derived N. This competition was probably responsible for the decrease in lowbush blueberry aboveground vegetative biomass production with increas-ing poverty oat grass density as suggested by the strong correlation between aboveground
veg-etative biomass and PFNR (Fig 5A). In contrast, the lack of impact of sweet fern density on
PFNR in lowbush blueberry suggests that sweet fern scarcely compete for acquiring N. In addi-tion, the higher N concentrations in lowbush blueberry tissues in sweet fern plots suggest that
the latter species even facilitates N acquisition by lowbush blueberry and possibly its biomass production.
Unsurprisingly, biomass N content in both weed species tended to increase with increasing
plant density (S1 Fig). However, while this increase was accompanied by an increase in PFNR
in poverty oat grass, this was not the case for sweet fern (i.e., constant PNFR); thus, sweet fern used increasingly another source of N to support its growth as its density increased, most likely
an increased contribution of atmospherically-derived N. Several studies have shown that N2
-fixing species tend to derive a higher proportion of their N from the atmosphere as
competi-tion for acquiring soil N increased [26,52–54]. Conversely, this proportion often decreases
with increased N fertilization [27,54]. Therefore, increased competition for soil N due to
increased plant density (lowbush blueberry + sweet fern) and the resulting increased demand
for N can explain sweet fern’s increased reliance upon N2-fixation. This mechanism can
pro-duce “N sparing”, i.e. increased inorganic N availability for neighboring species [28,29] and
explain why neither lowbush blueberry aboveground biomass production nor PFNR decreased
with increased sweet fern density. This use of atmospheric N2as a N source can explain the
higher intercept of the regression line of the relationship between aboveground biomass
pro-duction and PFNR (Fig 5A) and reveals that sweet fern can produce a larger amount of
bio-mass with less contribution from fertilizer-derived N. The interaction between lowbush blueberry and sweet fern resulted in an improved use of N as shown by higher plant biomass
production per surface unit and a higher proportion of15N recovered in lowbush blueberry
+ sweet fern plots (43%) than in lowbush blueberry + poverty oat grass plots (22%).
Conclusion
Our data show that lowbush blueberry is not as efficient as weed species at acquiring inorganic N from the fertilizer. In our experiment, lowbush blueberry captured most of the added fertil-izer only because individual plants had a well-developed root system. Fertilization in young lowbush blueberry stands having an undeveloped root system may not stimulate lowbush
blueberry growth, especially when poverty oat grass density is >10 plants m-2, in which case
fertilization may benefit the weed species more than the targeted plant. Our results show that poverty oat grass relies strongly on the fertilizer to fulfill its N demand relative to the other
studied species. At plant densities >25 plants m-2, poverty oat grass captured about the same
amount of fertilizer as blueberry despite a much smaller belowground biomass, resulting in a significant negative impact on blueberry’s vegetative biomass. In contrast, sweet fern uses atmospherically-derived N to support its N demand, especially when present at high density. This likely resulted in a “N sparing” phenomenon that alleviated the competition for acquiring N and explained the absence of detrimental effect of sweet fern density on lowbush blueberry fertilizer-derived N uptake. Based on our results, we recommend poverty oat grass suppression
before applying N fertilizer in areas where poverty oat grass density is >10 plants m-2. In
con-trast, fewer precautions are required for applying fertilizer in plots having sweet fern, as this species does not compete with lowbush blueberry for acquiring N. Further research is required to assess the impacts of both weeds on lowbush blueberry fruit production.
Supporting information
S1 Fig. Aboveground vegetative biomass (AGVBM) and belowground biomass (BGBM) N content (g N m-2) in the three study plant species. (a–d) N content in lowbush blueberry (LB) AGVBM and BGBM in mixtures with poverty oat grass (POG; dark grey bars) or sweet fern (SF; light grey bars). (e–h) N content in POG and SF AGVBM and BGBM in mixtures
(D1-D4). Values not sharing the same letters are significantly different atP < 0.05. (DOCX)
S1 Table. Soil characteristics in the study lowbush blueberry field. Data are shown for the two areas of the field where the plots were located: the area colonized by sweet fern and the area colonized by poverty oat grass.
(DOCX)
S2 Table. Results of analysis of covariance (ANCOVA) conducted on plants’ aboveground vegetative biomass (AGVBM) production. Plant species was used as a categorical variable and the percentage of fertilizer-derived N recovered (PFNR) in plants as a covariate. (DOCX)
S3 Table. Results of an analysis of covariance (ANCOVA) conducted on the percentage of fertilizer-derived N recovered (PFNR) in plants. Plant species was used as a categorical vari-able and the belowground biomass (BGBM) as a covariate.
(DOCX)
S1 Data. Raw data for N concentration (%) and15N/14N ratio in the aboveground and belowground biomass (g m-2) of lowbush blueberry, sweet fern and poverty oat grass as a function of weed density level and companion species.
(XLSX)
S2 Data. Aboveground and belowground biomass (g m-2), N concentration (%) and per-centage of fertilizer-derived N recovered [PFNR (%)] in lowbush blueberry, sweet fern and poverty oat grass as a function of weed density level and companion species.
(CSV)
Acknowledgments
The authors thank the Fonds de recherche axe´ sur l’agriculture nordique (FRAN-02), the Fonds de recherche du Que´bec–Nature et technologies (FRQNT), and the Fonds de
de´velop-pement de l’Universite´ du Que´becà Chicoutimi (FUQAC) for their financial support. The
authors thank M. Moreau and La Bleuetière Coope´rative de Saint-Eugène for providing access to their sites and infrastructures. Thanks also to Club Conseil Bleuet employees, Andre´anne Simard, Catherine Tremblay and Jean Guy Girard for their laboratory and technical assistance.
Author Contributions
Conceptualization: Robert L. Bradley, Maxime C. Pare´. Data curation: Jose´e-Anne Le´vesque.
Formal analysis: Charles Marty, Jose´e-Anne Le´vesque. Funding acquisition: Robert L. Bradley, Maxime C. Pare´. Investigation: Jean Lafond, Maxime C. Pare´.
Methodology: Jose´e-Anne Le´vesque, Jean Lafond, Maxime C. Pare´. Project administration: Robert L. Bradley, Maxime C. Pare´. Resources: Robert L. Bradley, Jean Lafond, Maxime C. Pare´. Supervision: Robert L. Bradley, Maxime C. Pare´.
Validation: Robert L. Bradley, Maxime C. Pare´. Writing – original draft: Charles Marty.
Writing – review & editing: Charles Marty, Robert L. Bradley, Jean Lafond, Maxime C. Pare´.
References
1. Tirmenstein DA. Vaccinium angustifolium. In: Fire Effects Information System, [Online]. U.S. Depart-ment of Agriculture, Forest Service, Rocky Mountain Research Station, Fire Sciences Laboratory. https://www.fs.fed.us/database/feis/plants/shrub/vacang/all.html; 1991.
2. Hall IV, Aalders LE, Nickerson NL, Vander Kloet SP. The biological flora of Canada. 1. Vaccinium angu-stifolium Ait., Sweet lowbush blueberry. Can Field-Naturalist. 1979; 93:415–27.
3. MAPAQ. Monographie de l’industrie du bleuet sauvage au Que´ bec [Internet]. Que´bec; 2016. Available from:https://www.mapaq.gouv.qc.ca/fr/Publications/Monographiebleuet.pdf
4. Yarborough DE. Establishment and management of the cultivated lowbush blueberry (Vaccinium angu-stifolium). Int J Fruit Sci. 2012; 12(1–3):14–22.
5. Bajcz AW, Drummond FA. Bearing fruit: flower removal reveals the trade-offs associated with high reproductive effort for lowbush blueberry. Oecologia. 2017; 185(1):27. https://doi.org/10.1007/s00442-017-3927-zPMID:28825112
6. Jensen KIN, Yarborough DE. An overview of weed management in the wild lowbush blueberry—past and present. Small Fruits Rev [Internet]. 2004; 3(3–4):229–55. Available from:http://scholar.google. com/scholar?hl=en&btnG=Search&q=intitle:In+Vitro+Culture+of+Lowbush+Blueberry+(+Vaccinium +angustifolium+Ait+.)#0
7. Eaton L, Sanderson K, Fillmore S. Nova Scotia wild Blueberry soil and leaf nutrient ranges. Int J Fruit Sci. 2009; 9(1):46–53.
8. Read DJ. The structure and function of the ericoïd mycorrhizal root. Ann Bot. 1996; 77:365–74. 9. Kerley SJ, Read DJ. The biology of mycorrhiza in the ericaceae. XIX. Fungal mycelium as a nitrogen
source for the ericoid mycorrhizal fungus Hymenoscyphus ericae and its host plants. New Phytol. 1997; 136(4):691–701.
10. Scagel CF. Inoculation with ericoid mycorrhizal fungi alters fertilizer use of highbush blueberry cultivars. HortScience. 2005; 40(3):786–94.
11. Penney BG, McRae KB. Herbicidal weed control and crop-year NPK fertilization improves lowbush blueberry (Vaccinium angustifolium Ait.) production. Can J Plant Sci. 2000; 80:351–61.
12. Percival D, Sanderson K. Main and interactive effects of vegetative-year applications of nitrogen, phos-phorus, and potassium fertilizers on the wild blueberry. Small Fruits Rev [Internet]. 2004; 3(1–2):105– 21. Available from:https://doi.org/10.1300/J301v03n01_11
13. Yarborough DE. Factors contributing to the increase in productivity in the wild blueberry industry. Small Fruits Rev. 2004; 3:33–43.
14. Lafond J, Ziadi N. Fertilisation azote´e et phosphate´e dans la production du bleuet nain sauvage au Que´-bec. Can J Plant Sci [Internet]. 2011; 91(1):535–44. Available from:http://pubs.aic.ca/doi/abs/10.4141/ cjss2013-048
15. Maqbool R, Percival D, Zaman Q, Astatkie T, Adl S, Buszard D. Leaf nutrients ranges and berry yield optimization in response to soil-applied nitrogen, phosphorus and potassium in wild blueberry (Vacci-nium angustifolium Ait.). Eur J Hortic Sci. 2017; 82(4):166–79.
16. Lafond J, Ziadi N. Biodisponibilite´ de l’azote et du phosphore dans les sols de bleuetières du Que´ bec. Can J Soil Sci [Internet]. 2013; 93(1):33–44. Available from:http://pubs.aic.ca/doi/abs/10.4141/ cjss2011-106
17. Sanderson K, Eaton L, Melanson M, Wyand S, Fillmore S, Jordan C. Maritime provinces wild blueberry fertilizer study. Int J Fruit Sci [Internet]. 2008; 8(1–2):52–62. Available from:http://www.tandfonline. com/doi/abs/10.1080/15538360802365939
18. Eaton LJ. Long-term effects of herbicide and fertilizers on lowbush blueberry growth and production. Can J Plant Sci. 1994; 74:341–5.
19. Thiffault N, Titus BD, Munson AD. Black spruce seedlings in a Kalmia–Vaccinium association: microsite manipulation to explore interactions in the field. Can J For Res [Internet]. 2004; 34(8):1657–68. Avail-able from:http://www.nrcresearchpress.com/doi/10.1139/x04-046
20. Kennedy KJ, Boyd NS, Nams VO. Hexazinone and fertilizer impacts on sheep sorrel (Rumex aceto-sella) in wild blueberry. Weed Sci. 2010; 58(3):317–322.
21. Lavoie V. La phytosociologie et l’ame´nagement des bleuetières. Le Nat Can. 1968; 95:397–412. 22. Smagula JM, Ismail AA. Effects of fertilizer application, preceded by Terbacil, on growth, leaf nutrient
concentration, and yield of the lowbush blueberry, Vaccinium angustifolium Ait. Can J Plant Sci. 1981; 61:961–4.
23. Paynel F, Murray PJ, Cliquet JB. Root exudates: a pathway for short-term N transfer from clover and ryegrass. Plant Soil. 2001; 229(2):235–43.
24. Paynel F, Cliquet JB. N transfer from white clover to perennial ryegrass, via exudation of nitrogenous compounds. Agronomie. 2003; 23:503–10.
25. Cong WF, Suter M, Lu¨scher A, Eriksen J. Species interactions between forbs and grass-clover contrib-ute to yield gains and weed suppression in forage grassland mixtures. Agric Ecosyst Environ [Internet]. 2018; 268(February):154–61. Available from:https://doi.org/10.1016/j.agee.2018.09.019
26. Nyfeler D, Huguenin-Elie O, Suter M, Frossard E, Lu¨scher A. Grass-legume mixtures can yield more nitrogen than legume pure stands due to mutual stimulation of nitrogen uptake from symbiotic and non-symbiotic sources. Agric Ecosyst Environ [Internet]. 2011; 140(1–2):155–63. Available from:http://dx. doi.org/10.1016/j.agee.2010.11.022
27. Rasmussen J, Søegaard K, Pirhofer-Walzl K, Eriksen J. N2-fixation and residual N effect of four legume species and four companion grass species. Eur J Agron [Internet]. 2012; 36(1):66–74. Available from: http://dx.doi.org/10.1016/j.eja.2011.09.003
28. Temperton VM, Mwangi PN, Scherer-Lorenzen M, Schmid B, Buchmann N. Positive interactions between nitrogen-fixing legumes and four different neighbouring species in a biodiversity experiment. Oecologia [Internet]. 2007 Mar; 151(2):190–205. Available from: https://doi.org/10.1007/s00442-006-0576-zPMID:17048010
29. Marty C, Pornon A, Escaravage N, Winterton P, Lamaze T. Complex interactions between a legume and two grasses in a subalpine meadow. Am J Bot [Internet]. 2009 Oct [cited 2011 Aug 10]; 96 (10):1814–20. Available from:http://www.ncbi.nlm.nih.gov/pubmed/21622302 https://doi.org/10.3732/ ajb.0800405PMID:21622302
30. Spehn EM, Scherer-Lorenzen M, Al E. The role of legumes as a component of biodiversity in a cross-European study of graasland biomass nitrogen. Oikos. 2002; 98:205–18.
31. Dow MA, Schwintzer CR. Seed germination, seedling emergence, and seed bank ecology of sweet fern (Comptonia peregrina (L.) Coult.). Can J Bot [Internet]. 1999; 77(9):1378–86. Available from:http:// www.nrcresearchpress.com/doi/abs/10.1139/b99-081
32. Hall I V., Aalders LE, Everett FC. The biology of Canadian weeds. 16. Comptonia peregrina (L.) Coult. Can J Plant Sci. 1976; 56:147–56.
33. Hurd TM, Schwintzer CR. Formation of cluster roots and mycorrhizal status of Comptonia peregrina and Myrica pensylvanica in Maine, USA. Physiol Plant. 1997; 99(4):680–9.
34. Darbyshire SJ, Cayouette J. The biology of Canadian weeds. 92. Danthonia spicata (L.) Beauv. in Roem. & Schult. Can J Plant Sci. 1989; 69:1217–33.
35. Shane MW, Lambers H. Cluster roots: A curiosity in context. Plant Soil. 2005; 274(1–2):101–25. 36. Smagula JM, Dunham S. Diammonium phosphate corrects phosphorus deficiency in lowbush
blue-berry. J Small Fruit Vitic. 1995; 3:183–91.
37. Covington D. Danthonia spicata. In: Fire Effects Information System, [Online]. U.S. Department of Agri-culture, Forest Service, Rocky Mountain Research Station, Fire Sciences Laboratory.http://www.fs.fed. us/database/feis/; 2000.
38. Paal T, Starast M, Noormets-Sˇ anski M, Vool E, Tasa T, Karp K. Influence of liming and fertilization on lowbush blueberry in harvested peat field condition. Sci Hortic (Amsterdam). 2011; 130(1):157–63. 39. Raymond R, Mailloux A, Dube´ A. Pe´dologie de la re´gion du Lac-Saint-Jean. La Pocatière, Que´ bec;
1965.
40. Kuznetsova A, Brockhoff PB, Christensen RHB. lmerTest Package: Tests in Linear Mixed Effects Mod-els. J Stat Softw. 2017; 82(13):1–26.
41. Lenth R V. Least-Squares Means: The R Package lsmeans. J Stat Softw. 2016; 69(1):1–33.
42. Abbott JE, Gough RE. Seasonal development of highbush blueberry roots under sawdust mulch. J Am Soc Hortic Sci. 1987; 112:60–2.
43. Williamson J, Krewer G, Pavlis G, Mainland CM. Blueberry soil management, nutrition and irrigation. Blueberries Grow Gard Promot EO, Gainesville, FL. 2006;
44. Alt DS, Doyle JW, Malladi A. Nitrogen-source preference in blueberry (Vaccinium sp.): Enhanced shoot nitrogen assimilation in response to direct supply of nitrate. J Plant Physiol [Internet]. 2017; 216(Novem-ber 2016):79–87. Available from:https://doi.org/10.1016/j.jplph.2017.05.014PMID:28578080
45. Townsend LR, Blatt CR. Lowbush blueberry: Evidence for the absence of a nitrate reducing system. Plant Soil [Internet]. 1966 Dec; 25(3):456–60. Available from:https://doi.org/10.1007/BF01394468 46. Na¨sholm T, Ekblad A, Nordin A, Giesler R, Ho¨gberg M, Ho¨ gberg P. Boreal forest plants take up organic
nitrogen. Nature. 1998; 392:914–6.
47. Bañados MP, Strik B, Righetti T. The uptake and use of 15N-nitrogen in young and mature field-grown highbush blueberries. Acta Hortic. 2006; 715:357–64.
48. Pescie MA, Borda MP, Ortiz DP, Landriscini MR, Lavado RS. Absorption, distribution and accumulation of nitrogen applied at different phenological stages in southern highbush blueberry (Vaccinium corym-bosum interspecific hybrid). Sci Hortic (Amsterdam) [Internet]. 2018; 230(October 2017):11–7. Avail-able from:https://doi.org/10.1016/j.scienta.2017.11.005
49. Messiga AJ, Haak D, Dorais M. Blueberry yield and soil properties response to long-term fertigation and broadcast nitrogen. Sci Hortic (Amsterdam) [Internet]. 2018; 230(November 2017):92–101. Available from:https://doi.org/10.1016/j.scienta.2017.11.019
50. Ringselle B, Prieto-Ruiz I, Andersson L, Aronsson H, Bergkvist G. Elymus repens biomass allocation and acquisition as affected by light and nutrient supply and companion crop competition. Ann Bot. 2017; 119:477–85.https://doi.org/10.1093/aob/mcw228PMID:28025285
51. Poorter H, Niklas KJ, Reich PB, Oleksyn J, Poot P, Mommer L. Biomass allocation to leaves, stems and roots: meta-analyses of interspecific variation and environmental control. New Phytol. 2012; 193:30– 50.https://doi.org/10.1111/j.1469-8137.2011.03952.xPMID:22085245
52. Andersen MK, Hauggaard-Nielsen H, Ambus P, Jensen ES. Biomass production, symbiotic nitrogen fix-ation and inorganic N use in dual and tri-component annual intercrops. Plant Soil [Internet]. 2005 Jan; 266(1):273–87. Available from:https://doi.org/10.1007/s11104-005-0997-1
53. Corre-Hellou G, Fustec J, Crozat Y. Interspecific competition for soil N and its interaction with N2 fixa-tion, leaf expansion and crop growth in pea–barley intercrops. Plant Soil [Internet]. 2006; 282(1– 2):195–208. Available from:http://link.springer.com/10.1007/s11104-005-5777-4
54. Carlsson G, Palmborg C, Jumpponen A, Scherer-Lorenzen M, Ho¨gberg P, Huss-Danell K. N2 fixation in three perennial Trifolium species in experimental grasslands of varied plant species richness and composition. Plant Ecol. 2009; 205(1):87–104.