HAL Id: hal-00935119
https://hal.archives-ouvertes.fr/hal-00935119
Submitted on 24 Feb 2014
HAL is a multi-disciplinary open access
archive for the deposit and dissemination of
sci-entific research documents, whether they are
pub-lished or not. The documents may come from
teaching and research institutions in France or
abroad, or from public or private research centers.
L’archive ouverte pluridisciplinaire HAL, est
destinée au dépôt et à la diffusion de documents
scientifiques de niveau recherche, publiés ou non,
émanant des établissements d’enseignement et de
recherche français ou étrangers, des laboratoires
publics ou privés.
Accelerated aging and life tests of optical fibers
Lotfi Berguiga, Cyril Lupi, Nicolas Hyon, Laurent Salomon, Guy Normand,
Roger Le Ny, Eric Tanguy, Dominique Leduc, Monique Auvray, Jean-Claude
Bizeul, et al.
To cite this version:
Lotfi Berguiga, Cyril Lupi, Nicolas Hyon, Laurent Salomon, Guy Normand, et al.. Accelerated aging
and life tests of optical fibers. Optical Fiber and Fiber Component Mechanical Reliability and Testing,
Nov 2000, Boston, United States. �hal-00935119�
Accelerated aging and life tests of optical fibers
Lotfi Berguiga, Cyril Lupi", Nicolas Hyon*, Laurent Salomon, Guy Normand", Roger Le Ny", Eric
Tanguy", Dominique Leduc", Monique Auvray, Jean Claude Bizeul
',
Alain Gouronnec
'
, Frédérique de
Fornel
,
Christian Boisrobert°, Michel Poulain* and Marcel Poulain*
LPUB, Groupe Optique de Champ Proche, Université de Bourgogne
°Laboratoire d
'
Optique et Optoélectronique, Université de Nantes
+
France Telecom CNET DTD/IBLIMOF,
*Laboratoire des Matériaux Photoniques, Université de Rennes I
Keywords: silica, aging, reliability, interferometry,microscopy
INTRODUCTION
The reliability of the network optical fibers is a critical issue for telecommunications.New investigations methods have been developed within a cooperative program supported by France Telecom.They include low coherence interferometry and optical near field microscopy in association with classical analysis tools such as Scanning Electron Microscopy and Shear Force Microscopy.One aim of the study is the localization and the characterization of the defects from which failure originates. The aging effect has been investigatedin silica fibers immersed in desionized water at 65
oc
and 85 "C for different times: from 3 to 12 months1.
EXPERIMENTAL SET-UP
1.1Near field optical microscopyLight emitted by objects consists of propagating and evanescent waves.Information from details which are smaller than half a wavelength is contained in the evanescent fieldl.A classical optical microscope detects only propagating waves and this is why lateral resolution is limited to about half wavelength of the light source. Near field optical technique' is based on detection of propagating and evanescent waves in the near field of the sample i.e. at a distance far less than the wavelength À.
The probe detects the light by collecting a part of the propagative wave and by frustrating a part of the evanescent field laying near the surface of the sample. In order to reach a good lateral resolution the apex of the probe must have a radius of curvature smaller than100nm. The probe is here a multimode optical fiber chemically etched by HF (Hydrogen Fluoride). This kind of microscopy is known as Scanning Near Field Optical Microscopy (SNOM). Our experimental set-up that we had also described in ref. 3.
With this microscope we are able to detect two different signals which are respectively optical signal and interaction force between probe and sample surface well known as shear force interaction. Since each signal could be chosen as the signal of feedback loop, the microscope has two working modes. But in the following section we will present only one mode whose shear force interaction is the signal of feedback 100p4.5.
50
Optical Fiber and Fiber Component Mechanical Reliability and Testing, M. John Matthewson,
Editor, Proceedings of SPIE Vol. 4215 (2001) © 2001 SPIE . 0277-785X101/$15.00
The principle is quite similar to tapping mode in AFM, but here the probe vibrates parallel to the surface in one of its eigenmodes. When the tip approaches the surface, tip oscillation is damped due to lateral atomic force known as shear forcés The effect of this force starts at ten nanometers above the sample surface (actually this starting value oscillates between 5 to 20nm), and increases continuously when distance between surface and sample diminishes.
The feedback loop locks the measured force in a fixed value, which corresponds to a fixed distance between sample surface and tip. And so when the tip scans an area of the surface, vertical motion of tip to maintain the distance constant gives the sample topography. The vertical resolution reached is below a nanometer and lateral resolution is in the dimension order of the tip end.
As the tip is very near from the surface, (we can set the distance from 1nm to IOnm), simultaneously the tip is able to detect the evanescent field emitted by the surface. The microscope turns out simultaneously two images: a topographic and an optical image.
In order to generate evanescent field, a 633 nm He-Ne laser illuminates a semi-cylindrical prism in total internal reflection configuration. The aged fiber was glued on a coverglass with transparent glue. A gel ensures optical contact between the coverglass and the prism. So evanescent field and propagating field are partly collected by the fiber probe and transmitted to a photomultiplier-tube. After that the optical signal is amplified and acquired by a Nanoscope E Digital Instrument system.
1.2 Low coherence reflectometry
The low coherence reflectometry technique is based on white light interferometry. Optical wave propagation defects are sligthly reflective and can be detected along single mode waveguides. We designed our system to derive both the amplitudes and the phases of the interferograms. We can analyze a fiber sample length of 2 meters,detect and localize two reflecting defects with a high accuracy and measure propagation and reflection parameters. We applied this technique and used our system on G652 fibers.
The optical system is a Michelson single mode fiber-interferometer aligned around a 2- by -2 coupler.The broadband infrared light source ( 1.3 or 1.5 urn incoherent light emitting diode or amplified spontaneous emission fiber source) and the photodetector are respectively connected to the input and ouput arms of the coupler. The sample under test is connected to the test arm fiber. The wave propagating along the reference arm is collimated at the output of the reference arm fiber on a parabolic mirror, reflected-and-folded on a comer cube and reflected on a fixed plane mirror back to the coupler. The reference arm comer cube stands on an airborne translation stage back-to-back with two comer cubes.These two reflectors are the part of the variable length arm of a second Michelson interferometer associated to a frequency stabilized HeNe laser fringe counter. Under these conditions the HeNe fringe detector counts one fringe every 1/8 of a HeNe wavelength, and the optical path lengths of both red and infrared reference arms are known with a very high accuracy. The red fringe signals reshaped through the counter are used to sample the infrared interferograms which are processed afterwards.
Four to five fiber samples ( 50±0.1 em) of each fiber under test have been connected to our measuring system.Samples of fibers which were not put under stress were used as references. The minimum detectable power of our system is approximately 5 pW when we use a stable and high power light source (20 mW). Its dynamic range is 75 dB, which means that a 6.10-4difference between two refracted indices across a plane can be detected. We process the signals reflected by the
cleaved output faces of the fiber samples. Each fiber sample is probed ten times: for each sample ten interferograms are detected and stored.The current injected in the source is kept constant and its light spectrum is assumed to remain the same. The interferograms Fourier transforms are averaged:both the amplitude and the phase are derived.The amplitude depends on many parameters-connectorsinsertion losses,fiber output angle and pollution which cannot be controlled. The phase then seems to be a far more reliable and appropriate parameter than the amplitude.
1.3 Mechanical measurements
Measurementshave been implemented according to the international standard
lEe
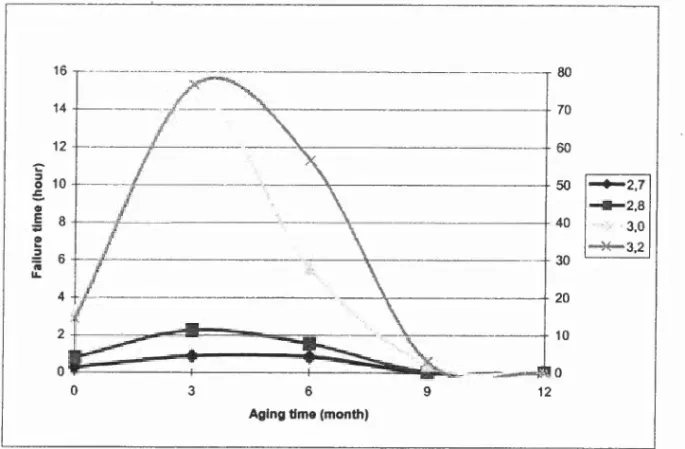
79312.Tested fiber length is one meter.The static fatigue parameters were measured by a static bending test in which fiber is winded around a calibrated ceramic mandrel. Fibers are dried at room temperature and ambient atmosphere before testing.Fiber failure is measured optically. Mandrel diameters were 2.7, 2.8, 3.0 and 3.2 mm, which corresponds to stress values of 3.34, 3.22, 3.0 and 2.8GPa respectively.
Pme. SPIE Vol. 4215 61
2.PREPARATION OF FIBER FOR OBSERVATION 2.1Aging conditions
We have chosen commercialopticalfiber G652. Theywereimmersedindeionized water at65and 85°C.Time aging are
three, six, nine months andoneyear.Fiberwas furnished andaged byC.N.E.TLannion (France).The process aging at 85°C
should bedifferent than at 65°C because at 85°C the integrityof the coatingis altered. Wehave noticed the color changeof polymer at85°C forthree,sixand nine months aged fiber.
2.2 Stripping technique
Ifwe wantto study silica surfaceof aged opticalfiber,the polymer coating should be removedwithoutdegradingthe
mechanical propertiesof fiber. There are three ways to stripcoating from the fiber. The most used techniqueismechanical
stripping with strippers, but it damages the fiber surface.The second way, which is the easiest, is to swell the coating using a solvent such as methylene chloride. Since the coating loses its adherence on the cladding,it becomes very easy to remove it. In the last solution, the polymer coating is stripped byan acidattack", The acid is usually sulfuric acid at high temperature. We have chosen acid stripping for several reasons.As we discussed previously,Rondinella and Matthewson7studied the
surface roughness of agedfiber and showedit did not reveal the aging when the fiberis stripped by methylene chloride.In contrast with acid stripping, the surface is correlated with the residual strength.They interpret this fact by the existence of a hydrated surface layer of silica gel that would be remove only by acid.While the fiber is aged,the penetrating water through coating to the silica surface may produce this layer. Moreover it was demonstratedin reference 6) coating was stripped in hot concentrated sulfuric acid, the strength ofthe fiber is not affected.
In a former3work,the stripping conditions (see table I) were not as much efficient as we expected to eliminate totally the
polymer cladding.Despite theincrease of the immersion time in acid, elements of polymer still remains with an average lateral size of 3 to 5 hundreds nanometersand one hundred nanometer high.
This observation led us to prepare harsherstripping process. Two different processes (Cf table I) were set-up.These two processes consist to decompose stripping in two step.The first one suppresses the majority of polymer cladding by acid attack for process A or by swelling with a solvent for process B.In the second step,hot acid (l80-200°C) should attack polymer which has resisted to the first step.
A study of the stripping of each process has been done versus the time immersion in acid (lmn to 20mn).From images obtained with SEM (Cf Figure I) and with the Shear Force Microscope (SFM)in figure 2.We can remark that:
-Even if process A and B are harsher,polymer residues still remains.
-The increase in time of immersion in acid does notimprove at all the efficiency of stripping.In other words size and density of residues on the surface is quite similar.
If we compare these processes with the process of former work', process A and Barebetter. Perunitofsurface, residues are
less numerous than with former process, and the average lateral sizeand height of residues decrease respectively to 100 nm and 20 nm.This difficultyto eliminate totally the polymer coating could be explained by a strong adherence of the polymer coating on the silica surface of the present optical fiber.
Former Process Immersion in H2S04 at 160°C+ rinsing in deionized water 30s
Process A Immersion in Hwater30s2S0+Immersion inH4at 180-20QoC+Swelling with methylene chloride+rinsing in deionized 2S04at180-20QoC+rinsing in deionized water 30s
62 Proc.SPIEVol.4215
Process B Swelling with methylene chloride+ rinsing in deionized water 30s+ Immersion in H2S04 at 180-200°C+rinsing in deionized water30s
Table I:Processofstripping
For relativelyimportantdomainof(lO!-lm)2,we observe still polymerresidues,butdomains ofthe orderof(1~/ are often exemptofresidues.Inthenextsection wewill presentimages andstatisticalresults of smallcleanarea ofopticalfibers with agingconditionsdescribed in paragraph3.1 andstripped with process B.
3. RESULTS AND DISCUSSION
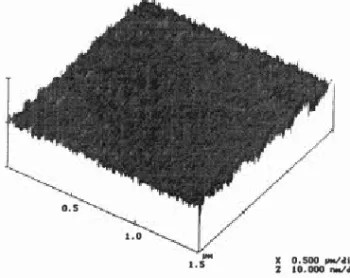
3.1 Studyof topography of aged fiberThe surface topographyof aged fiberat 65°C and85°C during 3, 6,9, 12 months hasbeen observedwith our near field microscope. Some typical images of these surfaces are presented in figures 4 to 9.No apparent modification of the surface with aging in harsh environment was observed.Moreover it is ratherhard to interpret these images only with qualitative observations.TableII showsthe roughnessRMS versus aging conditionsandit confirmsthat none evolutionis noticeable.
Since the number of images of fiber surface for each condition of aging is important,statistical study is rather tedious with onlythe roughness parameter. We use the Power Spectral Density (PSD), which is the frequency spectrum of the surface roughness measuredin inverse length units". The PSD provides an information about roughness at different scales of a topographic image.For example,ifthe surface presents a periodic structure or a change in the structure of the surface versus or spatial frequency, this behavior should be detected with the PSD graph.
For each condition of aging,PSD ofmany scanned surfaces of I to (2!-lm2)are compared.We note that for fiber aged 3 months at85°C, PSD curves are very narrow to each other (see figure 10).This point indicates that structure of fiber surface is homogenous.Same feature for fiber aged 3,6, 9 months at 65°C and 85°C was observed.About fiber aged 12 months at 85°C (figure11),a dispersion in the PSD graphs occurs at high spatial frequency.Still in figure 14,this dispersion raises when we go to higher spatial frequency.Fibers aged 12 months at65°C seem to be an intermediate case where the apparition of dispersion (Cf. fig.12) is less important than in figure 11. In the graph of figure 11 (so for fiber aged 12 months at 85°C) the starting point of dispersion is for lower spatial frequency than in figure 12(i.e.fiber aged 12 months at 65°C).We can interpret theseresults by two phenomena:The surface begins to change not at every scale but for the smallest details.At this scale the roughness increases but heterogeneously, in other words some areas have modified structure for fine details whereas otherareas are less affected.When this effect becomes important for the fine details,the change in the structure of the surface for greaterdetails starts and involve heterogeneously at thisscale too.And so on for greater scale...
Theseresultsshow despite harsh aging conditions,theevolution of fibersurface is very weak and surfaceisverysimilarto non aged optical fiber and thin differences are observable for one year aging and at nanometric scale.Those observations are notincontradiction with mechanicaltestsandlowcoherence reflectometry.
Non aaed fiber 3 months 6 months 9months 12months
16Soc
0.5nm 0.5nm OAnm 0.5nm OAnm
18Soc OA-0.5nm O.3-0.4nm No measurement 0.3-0.8nm
Table II: RMS roughness for IJ.1m2area versus aging conditions of optical fiber.
3.2 Optical information
Nearfield optical images which are obtained do notreveal anyparticular information about aging of optical fiber. Opticalimage could give a complementaryinformationabout surface andsubsurface of the fiber that topographyis not able to detect. To illustrate this affirmation,on a surface of a fiber aged at 9 months., a localized structure along a line of few micrometers length and 200 nm wide went across the optical image and did not appear on the corresponding topographical image.Itturns out that this detected structure can beinterpreted as a local refractive index variation or a failurein the silica
Proc.SPIE Vol. 4215 63
subtract which is not resolved by the SFM. When we compare this optical image and numerical simulationll, the nearest result is for a crack of 20 nm deep and 10 nm wide.
3.3 Low coherence reflectometry
Measurements have been implemented according to the conditions described above. All samples have been probed along their total lengths and no characteristic echo has been detected. In other words, the aging conditions considered did not induce defects with such abrupt variations of the refractive index.
The phase of the signal is a function of the wave number and we calculate its derivative. Two sets of derivatives are plotted against the wave number on figure 13.They correspond to two different types of fibers and two aging test durations at 85 "C.These curves have a parabolic shape and present an extremum at the fiber zero dispersion wave number (ZDWN). We will focus on this last parameter which seems to depend on the fiber intrinsic characteristics only. We experimentally observe a variation of 10')mu" this zero dispersion wave number for different samples of the same fiber which we consider as the lowest detectable limit with our measurement technique. This sensitivity is high enough to detect a noticeable difference on the evolutions of the two types of fibers.More precisely the ZDWN of the fiber with the «standard»protection coating is approximately 0.758 mu' and the ZDWN of the fluoride protection coating is close to 0.752 mu'. These two values correspond to two different fiber structures as we could observe in SEM pictures. This demonstrates that we can quantitatively characterize fibers and identify them without ambiguity
Aging tests at 85 "C have been applied to the fibers with the «standard» coating. The phase derivatives vs wave number are plotted on figure 13b for several test durations. We see no difference between the curves and this feeling is confirmed by the measurement of the ZDWN:they are in the order of10-4mu' which is not significant. We can draw the same conclusions from the results obtained on the fibers with the fluoride coating.
3.2 Static fatigue tests
The static fatigue measurements show that the failure time increases when the fiber is aged in hot water. This is exemplified by figures 14 to 17.This effect depends on the nature of the coating and also on temperature. The evolution of the failure time is not monotonous.Itis maximum after 3 to 6 months, then it decreases beyond the initial value. Note that the behavior at 65 "C is different with the fluorinated coating:. In a first step, failure time decreases, then it is enlarged. Coating seems damaged after 15 months at 85 "C.
These results may appear paradoxical as water is known to decrease fiber strength and reliability. The overall process is complex asit involves interactions between water molecules and silica, but also polymeric coating.. Among other possibilities, water could reinforce the bonding adhesion between coating and glass surface.
4. CONCLUSION
Silica fibers have been aged in water at 65 and 85
oc.
No significant change was observed at fiber surface after special stripping. No aging induced stresses was detected by low coherence reflectometry.Static fatigue tests shows that failure time is larger for aged fibers after 3 to 6 months. For larger aging times, fiber strength becomes much smaller, which may be correlated to the degradation of the coating.REFERENCES
I. Wolf E., Nieto-Vesperinas M.: "Analycity of the angular spectrum amplitude of scattered fields and some of its consequences",J. Opt. Soc.Am. A, 2,886,1985.
2. Betzig E., 'Principle and application of near-field optical microscope", Near Field Optics, NATO ASI series, Pohl D., Courjon D; pp. 7-15, Klumer, Dorecht, 1993
3. L. Berguiga, F. de Fornel, L. Salomon, A. Gouronnec, J. Bizeul, Proc. Soc. Photo-Opt. Instrum. Eng. ,3848, pp167-175,1999
4. E. Betzig, P.L Finn and J.S Weiner, "Combined shear force and near-field scanning optical microscopy" Appl.phys. lett. 60,pp.2484(1992)
5. R. Toledo-Crow, P.C Yang, Y.Chen and M.Vaez-Iravani, "Near-field scanning optical microscope with atomic force regulation" Appl.phys.lett, 60, pp. 2957 (1992)
64 Proe.SPIEVol. 4215
6. M. J. Matthewson, C. R. Kurkjian andJ. R.Hamblin, "Acid stripping of fused silica optical fibers without strength degradation", J Lightwave Technol., 15, [3], pp 490-497,1998.
7. V.V Rondinella and M.J.Matthewson,"Effect of chemical stripping on the strength and surface morphology of fused silica optical fiber," Proc.Soc.Photo-Opt. Instrum.Eng.,2074, pp. 52-58,1993
8." Introduction to Surface Roughnessand Scattering",J.M.Bennet,L.Mattsson., Optical Society of America,1989.
9. M.J. Matthewson and H.H. Yuce"Kinetics of degradation during fatigue and aging of fused silica optical fiber" Proc.
Soc.Photo-Opt.lnstrum.Eng.,2290, pp.204-210,1994
10. R.S.Robinson and H.H.Yuce"Scanning tunneling microscopy of optical fiber corrosion:surface roughness contribution to zero-stress aging", 1. Am.Ceram. Soc., 74, [4],pp. 814-818, 1991
II L.Salomon, F.de Fornel,P. M.Adam,J.Opt.Soc. Am. A, 16, [II], pp 2696-2704,1999 12 International standard
rsc
793-1-3,First Edition 1995-10Proe. SPIE Vol.4215 65
Figurel: SEM image of an optical liber stripped with Process A,
PM
X 2.000lM/di.
Z 30.000""/dl.
Figure2: Topographical image of an optical liber stripped with process A.
This image was obtained with the SFM
10.0 SO.O MU 10.0 SO.O AM
7.5 25.0..u 7.5 25.0 no.
5.0 0.0 MU 5.0 0.0 Nil
2.5 2.5
PM PM
Figure 3: Optical image (left image) and topographic image (right image) of an aged fiber 9 months at 65°C stripped with former
process.At the left corner in the opticalimage, the arrow indicates the localised structure.
66 Proe. SPIE Vol. 4215
X 0.200 ","",dill 2 10.000 rw/dh
Figure 4:Image of the surface of one non aged fiber.
...
1.5 0.50010.000JMldhIlMIdiu
Figure 6: Image of the surface of 6 months aged fiber at 65°C.
...
2.0 X 0.500 PM/div
2 10.000 """diu Figure 8:Image ofthe surface of 12 months aged at 65°C
X 0.500"""di. Z 10.000 n.e/div
Figure 5-: Image of the surface of 3 months at 85°C aged. fiber
OM
X 0.200 ..lII'div 2 10.000 ,...., .. iu
Figure 7: Images of the surface of 6 months aged fiber at 85°C •
X 0.500 PMldiu 2 10.ODD NI/diu
Figure 9: Image of the surface of 12 months aged fibers at 65°C
Proe. SPIEVol.4215 67
Reference Plot 051516zo li yes ù5150Bil yes 062107io yes 062220zo yes 062221io yes 062307zo yes 104r- ~---~ 2 D I S
o
10-'~ ~---~ 10'figure 10:Power spectral density of several optical fibers aged 3 months at 85°C.
Wavelength (~M/cycle): 10-3 104r- ~---~ Reference Plot 2 041707zo lE yes D 05052310 yes I 050517io yes S 0 052S06io yes 05260320 yes 052713il yes 10 -2 10'
figure 11: Power spectral density of several optical fiber aged 12 months at 85°C.
Wavelength (~M/cycle): 10-3 104r- ~---_, Reference Plot 2 042824io lE yes D D50205iO y&S I 050307iO yes S 0 050307z0 yes OSlS04iO yes 061906z0 yes 10 -, 10'
figure 12: Power spectral density of several optical fiber aged 12 months at 65°C.
Wavelength (~M/cycle):
68 Proe.SPIE Vol. 4215
Downloaded From: http://proceedings_spiedigitallibrary.org/ on 02120/2014Terms of Use: http://spiedI.org/terms
\
\.
16 80 14 70 12 60
..
::l 10 50 ... 2.7 0::.
_2.8 GI E 8 40 ,3.0..
e
"'"'*""
3.2.a
6 30 ii II.. 4 20 2 10 0 0 0 3 6 9 12Aging time (month)
Figure 17 : Fiber 2 aged at 85°C. Right scale correspond to the 3.2 mandrel.
Proe.SPIEVol. 4215 71