Experimental Determination of the Thermal Di
ffusivity of α‑Cryolite
up to 810 K and Comparison with First Principles Predictions
Aïmen E. Gheribi,
*
,†Sa
́ndor Poncsák,
‡László Kiss,
‡Sébastien Guérard,
§Jean-François Bilodeau,
§and Patrice Chartrand
††CRCTPolytechnique Montréal, P.O. Box 6079, Station Downtown, Montréal, Québec H3C 3A7, Canada ‡Université du Québec à Chicoutimi, 555, Boulevard de l’Université, Chicoutimi, Québec G7H 2B1, Canada
§Rio Tinto AluminumCentre Recherche et Développement Arvida, Rio Tinto Alcan, 1955 Boulevard Mellon, Jonquière, Québec
G7S 4K8, Canada
ABSTRACT: In aluminum electrolysis cells, a ledge of frozen electrolyte is formed on the sides. Controlling the side ledge thickness (a few centimeters) is essential to maintain a reasonable life span of the electrolysis cell, as the ledge acts as a protective layer against chemical attacks from the electrolyte bath used to dissolve alumina. The numerical modeling of the side ledge thickness, by using, for example, finite element analysis, requires some input data on the thermal transport properties of the side ledge. Unfortunately, there is a severe lack of experimental data, in particular, for the main constituent of the side ledge, the cryolite (Na3AlF6). The aim of this study is twofold. First, the
thermal transport properties of cryolite, not available in the literature, were measured experimentally. Second, the experimental data were compared with previous theoretical predictions based on first principle calculations. This was carried out to evaluate the capability offirst principle methods in predicting the thermal transport properties of complex insulating materials. The thermal
diffusivity of a porous synthetic cryolite sample containing 0.9 wt % of alumina was measured over a wide range of temperature (473−810 K), using the monotone heating method. Because of limited computational resources, the first principle method can be used only to determine the thermal properties of single crystals. The dependence of thermal diffusivity of the Na3AlF6+ 0.9 wt
% Al2O3mixture on the microstructural parameters is discussed. A simple analytical function describing both thermal diffusivity and thermal conductivity of cryolite as a function of temperature is proposed.
■
INTRODUCTIONIn aluminum electrolysis cells, a molten cryolite bath (80 wt % Na3AlF6−12 wt % AlF3−5 wt % CaF2−2 wt % Al2O3) is used to
dissolve the alumina (Al2O3). The typical working temperature of the cells lies between 5 and 10 K above the cryolite bath liquidus temperature, which is∼1233 K. As a result, a ledge of frozen electrolyte melt is formed, attached to its sides. From a purely industrial point of view, this side ledge is fundamental for cost-effective electrolysis cells (long life and reduced maintenance) as it acts as a protective layer to prevent erosion and chemical attacks. Even though the side ledge thickness depends on several factors (chemical composition of the electrolyte, ambient temperature, cell voltage, cell current, feed cycle, frequency and duration of anode effects, amount of alumina covering over the anodes, metal tapping, and anode changes), the main limiting factor for its numerical modeling is the lack of experimental data on thermal transport properties. To alleviate this lack of data, we have carried out theoretical studies to predict the thermodynamic and thermal transport properties not only of cryolite but also of all compounds potentially present in the side ledge. The theoretical approach used to predict the phase properties is based on both classical and quantum methods. The thermal conductivity was predicted
using atomistic1−4or classical equilibrium molecular dynamics (EMD) calculations.5−9The atomistic calculations were carried out through the density functional theory (DFT), whereas the EMD used interatomic potential parametrized also on a DFT basis. For the few compounds present in the side ledge for which data were available (NaF, LiF,α-Al2O3, and CaF2), both
classical and atomistic methods have shown good predictive capability with an accuracy comparable to the experimental error. In a recent study,10the thermal conductivities of several side ledge samples extracted from a postmortem industrial electrolysis cell have been measured from 373 to 823 K via a laserflash method. The microstructure of the samples, in terms of phase composition and microstructural parameters, was found to depend on their position in the electrolysis cell. This is especially true for the samples extracted from the bottom of the cells, which showed a high porosity, above 35%. Then, the experimental thermal conductivity measurements were com-pared with those predicted using (i) the theoretical temper-ature-dependent thermal conductivity of each phase, (ii) the
Received: February 21, 2017
Accepted: May 9, 2017
Published: May 22, 2017
Article http://pubs.acs.org/journal/acsodf
effective medium theory model11
for the description of the phase assemblage model, and (iii) a reliable porosity model that may be able to take into account the critical behavior of the thermal conductivity at high porosity (≥25%). For all samples, the predicted thermal conductivity was found to be in very good agreement with that determined in the experiment, for the entire range of temperature. This suggests the good reliability of the theoretical temperature-dependent thermal conductivity predictions of the phases potentially present in the side ledge, obtained in our previous work.4,6 However, given that cryolite is the main constituent of the side ledge, it would also be interesting to obtain experimental information on its thermal transport properties. From a theoretical point of view, such information would be crucial when confirming the reliability of our approach in predicting the lattice thermal conductivity of complex compounds. If need be, the model could also be improved or corrected by fine-tuning the parameters or by adding other contributions to the thermal transport properties.
The aim of this work is to experimentally determine the thermal transport properties of cryolite up to theα → β phase transition (836 K) to confirm or reject the previous theoretical predictions obtained by combining EMD and DFT simulations. The experimental results are discussed in terms of the dependence of both temperature and microstructural parame-ters. Special attention is paid to the porosity dependence. A simple expression for both thermal diffusivity and thermal conductivity of the dense (i.e., zero porosity) cryolite as a function of temperature is provided. The reliability of DFT methods in predicting the thermal transport properties of complex electrically insulating compounds is discussed.
■
THEORETICAL MODELING OF THE THERMALDIFFUSIVITY AS A FUNCTION OF TEMPERATURE AND POROSITY
A theoretical expression for the thermal conductivity (K), heat capacity, and density as a function of temperature of the cryolite (α and β) and γ-alumina has been formulated in our recent work.4The approach used to describe the lattice thermal conductivity is based on the Callaway−Slack12,13expression
θ γ γ δ = ̅ × − + × ∞ ∞ K T m n A T T ( ) 0.514 0.228 ( ) lat. D 3 2/3 2 (1)
where γ and θDare the Grüneisen parameter and the Debye temperature, respectively. The constant A is equal to 6.51982× 10⁻³ (kb/ℏ)3,13,14
m̅ is the average mass per atom, and δ3
represents the average volume per atom. Last, n is the number of atoms per primitive cell; this gives the crystallographic structure dependence of the lattice thermal conductivity. The key parameters describing the thermal conductivity,γ and θD, describe both the heat capacity and the thermal expansion,α = −ρ−1 (∂ρ/∂T). The parameters in eq 1 were determined by
combining DFT calculations, a modified quasi-harmonic
approximation theory, and thermodynamic optimization when data are available. For cryolite, the model parameters describing
eq 1were obtained according to a mixed method. First,γ and θD were calculated by DFT and were adjusted to
simulta-neously reproduce the available data on heat capacity and molar volume as a function of temperature. Forγ-alumina, a severe lack of experimental data on thermodynamic (heat capacity) and volume properties (thermal expansion coefficient and adiabatic bulk modulus) is observed. To alleviate this lack of data, the model (eq 1) parameters were determined purely ab initio via DFT calculations. More information about the modified quasi-harmonic approximation method and the calculation procedure for the thermal conductivity model (eq 1) parameters can be found in refs 2 15, and 16. The parameters describing the thermal conductivity, the heat capacity, and the density as a function of temperature are reported inTable 1, obtained from the study by Gheribi and Chartrand.4 The heat capacity at constant pressure includes only the vibrational contribution; that is, the defect contribution is neglected. The theoretical expression of CP as
a function of temperature is given by15CP = CVD (1 + γαT),
where CVD is the Debye heat capacity at constant volume.
Similarly to CP, the thermal expansion can be expressed as a
function ofγ and θD. However, for the reasons of clarity and
reproducibility of the results, the thermal expansion used the following empirical function:α(T) = α0+α1T +α2/T +α3/T2.
The coefficient set {α0,α1,α2,α3} was determined by a
least-squarefitting on the theoretical model. The density was then expressed asρ=ρ298 ×e∫ (−α) dT
T
298 , whereρ
298is the density at
298 K. The theoretical lattice thermal diffusivity of a dense compound (zero porosity) was then deduced from eq 1
according to the relationship
ρ = = = × = a T P K T P C T T P ( , 0) ( , 0) ( ) ( , 0) lat. lat. P (2)
At low porosity (P), it has been shown in our previous study10 that the thermal conductivity of the side ledge microstructure decreases as (1 − P)2. Given that the heat capacity is independent of the porosity and the density decreases as (1 − P), in this case, the thermal diffusivity decreases linearly with the porosity. Above a certain porosity (typically above approximately 15%), the description of the thermal transport properties requires reliable information on the microstructural parameters (type of microstructure, grain size, grain size distribution, grain orientation, and chemical composition of grain boundary) and their link with the porosity. In the case of micropores, uniformly distributed, it has been shown that the thermal conductivity displays a critical behavior.17−19 There is a drastic decrease beyond a certain critical porosity when the probability of interconnection of pores becomes nonnegligible. A critical behavior was also observed for the highly porous (P≃ 35%) side ledge10 (the cryolite is the main constituent of the side ledge). Nevertheless, the present configuration is quite different. Indeed, the porosity Table 1. Theoretical Model Parameters Describing the Thermal Conductivity and the Density as a Function of Temperature for α-Cryolite and γ-Aluminaa
space group n ρ298(kg·m−3) θD(K) γ∞ 105× α0(K−1) 109× α1(K−2) 103× α2 α3(K)
α-Na3AlF6 P21/n 20 2885 515 1.61 12.80 34.0 4.93 1.64
γ-Al2O3 Fd3̅m 10 3651 880 0.95 2.02 2.22 −1.12 −0.31
of the present cryolite sample is a macroporosity. InFigure 1, an optical image shows the pore distribution and size. Clearly, the pores are of macroscale with dimension lying between 0.5 to 2.5 mm.
According to the kinetic theory of phonons in solids, the lattice thermal conductivity is expressed as Klat.= 1C̃ νl
3 V g ph.,
where C̃V,νg, and lph.are the heat capacity per unit volume, the
phonon group velocity, and the phonon mean free path, respectively. In the case of a small porosity concentration, the modification of the phonon mean free path with the pores can be expressed as lph.−1= lph.,P=0−1+ lph.−P−1, where lph.,P=0 is the
phonon mean free path at zero porosity solid and lph.−Pis the mean free path in the phonon-pore scattering. It can be shown that lph.−Pcan be approximated by lph.−P≃ RPP−1/3,20where RP is the pore radius. This approximation leads to the following expression for the lattice thermal conductivity as a function of porosity20 = − + × = = K T P P P K T P ( , ) 1 1 ( , 0) l R lat. 1/3 lat. P ph., 0 P (3)
In the dense cryolite, the phonon mean free path is approximately few nanometers (νg≈ 3000 m·s−1and CV≈ 3
kB/atom) and RPis approximately 1 mm. Thus, according toeq 3
≃ = × −
Klat.( , )T P Klat.( ,T P 0) (1 P) (4)
The linearity of Klat. with the porosity implies that the
thermal diffusivity is independent of the porosity
≃ =
alat.( , )T P alat.( ,T P 0) (5)
The linearity of the thermal conductivity with the porosity is not an unusual behavior for minerals. It has been shown that for a large variety of oxides with large pores (thus with a small porosity density), the thermal conductivity is well-described by a linear behavior21up to 50% porosity.
The other microstructural parameters that may affect the thermal conductivity and the thermal diffusivity are the presence of the grain boundaries and the types of phase assemblage. In the present case, the system is almost pure cryolite. The effect of grain boundaries upon the thermal
transport results in the degradation of thermal conductivity and thermal diffusivity. This degradation is proportional to the number of grain−grain boundaries. Gheribi and Chartrand22 proposed a rather simple but an accurate theoretical model predicting the thermal conductivity as a function of both temperature and average grain size. In particular, a characteristic average grain size (dmax), above which the thermal transport properties can be considered identical to those of the corresponding single crystal, was formulated. This value depends on key physical parameters: θD, γ, νS, and n.
Considering the parameters given in Table 1, this model22 leads to dmax≈ 5 μm. The average grain size observed for this
sample is larger than 30μm. Thus, one can reasonably assume that the thermal diffusivity is independent of the grain size. In other words, the average number of grain boundaries is too small to influence the thermal transport within the sample. Last, to calculate the dependence of the thermal diffusivity of the sample on the phase assemblage, we have considered the Garnett-Maxwell mixture model11 and a linear relationship between both the volume and the heat capacity with alumina weight fraction. The Garnett-Maxwell model was chosen because of its capability to describe the thermal transport of microstructures consisting of a main matrix (cryolite) with a dilute inclusion (alumina).11
■
RESULTS AND DISCUSSIONThe measured thermal diffusivity is based on the apparent thermal diffusivity. The apparent thermal diffusivity is a sum of two contributions: a conductive one and a radiative one. The “true” or “physical” thermal diffusivity is the conductive thermal diffusivity. It depends only on the material properties (ground state electronic structure, phonon spectrum, crystallographic structure, atomic masses, etc.) and physical and microstructural parameters (temperature, porosity, grain size, grain boundaries, phase assemblage, etc.). The so-called effective radiative contribution in a semitransparent medium depends on extrinsic parameters such as sample size, optical properties of the heater, outside radiation, and boundary conduction besides its intrinsic optical properties. The effective radiative contribution can also originate from parasitic electrical and/or thermal signals. Although experimental apparatus can, in principle, directly measure the true thermal diffusivity,23 most of the time, the conductive thermal diffusivity is deduced from the apparent thermal diffusivity by adding correction terms linked to the effective radiative contribution.24−27 The corrective term is often treated empirically because of a lack of accurate knowledge of the optical properties of the heating sources or a possible parasitic signal. In the present study, the separation of both the effective radiative and conductive contributions from the apparent (total and measured) thermal diffusivity was based on the traditional approach from the Stefan−Boltzmann law. As both α-Na3AlF6 and γ-Al2O3 can be considered as
electrically insulating materials (the band gaps being 6.7 and 5.4 eV, respectively28), the conductive thermal diffusivity corre-sponds to the lattice one and it is thus described byeq 2. The effective radiative thermal diffusivity can be expressed as29
ρ σ κ = × Τ × a T C T n T ( ) 1 ( ) ( ) 16 3 rad. P 2 3 R (6)
where σ is the Stefan−Boltzmann constant (σ = 5.67 × 10⁻⁸ W/m2K4) and n
0is the refractive index of the medium.κRis
the Rosseland absorption coefficient, defined as
Figure 1.Optical image of the synthetic cryolite sample showing large macropores with size lying between 0.5 to 2.5 mm. The size of the sample is 51 mm× 44 mm.
∫
λ = κ π σ κ λ λ ∞ d T I T 1 4 0 1 ( ) d ( ) d R 3 BB,29whereκ is the spectral absorption coefficient and IBB is the blackbody spectral intensity in vacuo given by Planck’s law. From a practical point of view, the determination of the effective radiative contribution to the apparent thermal diffusivity required accurate values for the optical properties of the heating sources and the proportion of the parasitic signal. Instead, similar to most of the studies using experimental apparatus measuring the apparent thermal diffusivity,24−27,30 we opted for a semiempirical approach to separate both the conductive and radial contributions from the measured thermal diffusivity. The procedure is objective and consists offitting the experimental apparent thermal diffusivity signal using the following expression
ρ ψ χ = × Τ + ⎡ ⎣⎢ ⎤⎦⎥ a T C T T T ( ) 1 ( ) ( ) app. P cond. rad. 3 (7)
In these equations, both ψcond. and χrad. are two empirical
constants describing the apparent thermal diffusivity. ψcond. is
related to the conductive contribution to the apparent thermal diffusivity, whereas χrad. describes the effective radiative
contribution. Then, one can define the effective radiation-corrected thermal diffusivity as aδ(rad.)* = aapp − χ
rad.T3/(ρ·CP)
and the pure conductive contribution as acond.* = ψcond./(T·ρ·
CP).
The experimental apparent thermal diffusivity (raw exper-imental data) measured via MHM in the regular regime (above 473 K) is shown inFigure 2in comparison with thefitted curve
based on eq 7. The overall agreement is satisfactory with a maximum deviation of less than 1%. This is significantly smaller than the experimental error, estimated to be approximately 5%. The strongest deviation is observed close to 800 K, where the experimental signal shows a nonregular shape. The exper-imental measurements show that the apparent thermal diffusivity decreases at temperatures up to 650 K, and then, a plateau is observed over a range of 100 K, after which the thermal diffusivity starts to increase. This behavior with temperature reflects the domination of the conductive contribution at a low temperature (below approximately 650
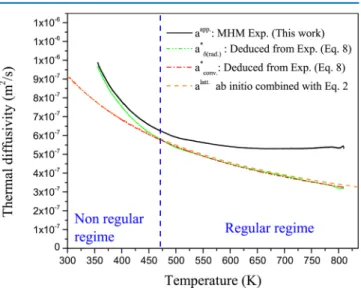
K), followed by a region where the conductive and effective radiative contributions are of similar magnitude. Next is the domination of the effective radiative contribution. In Figure 3,
the experimental apparent thermal diffusivity is represented in the entire range of temperature, that is, 300 K = T≤ 810 K in comparison with the theoretically predicted thermal diffusivity (eqs 1and2), both thermal diffusivity and the conductive terms being radiation-corrected. The application of the Garnett-Maxwell mixture model shows that the difference between the theoretical lattice thermal diffusivity of pure α-Na3AlF6and the α-Na3AlF6 + 0.9 wt %γ-Al2O3mixture is not significant. We
predict that addition of 0.9 wt % ofγ-Al2O3in cryolite increases the thermal diffusivity from 0.65% (at 300 K) to 1.1% (at 836 K). Given the discussion above, the thermal diffusivity of the porous synthetic cryolite sample can be assumed to be identical to that of the dense cryolite
≡ =
+
aNa AlFsample3 6 0.9 wt % Al O2 3( , )T P aNa AlFlatt.3 6( ,T P 0) (8) In the regular regime, both the radiation-corrected thermal diffusivity and the conductive (true) thermal diffusivity deduced from the apparent thermal diffusivity (raw experimental data) are in excellent agreement with our previous DFT predictions4 at temperatures up to 810 K, that is, very close to theα → β phase transition temperature of cryolite. Note that the excellent agreement found between DFT and the present MHM experiment results in some error cancelation in the prediction of thermal conductivity, heat capacity, and thermal expansion. The expected accuracy of the methodology used to predict the thermal diffusivity is approximately ±15%.1,2,5,6 An important point confirming the reliability of eq 7 in representing the different contributions to the apparent thermal diffusivity is that the conductive term deduced from the experimental apparent thermal diffusivity can be extrapolated into the nonregular regime region. It is also in excellent agreement with the DFT values at temperatures up to 300 K in contrast to the
radiation-Figure 2.Experimental apparent thermal diffusivity (raw experimental data) measured in this study via monotonic heating method (MHM) (solid line) in comparison with thefitted curve based oneq 7(dashed line).
Figure 3.Experimental apparent thermal diffusivity (raw experimental data) measured in this study via MHM (solid line) in comparison with (i) effective radiation-corrected thermal conductivity (dashed double-dotted line), (ii) calculated conductive contribution to the apparent thermal diffusivity (dash-dotted line) and (iii) theoretical lattice thermal diffusivity predicted ab initio by Gheribi and Chartrand4 (dashed line) via DFT calculations. The range of temperature below and beyond the regular regime is identified by a dashed vertical line on thefigure.
corrected thermal diffusivity, which strongly diverges from our prediction in the nonregular regime temperature range. This deviation is consistent with the insignificance of the effective radiative contribution to the apparent thermal diffusivity at low temperature. The semiempirical treatment used in this work to separate the conductive (true) thermal diffusivity from the apparatus measured one is thus reliable. The recommended expressions for the thermal diffusivity and the thermal conductivity of α-Na3AlF6 as a function of temperature are
those given byeqs 2 and 3, respectively, with the parameters given inTable 1.
In the range of temperature 300 K ≤ T ≤ 836 K, the recommended thermal transport properties of α-Na3AlF6
obtained in this study can be represented in their simplest form as = = + − × α‐ − K T P T T ( , 0) 10 3.50 0.95 5.39 10 Na AlF 3 5 2 3 6 (9) and = = − + α‐ − a T P T ( , 0) 10 7.18 0.38 Na AlF 4 3 6 (10)
In a recent study,10 the thermal diffusivity of several side ledge samples has been measured from 373 to 823 K using the laserflash method. For two side ledge samples SL1 and SL2, rich inα-cryolite (the exact compositions of these samples are given inTable 2) with a porosity of 13%, we compare, inFigure 4, the experimental thermal diffusivity with our recommended value of thermal diffusivity as a function of temperature given
byeq 10. The difference between the thermal diffusivity of
α-cryolite and these two side ledge samples lies in the range from 20% to 35%. This is primarily explained by the difference in the phase composition. Indeed, both samples SL1 and SL2 contain approximately 18 wt % NaF and α-alumina, with a thermal diffusivity 5 times greater1 than that of α-cryolite. It can be reasonably assumed that, given the difference in phase composition, the present experimental thermal diffusivity of α-cryolite obtained using MHM is consistent with the experimental thermal diffusivity of the side ledge rich in α-cryolite measured using the laserflash method.
■
CONCLUSIONSIn summary, in the present study, we have recorded a series of MHM measurements to determine the apparent thermal diffusivity of a porous α-Na3AlF6+ 0.9 wt %γ-Al2O3mixture from 473 to 810 K. The thermal diffusivity of this mixture is found to be almost identical to that of pure and dense α-Na3AlF6. In addition to providing a new set of experimental
data for the temperature-dependent thermal diffusivity of cryolite, which is not available in the literature, the excellent agreement found between the experiments and the calculations confirmed the reliability and the high accuracy of our DFT-based method4in predicting the thermal transport properties of various phases potentially present in the side ledge of an aluminum electrolysis cell. This study is a good example proving that usingfirst principle calculations to compensate for a lack of data, when carried out combining numerical calculations with physical principles, can lead to very good predictions, even for systems with complex phases. A positive outcome from our findings allows a partnership between industry and theoretical research. This industrial application can rely on accurate predictions, which is not always the case.
■
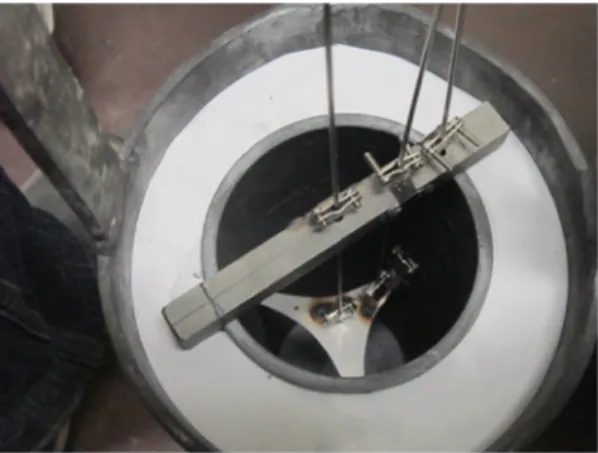
EXPERIMENTAL SECTIONSample Preparation and Characterization. The syn-thetic cryolite sample produced by the company STACA31was placed in a cylindrically shaped, grade NAC-673 graphite crucible (fabricated by Graphite Machining) with a height of 28 cm and an internal diameter of 9.8725 ± 0.0038 cm. The sample was melted in a laboratory-scale Pyradia furnace to transform the granular material to a single solid block. The crucible was protected by an Inconel shell and an argon atmosphere during the heating process. Once the cryolite was completely melted, three N-type thermocouples, eachfixed at two points to a homemade stainless steel structure, were inserted into the liquid. The graphite crucible with the Inconel shell and the thermocouple-holding structure, before the melting of the synthetic cryolite, is shown in Figure 5. The holding structure assured exact positions for the thermocou-ples. One thermocouple (T1) was put at the center (rotational axes of the cylindrically shaped sample), the second (T3) was close to the outer face, and the third one (T2) was half way between T1 and T3. This arrangement resulted in a distance of 4.826 cm between T1 and T3 and 2.459 cm between T1 and Table 2. Phase Compositions (in wt %) of Two Side Ledge Samples, SL1 and SL2, Recovered from Postmortem Industrial Electrolysis Cells10and Rich inα-Cryolitea
α-Na3AlF6 Na5Al3F14 CaF2 α-Al2O3 NaAl11O17 NaF γ-Al2O3 γ′-Al2O3
SL1 74.9 0.4 4.8 2.8 1.8 14.7 0 0.5
SL2 76.3 0.3 3.6 3.0 0.9 15.4 0 0.4
aThe porosity of both samples is 13%.
Figure 4.Experimental apparent thermal diffusivity of two side ledge samples (SL1 and SL2) recovered from postmortem industrial electrolysis cells10in comparison with the theoretical predictions (eq 10). The chemical compositions of the two samples are given inTable 2, and their porosity is 13%.
T2. All thermocouples were positioned 13 cm above the bottom of the resolidified sample, which had a total height of 26 cm. Once the cryolite was cooled to room temperature, it was removed from the graphite crucible and transferred into a 1.54 mm thick stainless steel shell for the thermal diffusivity measurement (see further).
The purity of the sample was determined using X-ray diffraction (XRD). XRD analysis was carried out at room temperature (∼293 K), using a Panalytical X’Pert diffractom-eter, equipped with copper tubes and a fast detector (PIXEL model). The XRD data were then refined using the Rietveld method. The Rietveld method uses a least-squares approach to refine a theoretical line profile (representing the assumed compounds) until it matches the measured profile. More details about this technique can be found in the work of Cox.32The XRD analysis revealed that the sample contained 99.1 wt % α-cryolite (α-Na3AlF6) crystallizing in a monoclinic structure
(P21/n) and 0.9 wt % γ-alumina (γ-Al2O3) crystallizing in a tetragonal structure (Fd3̅m). The density of the sample was measured at room temperature by weighing a sample cut to a cuboid shape (51.9± 0.05 mm × 42.3 ± 0.1 mm × 44.1 ± 0.05 mm) with a SARTORIUS CPA 1003S balance of a precision of ±0.001 g. The measured mass was 187.965 g, resulting in a density of 1.941± 0.04 g/cm3. The porosity of the sample was
deduced from the ratio between the experimental and theoretical density. The theoretical density of the sample was calculated to be 2.892 g/cm3 by assuming additivity of the molar volumes (the densities of Na3AlF6and Al2O3are given in
Table 1). Thus, the theoretical porosity was estimated to be 32.9%. The porosity was then assumed to be independent of temperature.
Thermal Diffusivity Measurement. The MHM was used in this work for the measurement of the thermal diffusivity. MHM is well-known and well-documented.33MHM assumes that if the heating rate on a cylindrical solid surface is constant, after an initial transient period, the heating rate inside of the solid is homogeneously similar to what is found on the surface. In this so-called regular regime of the second kind, the spatial temperature distribution at subsequent stages of the heating remains similar; it is only shifted upward. In principle, if the value of the heatflux entering the sample is known, both the heat capacity at constant pressure (CP) and the thermal diffusivity (a) of the sample can be determined by measuring the temperature histories between two points separated by a given distance. The achievement of boundary conditions of the
second kind with a constant heatflux is, from a practical point of view, difficult to ascertain. Instead, it is technically easier to impose a constant heating rate on the surface using electrical heaters with a closed-loop control. The thermal diffusivity is then defined from the temperature histories according to the following relationship33,34 = Δ a D t 16 2 (11)
where D is the outer diameter of the sample and t is the time of travel of an isotherm from the outer surface to the center of the sample. MHM tests were carried out in an apparatus developed at GRIPS-UQAC,34under an argon atmosphere. No reference core was used; consequently, CP could not be measured. To ensure unidirectional heat flow in the radial direction, the height of the sample was chosen to be more than 3 times its diameter. To reduce end effects, a three-zone furnace was used. The central zone was used to measure the thermal diffusivity, whereas the top and bottom parts have the role of assuring the same temperature as that in the central zone, using independently controlled heating elements. This way, any temperature gradient in the axial direction is eliminated. The top and the bottom of the furnace were insulated using refractory bricks and wool. The external insulation of the furnace eliminated the axial heatflux, and thus, only the radial heat transfer was maintained. The optimal heating rate depends on the thermal diffusivity of the sample and must be determined using preliminary tests. A heating rate too slow or too rapid results in very small or very large temperature differences between the surface and the center. This makes the evaluation of the results possibly inaccurate. Furthermore, a heating rate that is too low increases significantly the duration of the tests and the argon consumption. MHM tests were carried out between 298 and 831 K with a heating rate of 1 K/ min, which led to a radial temperature difference of approximately 20 K between the center and the outer face. Before thefirst test, the sample was heated to 573 K and cooled to room temperature, to eliminate possible moisture content. In the temperature range where the phase transition occurs, the heat release associated with the transition makes the measure-ment of the thermal diffusivity using MHM meaningless near this temperature. In the present case, at approximately 836 K, cryolite undergoes a structural transformation from monoclinic (α-Na3AlF6, space group: P21/n) to an elpasolite (cubic) structure (β-Na3AlF6, space group: Fm3̅m).35 The thermal
diffusivity of β-Na3AlF6was thus not measurable using MHM. For this reason, we have limited the temperature range to a few degrees below the theoretical α → β phase transition temperature.
■
AUTHOR INFORMATIONCorresponding Author
*E-mail:[email protected]. Phone: +1 (514) 340-4711 ext. (2316). Fax: +1 (514) 340-5840 (A.E.G.).
ORCID
Aïmen E. Gheribi: 0000-0002-5443-2277 Author Contributions
All authors contributed equally to this work. Notes
The authors declare no competingfinancial interest.
Figure 5.View of the graphite crucible with the Inconel shell and the thermocouple-holding structure before the melting of the synthetic cryolite.
■
ACKNOWLEDGMENTSThis research was supported by funds from the Natural Sciences and Engineering Research Council of Canada (NSERC) and Rio Tinto Alcan. The computations were made on the supercomputer Briaré at the Université de Montréal, managed by Calcul-Québec and Compute Canada. The operation of this supercomputer is funded by the Canada Foundation for Innovation (CFI), NanoQuébec, RMGA and the Fonds de recherche du QuébecNature et technologies (FRQ-NT). We would like to thank Eve Belisle and James Sangster for their help in writing the manuscript.
■
REFERENCES(1) Gheribi, A. E.; Chartrand, P. Application of the CALPHAD method to predict the thermal conductivity in dielectric and semiconductor crystals. CALPHAD: Comput. Coupling Phase Diagrams Thermochem. 2012, 39, 70−79.
(2) Gheribi, A. E.; Seifitokaldani, A.; Wu, P.; Chartrand, P. An ab initio method for the prediction of the lattice thermal transport properties of oxide systems: Case study of Li2O and K2O. J. Appl. Phys. 2015, 118, 145101.
(3) Gheribi, A. E.; Poncsák, S.; St-Pierre, R.; Kiss, L. I.; Chartrand, P. Thermal conductivity of halide solid solutions: Measurement and prediction. J. Chem. Phys. 2014, 141, 104508.
(4) Gheribi, A. E.; Chartrand, P. Thermal conductivity of the side ledge in aluminium electrolysis cells: Compounds as a function of temperature and grain size. 2016, arXiv:1609.08023.
(5) Gheribi, A. E.; Salanne, M.; Chartrand, P. Thermal transport properties of halide solid solutions: Experiments vs equilibrium molecular dynamics. J. Chem. Phys. 2015, 142, 124109.
(6) Gheribi, A. E.; Salanne, M.; Chartrand, P. Formulation of Temperature-Dependent Thermal Conductivity of NaF, β-Na3AlF6, Na5Al3F14, and Molten Na3AlF6Supported by Equilibrium Molecular Dynamics and Density Functional Theory. J. Phys. Chem. C 2016, 120, 22873−22886.
(7) Gheribi, A. E.; Chartrand, P. Thermal conductivity of molten salt mixtures: Theoretical model supported by equilibrium molecular dynamics simulations. J. Chem. Phys. 2016, 144, 084506.
(8) Gheribi, A. E.; Torres, J. A.; Chartrand, P. Recommended values for the thermal conductivity of molten salts between the melting and boiling points. Sol. Energy Mater. Sol. Cells 2014, 126, 11−25.
(9) Gheribi, A. E.; Corradini, D.; Dewan, L.; Chartrand, P.; Simon, C.; Madden, P. A.; Salanne, M. Prediction of the thermophysical properties of molten salt fast reactor fuel from first-principles. Mol. Phys. 2014, 112, 1305−1312.
(10) Gheribi, A. E.; Poncsák, S.; Guérard, S.; Bilodeau, J.-F.; Kiss, L.; Chartrand, P. Thermal conductivity of the sideledge in aluminium electrolysis cells: Experiments and numerical modelling. J. Chem. Phys. 2017, 146, 114701.
(11) Landauer, R. The Electrical Resistance of Binary Metallic Mixtures. J. Appl. Phys. 1952, 23, 779−784.
(12) Callaway, J. Model for Lattice Thermal Conductivity at Low Temperatures. Phys. Rev. 1959, 113, 1046−1051.
(13) Slack, G. A.; Galginaitis, S. Thermal Conductivity and Phonon Scattering by Magnetic Impurities in CdTe. Phys. Rev. 1964, 133, A253−A268.
(14) Slack, G. A. Nonmetallic crystals with high thermal conductivity. J. Phys. Chem. Solids 1973, 34, 321−335.
(15) Seifitokaldani, A.; Gheribi, A. E. Thermodynamically self-consistent method to predict thermophysical properties of ionic oxides. Comput. Mater. Sci. 2015, 108, 17−26.
(16) Seifitokaldani, A.; Gheribi, A. E.; Dollé, M.; Chartrand, P. Thermophysical properties of titanium and vanadium nitrides: Thermodynamically self-consistent approach coupled with density functional theory. J. Alloys Compd. 2016, 662, 240−251.
(17) Gheribi, A. E.; Gardarein, J.-L.; Rigollet, F.; Chartrand, P. Evidence of second order transition induced by the porosity in the thermal conductivity of sintered metals. APL Mater. 2014, 2, 076105. (18) Gheribi, A. E.; Gardarein, J.-L.; Autissier, E.; Rigollet, F.; Richou, M.; Chartrand, P. Experimental study of the thermal conductivity of sintered tungsten: Evidence of a critical behaviour with porosity. Appl. Phys. Lett. 2015, 107, 094102.
(19) Gheribi, A. E.; Autissier, E.; Gardarein, J.-L.; Richou, M. Thermal transport properties of multiphase sintered metals micro-structures. The copper-tungsten system: Experiments and modeling. J. Appl. Phys. 2016, 119, 145104.
(20) Sumirat, I.; Ando, Y.; Shimamura, S. Theoretical consideration of the effect of porosity on thermal conductivity of porous materials. J. Porous Mater. 2006, 13, 439−443.
(21) Francl, J.; Kingery, W. D. Thermal Conductivity: IX, Experimental Investigation of Effect of Porosity on Thermal Conductivity. J. Am. Ceram. Soc. 1954, 37, 99−107.
(22) Gheribi, A. E.; Chartrand, P. Effect of Grain Boundaries on the Lattice Thermal Transport Properties of Insulating Materials: A Predictive Model. J. Am. Ceram. Soc. 2015, 98, 888−897.
(23) Locatelli, M.; Lopez, J.; Nunez-Regueiro, M. Thermal radiation effects in thermal conductivity measurements: analysis and remedies. J. Phys. D: Appl. Phys. 1983, 16, 479−487.
(24) Gałązka, K.; Populoh, S.; Xie, W.; Hulliger, J.; Weidenkaff, A. Radiative heat losses in thermal conductivity measurements: A correction for linear temperature gradients. Measurement 2016, 90, 187−191.
(25) Borup, K. A.; de Boor, J.; Wang, H.; Drymiotis, F.; Gascoin, F.; Shi, X.; Chen, L.; Fedorov, M. I.; Müller, E.; Iversen, B. B.; et al. Measuring thermoelectric transport properties of materials. Energy Environ. Sci. 2015, 8, 423−435.
(26) Litovsky, E.; Kleiman, J. I.; Menn, N. Measurement and analysis by different methods of apparent radiative and conductive thermophysical properties of insulation materials. High Temp.High Pressures 2003, 35/36, 101−108.
(27) Finefrock, S. W.; Wang, Y.; Ferguson, J. B.; Ward, J. V.; Fang, H.; Pfluger, J. E.; Dudis, D. S.; Ruan, X.; Wu, Y. Measurement of Thermal Conductivity of PbTe Nanocrystal Coated Glass Fibers by the 3ω Method. Nano Lett. 2013, 13, 5006−5012.
(28) Jain, A.; Ong, S. P.; Hautier, G.; Chen, W.; Richards, W. D.; Dacek, S.; Cholia, S.; Gunter, D.; Skinner, D.; Ceder, G.; et al. Commentary: The Materials Project: A materials genome approach to accelerating materials innovation. APL Mater. 2013, 1, 011002.
(29) Modest, M. F. In Radiative Heat Transfer (Third Edition), 3rd ed.; Academic Press: Boston, 2013; pp 1−30.
(30) Clark, L. M., III; Taylor, R. E. Radiation loss in the flash method for thermal diffusivity. J. Appl. Phys. 1975, 46, 714−719.
(31) STACA Inc.http://www.imes.ca/(2016).
(32) Cox, D. E. The Rietveld method. (IUCr Monograph on Crystallography, No. 5) edited by R. A. Young. J. Appl. Crystallogr. 1994, 27, 440−441.
(33) Platunov, E. S. In Compendium of Thermophysical Property Measurement Methods: Volume 2 Recommended Measurement Techniques and Practices; Maglić, K. D., Cezairliyan, A., Peletsky, V. E., Eds.; Springer US: Boston, MA, 1992; pp 347−373.
(34) Kiss, L.; Chen, W. In Proceedings of TEMPMEKO’99: The 7th International Symposium on Temperature and Thermal Measurements in Industry and Science; Fagerberg, J., Mowery, D. C., Nelson, R. R., Eds.; NMi Van Swinden Laboratorium: Delft, The Netherlands, 1−3 June, 1999; Chapter 2, pp 481−487.
(35) Chartrand, P.; Pelton, A. D. A predictive thermodynamic model for the Al-NaF-AlF3-CaF2-Al2O3system. Light Met. 2002, 245−252.