www.nature.com/scientificreports
Selection of high affinity
aptamer-ligand for dexamethasone and its
electrochemical biosensor
Somia Mehennaoui, Sujittra Poorahong, Gaston Contreras Jimenez & Mohamed siaj
A high specificity aptamer-ligand biorecognition and binding system to monitor of dexamethasone (DXN) was developed. The detection principle was based on a label-free electrochemical aptasensor. The selection of the aptamer was successfully performed by the systematic evolution of ligands through exponential enrichment technique (SELEX). From a random library of 1.08 × 10¹⁵ single-stranded DNA, an aptamer designated as DEX04 showed a highest affinity with a dissociation constant of 18.35 nM. It also showed a good conformational change when binding with DXN. In addition, the aptamer DEX04 did not show any cross-reactivity with other commonly used hormones. An impedimetric aptasensor for DXN was then developed by immobilizing DEX04 on a gold electrode. The binding upon to DXN was monitored by following the change in the charge transfer resistance (Rct) of the [Fe(CN)6]4−/3− redox couple. The aptasensor exhibited a linear range from 2.5 to 100 nM with a detection limit of 2.12 nM. When applied aptasensor to test in water samples, it showed good recovery percentages. The new DXN aptamer can be employed in other biosensing applications for food control and the diagnosis of some diseases in medicine as a cost-effective, sensitive and rapid detection method.Dexamethasone (DXN) is a synthetic hormone belonging to the group of corticosteroids. It is mainly used as an anti-inflammatory, anti-allergic and immunosuppressive agent in many medical applications1. Often, it was used
as a growth promoting agent to increase the body mass2. The residues of DXN in meat and other animal
prod-ucts i.e., milk can be harmful to humans and animals3,4. With high concentrations, DXN can affect the nervous,
endocrine and digestive systems of animals5. In addition, previous studies have shown that DXN can negatively
influence fertility and ovarian function like chronic an ovulation and polycystic ovarian syndrome6–8. Based on
animal studied It is classified as 1B category (presumed human reproductive toxicant). The upper dose should not more than 1,000 mg/kg by oral take9. Therefore, accurate monitoring of the existence and the concentration of
DXN in environmental and clinical samples is very important. The concentrations of DXN in real samples were found from sub nanomolar to micromolar range with different matrices1,10,11. Thus, the development of a rapid
and sensitive detection method for the identification of DXN is required.
Although, the immunological techniques, instrumental analytical approaches are generally costly, time-consuming and require highly qualified personnel, making them unsuitable for field applications12,13. To
overcome these limitations, several studies have been devoted to the development of new and simple detection techniques. The biosensors have recently sparked considerable interest in a variety of biomedical and environ-mental applications and have emerged as an interesting alternative to conventional analytical and immunological assays. Recently, a photoelectrochemical immunosensor based on competitive strategy has been proposed for the detection of DXN14. Despite, their ease to use and sensitive detection, immunosensors are subject to a major
challenge, precisely the use of antibodies as bioreceptor. Competitive immunoassays need additional steps and rely on enzymes for antibodies labeling. Furthermore, antibodies that target similar molecules are usually sub-ject to cross-reactivity and thus require special storage and handling conditions. For that, aptasensors appeared as a good alternative to immunosensors because of their simple detection strategies15. Since their discovery in
199016,17, aptamers offered many advantages, including in-vitro selection even for small molecules18, viruses19 and
proteins20. They are also relatively easy to synthesize and modulate at low cost, highly stable at different storage
conditions and transportation in ambient temperature.
Therefore, in this work we report a high affinity aptamer against DXN. The SELEX approach was employed for aptamer selection from a random library of 1.08 × 10¹⁵ single-stranded DNA. Herein we present the first report
Department of Chemistry, Université du Québec à Montréal, Montréal, Québec, H3C 3P8, Canada. Correspondence and requests for materials should be addressed to M.S. (email: siaj.mohamed@uqam.ca)
Received: 5 June 2018 Accepted: 2 April 2019 Published: xx xx xxxx
for selected aptamer for DXN detection with the highest affinity and good characterization results. In addition, the selected aptamer was integrated into a novel and simple label-free impedimetric platform based on gold electrodes. This novel aptasensor offers simple, low cost and highly stable detection method that can be used by unqualified personnel replacing currently sophisticated immunoassays and analytical methods.
Results and Discussion
In vitro selection of DNA aptamers for DXN.
Screening several aptamers that recognize DXN with a high affinity and specificity from a vast random library consisting of 1.08 × 10¹⁵ different ssDNA is a challenging task. To the best of our knowledge, no other aptamer-based biosensors were developed for the detection of DXN. In order to generate affinity complexes, the ssDNA pools were first incubated with DXN sepharose 6β beads. The process was carried out through 19 cycles of selection. Each SELEX round was controlled by measuring the percentage of eluted ssDNA (bound ssDNA) with respect to the initial concentration of the ssDNA quantified by fluorescence. As illustrated in Fig. 1, a low recovery percentage of ssDNA was observed in the first five cycles. This may be due to the low concentration of the used analytes or due to a low specifically bound aptamer to the DXN. Therefore, a negative selection (NS) was carried out using blank sepharose 6β beads in order to eliminate the non-specifically bound aptamers from the beads matrix. Hence, a significant increase in the recovery was detected in the next selection cycles. These also confirmed the important role of the counter or negative selection. In order to improve the selection accuracy and only keep the most specific DNA for free DXN, a second negative selection was performed before the tenth cycle. It was observed that a high amount of ssDNA was retained onto the blank beads, and a low amount of ssDNA, which expected to be a high specific binding to the analyte was obtained. In addition, a considerable rise in the ssDNA recovery was found in the next cycle, which indicates the specificity of this washed ssDNA for DXN. In order to retain the best affinity aptamers, therefore, after the 12th cycle, the concentration of analyte was reduced. This makes the 13th cycle shows low recovery. At the 19th cycle, after reaching a plateau with a significant enrichment of DXN binding DNA, the ssDNA pool was cloned and sequenced.Characterization of selected aptamers.
Ten positive white colonies were obtained after cloning pro-cesses. Among them only six colonies were obtained well-defined sequence. A significant consensus region of nucleotides was observed between the sequences belonging to the same group or family. These can be aligned into three families (A, B and C) as shown in Table 1 and all sequences were then characterized.After sequencing, the affinity binding by fluorescence assay was determined. The binding curves of all aptam-ers are shown in Fig. 2A. The dissociation constant values were then calculated using nonlinear regression. Only Figure 1. Selection of DXN aptamers; ssDNA recovery from each SELEX cycle and the resulting enrichment plateau. Negative selection (NS) performed by using blank beads.
Family Name Aptamer structure 5′ to 3′ KD (nM)
A DEX01 ACACCCCACGTAGTGTCACAGCACGCTTATAGTAAGTGAAGTGACGGGTTGCTGATGTG 15.71 DEX03 ACGCGTAGGGATGTGTAAGGTCTGTACACCTCGGTTTACTCTATGCTTCGCATATTGTCG 72.83 B DEX04 ACACGACGAGGGACGAGGAGTACTTGCCAACGATAACGTCGTTGGATCTGTCTGTGCCC 18.35 DEX10 GGACAGCTGGCCGCGAAGCGAGACACGTATAAGGTACTATACGGCTGGCATATGTATCTG 715 C DEX05 ACAGGCTTGGATTAGTGTATCCAACTAGTATCGTGTATACTAGGCCCTTGCTACCCTGTG NB DEX06 ACACACGAAACACAAGCAGTGAGACTGCCTACGTCCGTAGTTGTGTTGAGTTTGCTCTCC NB
www.nature.com/scientificreports
www.nature.com/scientificreports/
four aptamers provided a good affinity to DXN in a low nanomolar level with KD ranging from 15 to 715 nM (Table 1). This is suggesting a strong affinity binding between aptamer and DXN occurred. Whereas the two aptamers, i.e., DEX05 and DEX06 did not exhibit binding against DXN. The four aptamers which provided the affinity binding to DXN were then studied the conformation changes in the structure before and after binding to DXN by circular dichroism (CD) spectroscopy. From our results, DEX04 shows the most significant change in ellipticity as shown in Fig. 2B. In contrast, the other three aptamers; DEX01, DEX03 and DEX10, did not show a significant ellipticity change as shown in Fig. S1. In detail, the CD spectrum of the free DEX04 aptamer has a pos-itive peak at 271 nm and a negative peak at 244.5 nm (Black line), which is a duplex type characteristic. Following the binding and biorecognition of the DEX04 aptamer to DXN, a significant change of ellipticity at 271 nm and 245.5 nm was observed (red line). This indicates the folding of the aptamer into other conformations following its contact with the molecule of DXN, which contains chiral atoms and could divert polarized light circularly.
Then the specificity of DNX aptamer, cross-reactivity assays with progesterone (P4), norethisterone (NET) and estradiol (E2) hormones which are DXN’s analogs and can present in the same environmental samples was studied. As shown in Figs 2C and S3, the DEX04 indicates the highest selectivity to DXN against P4, NET and E2 hormones. Anti-DXN aptamers have been further investigated by studying their secondary structures. As depicted in Fig. S3, all aptamer sequences exhibited formation of characteristics of stem-loop shape. Those struc-tures showed good binding affinity with DXN as confirmed the presence of correspondences and differences. Structural similarities are observed which is consistent with aptamer recognition of the target conformation. From all characterization results, DXN 04 provided the best performance, in terms of good KD, specificity and change in conformation. Hence, it was chosen for further biosensor applications.
Electrochemical Aptasensor of DXN Detection.
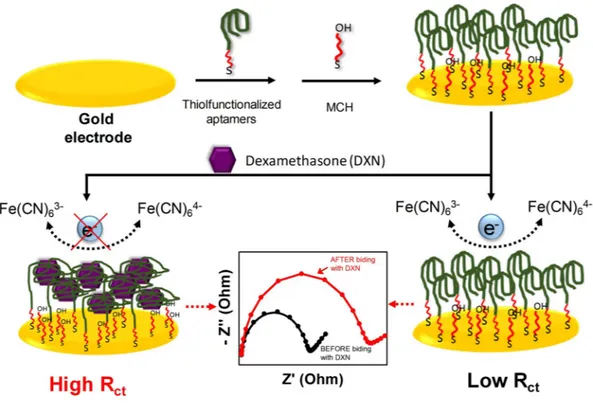
For the DXN aptasensor, the DEX04 aptamer sequence (5′-ACA CGA CGA GGG ACG AGG AGT ACT TGC CAA CGA TAA CGT CGT TGG ATC TGT CTG TGC CC-3′), which revealed a significant conformation change in the CD measurement and provided a low KD value of 18.35 nM by fluorescence, was employed. Figure 3 demonstrates the different steps to fabricate the DXN aptasensor. First, the disulfide-modified aptamer (HOC6-S-S-C6-DEX04) was immobilized on a gold surface by self-assembly and the free gold surfaces were blocked using MCH in order to minimize the nonspecific adsorption of the aptamers and ensure that the aptamer binds only from the sulfide side. Atomic force micros-copy (AFM) was used to characterize the morphology of the gold electrodes surface before and after the aptamer immobilization (Fig. 4). A comparison between the AFM images of bare and modified electrode shows clearly the aptamer immobilization. The formation of a complete aptamer monolayer on top of the gold electrode induces a significant decrease in the roughness of the electrode. Before the aptamer immobilization, the bare gold elec-trode showed a roughness value of 7 nm compared to 4 nm the chemisorbed DEX on the elecelec-trode surface. In addition, the resulting modified electrodes have been characterized by X-ray photoelectron spectroscopy (XPS) and Attenuated total reflection-Fourier transform infrared (ATR-FTIR). Compared to bare gold electrode, the high-resolution XPS spectra of sulfur (S) for modified electrodes showed a S 2p peak at 162.4 eV. This peak is attributed to a Au-S bond indicating that the chemical grafting of the thiol-modified aptamer to the gold surface was successful21 (Fig. S4). However, from the ATR-FTIR data we can conclude that we have the ssDNA attachedto the electrode surface22,23 (Fig. S5). All the steps of the fabrication of the aptasensor were controlled by EIS and
CV measurements. As shown in Fig. 5A, the characteristic ferricyanide redox peaks resulting from the bare gold electrodes declined gradually after being exposed to MCH, free DEX04 aptamer and DEX04 bound to DXN. As anticipated, the bare gold electrode showed a quasi-reversible voltammogram of the ferricyanide redox couple with a peak separation ΔEp of 120 mV (black curve). After modification with MCH (red curve), the electrochem-ical reaction is blocked on Au electrode surface, which leads to an increase in the peak separation and a substan-tial decrease in the peak current. Once the Au electrode incubated with the aptamer and followed by MCH (blue curve), a higher degree of decreasing in the electron transfer charge between the redox couple and the electrode Figure 2. (A) Binding saturation curve of all aptamers with DXN beads determined by the fluorescence assay, by plotting the concentration of the complex formed by the binding between ssDNA aptamer and DXN analyte ([ssDNA−DXN]) as a function of unbound ssDNA concentration. (B) Circular dichroism spectra of 3 μM of the DEX04 before (Black line) and after recognition of 3 μM DXN (Red line). (C) Cross-reactivity study of the DEX04 aptamer to progesterone (P4), norethisterone (NET) and 17β-estradiol (E2).
were observed compared to Au electrode modified with MCH only. This could be affected by the generation of a negatively charged DNA that rejects the [Fe(CN)6]4−/3− anions and retards the interfacial kinetics of the redox couple at the Au interface. Thus, this is indicating the successful attachment of the aptamer on the gold surface. Moreover, the peak current reflects an additional decrease of the electron-transfer rate after incubation with 100 nM DXN (green curve), confirming the success of binding between DXN and the aptasensor.
Likewise, ESIs for each step of the electrode modifying in 10 mM [Fe(CN)6]4−/3− solution as probe redox were recorded (Fig. 5B). Impedance measurements were represented by Nyquist plots. These plots consist of a part forming semicircles at high frequencies corresponding to electron transfer and a straight line at very low Figure 3. Impedimetric mechanism of aptasensor.
www.nature.com/scientificreports
www.nature.com/scientificreports/
frequencies representing the diffusion processes. The quantification of the semicircle diameter can be fitted with the Randles-modified equivalent circuit or the electron transfer resistance (Ret) of the modified electrode sur-faces. The obtained ESIs data corroborate the preceding results obtained by CV. More specifically, the EIS cor-responding to the bare gold electrode presents a small semicircle diameter (black curve) indicating the rapid electron transfer and diffusion limiting processes on the bare gold electrode surface. After incubating with MCH, a preventing of the electrochemical reaction occurred, an increase in the charge transfer resistance (Rct) was noticed. After immersing the gold electrode in the disulfide-modified aptamer and followed by MCH blocking, a significant increase in the diameter of the semicircle was observed indicating the increase in the Rct caused by the assembly of a negatively charged disulfide DNA which repels the [Fe(CN)6]4−/3− anions of the redox couple on the electrode surface, which confirms the success of the self-assembly. We notice a significant increase in Rct (7810 Ω) after incubating the aptasensor with 50 nM of DXN. This Rct change may be resulting from the con-formation changes of the aptamer upon binding to DXN, which leads to more shielding of the Au surface and more retardation for the [Fe(CN)6]4−/3− anions accessibility to the surface electrode. When DXN concentration increased to 100 nM, a further small increase in Rct was observed. Both of CV and EIS results confirm that the sensing interface is achieved successfully.
The incubation time is a crucial factor, which could affect the performance of the aptasensor in DXN recog-nition. The incubation time was studied by incubating the DEX04 aptamer immobilized on Au electrode with 50 nM DXN at various duration. To evaluate the aptasensor’s response, we used the percentage change in the Rct before and after binding to DXN. As shown in Fig. 6A, the aptasensor’s response increased by increasing the incubation time from 10 to 100 min. A slight increase in the sensor’s response was also observed from 100 to 240 min, indicating the saturation of the aptamer modified electrode. Consequently, the aptasensor was incubated for 120 min in all future experiments. The incubation time of our sensor is longer than the immunosensor maybe because in immunosensor system the anti-dexamethasone is incubated on TiO2 nanoparticles14. These nanopar-ticles have a larger surface area than our gold base electrode. It supports the dexamethasone easily to excess to the anti-dexamethasone bead.
The selectivity of the DXN aptasensor was studied in the presence of other hormone analogs to DXN. To achieve this, 1 nM of DXN, P4, NET, E2, binding buffer and their mixture were tested. Figure 6B presents the bar chart of the sensor’s response of (R0 − R)/R0, which demonstrates the high response obtained with the DXN and the mixtures compared to the nonsignificant changes in the case of the other components introduced, thus indi-cating the selectivity and the specificity of the developed aptasensor to DXN. The calibration curves of DXN were then constructed by monitoring the sensor’s response (Fig. 6C). Then the calibration curves of DXN were then constructed (Fig. 6D). Compared with different detection methods (see Table 2), the developed aptasensor exhib-ited excellent analytical performance with a wide linear range of 2.5 to 100 nM and low detection limit at 2.12 nM, calculated by IUPAC method24. The error bars represent the standard deviation SD of the three measurements.
Application of DXN aptasensor in real simples.
To evaluate the performance of the developed aptasen-sor for the detection of DXN in real samples, series of experiments have been carried out using tap water, drinking fountain water and ultrapure water with three different concentrations of DXN varying from 0 nM, 50 nM and 100 nM. Table 3 presents the results obtained for each sample. The negative water samples in binding buffer did not exhibit any significant signal. Good percentages of recovery ranging from 81.5% to 103.2% were obtained indicating no effect of interference from water components on the aptasensor’s detection mechanism. The relative Figure 5. (A) Cyclic voltammograms and (B) impedance spectra (Nyquist plots) of 10 mM [Fe(CN)6]4−/3− in PBS, pH 7.4, for bare Au electrode, Au/MCH, Au/MCH/DEX04 before and after recognition to 50 nM and 100 nM DXN. The inset is the equivalent circuit used for the impedance data fitting; Rs is the solution resistance between working and reference electrodes, Zw is Warburg impedance; Cdl is the double layer capacitance and Rct is the charge-transfer resistance.differences are between 2.2% and 11.5%. These shown an acceptable recovery rate in levels of ng/mL is between 40 and 120% and the RSD could be 30% to 45%24. Thus, it can be concluded that recoveries for all concentrations
of DXN in the studied samples are in the acceptable range. Finally, these results approved the actual application and the possible use of the impedimetric aptasensor in environmental analysis.
Figure 6. (A) Effect of the DXN incubation time on aptasensor’s response for 50 nM DXN, (B) The cross reactivity of the DXN aptasensor against binding buffer (BB), 1 nM of DXN, P4, NET, E2 and their mixture, (C) Examples of Nyquist plots measurements in 10 mM [Fe(CN)6]4−/3− of the aptasensor in different concentrations of DXN analyte (0, 1, 10, 20, 30, 50, 75, 100, 150, 200 and 300 nM). (D) Calibration curve of the aptasensor plotted with a regression coefficient r2 = 0.99.
Method Linear dynamic range LOD Applications/Comment Ref.
Label-free electrochemical aptasensor 2.5–100 nM 2.12 nM Applied to tab water and drinking water, recovery = 81.5–103.2% This work reverse-phase high-performance liquid
chromatography with diode array
detection Not report
water = 6 ng/mL Feed = 190 ng/g
Applied to water and feed for meat-producing animals: recovery = 99.4 ± 1.3%
Flumethasone was used as internal standard
3
Electrochemical sensor based Fe3O4/
PANI–CuII microsphere 0.05 to 30 mM 3.0 nM
Applied to human urine and serum samples
Recovery = 97.0–102.0%
11
high-performance liquid chromatography
with diode array detection Not report 10 ng/mL Applied to human plasma with recovery = 96.96% to 106.07% 27 Hanging mercury drop electrode 25.5–122.3 µM 7.6 µM Applied to drug sample; recovery = 99.8–100% 28
square-wave adsorptive voltammetry 0.0498–0.61 µM 2.54 nM Applied to eye drops, injectable, elixir; recovery = 94.14–112.41% 29
www.nature.com/scientificreports
www.nature.com/scientificreports/
Conclusion
In this work, we have selected, identified and characterized the first aptamer with a high affinity and specificity to dexamethasone, a widely used hormone with low molecular weight (392.46 Da). The developed aptamer DEX04 presented a dissociation constant in the range of nanomolar range and demonstrated a significant change in its conformation before and after DXN recognition as shown by circular dichroism spectroscopy. The DEX04 aptamer was then integrated to design a label-free impedance based aptasensor. The aptasensor had a low LOD of 2.12 nM with a wide linear range of 2.5 nM to 100 nM and a good yield in the range of 81.5 to 103.2% as demonstrated by the application performed on different water samples. Other applications for the selected DXN aptasensor in meat, milk and some clinical samples will be studied in the future.
Experimental Section
Materials and reagents.
The materials and reagents used for the selection, characterization of the aptamer and the development of the DXN aptasensor are cited in the supplementary information section.In Vitro Selection of DXN aptamers.
The selection of aptamers was done through the SELEX pro-cess in which DXN conjugated sepharose 6β beads were exposed to the ssDNA library. This study, a ran-dom library containing 1.08 × 10¹⁵ oligonucleotides was designed. It is composed of a principal randomized part of 60 nucleotides connected by two constant primer-hybridization sites at the 3′ and 5′ extremities (5′-ATATCATATGCTCCAATT-N60-ATATTACACTTGCGATCT-3′). The primers were labeled with fluores-cein in order to determine the recovered ssDNA and hexaethylene glycol (HEGL) linker to inhibit the polymer-ase prolongation. Five successive steps were accomplished for each aptamer selection and amplification cycle as shown in Fig. S6. Specifically, a 100 pmol ssDNA pool (1.794 nmol at the first cycle), measured by UV spec-trophotometer was pretreated by heating at 90 °C for 5 min followed by renatured at 4 °C for 10 min. Then the mixture was left at ambient temperature for 5 min before adding 50 μL for the first cycle (100 μL for the second round and beyond) of prewashed DXN sepharose 6β beads in 400 μL binding buffer in a centrifuge filter tube. The solution was then incubated for 2 hours at room temperature. After incubation, the beads were washed sev-eral times with the binding buffer until no ssDNA is detected by fluorospectrometer (Nano Drop 3300, Fisher Scientific, Canada). The ssDNA aptamers bound to DXN sepharose beads were then eluted 6 times with 250 µL of elution buffer and heated at 90 °C for 10 minutes. Each eluting time, the elution was measured by fluorospec-trometer until no DNA is detected. Eluted ssDNA was then concentrated and desalted by ultrafiltration using a 3 kDa cut off membrane.The eluted DNA was amplified by Polymerase Chain Reaction (PCR). PCR products were concentrated by Speed Vac and re-suspended in 50:50 v/v of water:formamide and later heated at 55 °C for 5 min. The fluorescein labeled DNA was then isolated from the double-stranded PCR product by loading into 12% denaturing poly-acrylamide gel electrophoresis (PAGE). Then it was eluted from the gel band through freeze thaw cycle. Eluted ssDNA from in the TE buffer (10 mM Tris pH 7.4, 1 mM EDTA) was concentrated by the ultrafiltration and then quantified by UV to be used for the next selection round. During SELEX cycles, two negative selection rounds were performed before the 6th and 10th cycles. This is carried out by incubating the DNA pool with blank sepha-rose beads. In this counter selection step, washed ssDNA were collected and exposed to the same pre-treatment mentioned previously.
Cloning and sequencing of selected DNA.
The selected ssDNA from the latest SELEX round were amplified by PCR using non-labeled primers. Afterwards, the DNA was cloned into pCR2.1-TOPO vector with the TOPO TA Cloning Kit (Invitrogen) using the competent cells E. coli. The bacteria that contained the plasmids were then cultured on petri dishes containing LB-agar medium enriched with 200 μL of ampicillin (20 mg/mL) and 100 μL of IPTGX-GAL. Positive white clones which contain a single sequence of ssDNA inserted into their plasmid were picked from petri dishes for subsequent cultivation in tubes containing liquid media. After incuba-tion and growth, the ssDNA was amplified using the M13 forward and reverse primer sites within the vector and purified by QIAquick PCR. Finally, the ssDNA selected by the SELEX process were analyzed and aligned using the DIALIGN software25. Analysis of the secondary structure of identified aptamers was performed using theinternet-free Mfold software26.
Sample Spiked DXN (nM) [RR0 (%)et − R0]/ Recovery (%) RSD (%) Tap water 0 7.1 ± 2.3 — 2.26 50 46.0 ± 2.5 103.29 6.93 100 73.6 ± 1.6 90.68 2.19 Drinking water 0 14.3 ± 4.7 — 4.67 50 38.3 ± 2.3 81.55 6.45 100 77.7 ± 8.2 96.19 11.57 Ultrapure water 0 10.6 ± 2.4 — 2.39 50 30.5 ± 3.3 88.03 8.13 100 76.5 ± 3.6 94.54 5.05
Circular Dichroism (CD) study.
The conformational changes in the structure of the aptamer upon DXN recognition were studied by circular dichroism spectroscopy. The spectrum of each sequence was analyzed before and after adding 3 μM of DXN into 3 μM of aptamer sequences. To obtain accurate results, we recorded and sub-tracted the background signals of binding buffer and 3 μM DXN from the CD spectra. The CD measurements were performed using Jasco-810 spectropolarimeter. Each CD spectrum was collected from 200 to 320 nm wave-lengths at 0.1 nm intervals and an accumulation of three scans at 20 nm/min, with a 1 nm bandwidth and a time constant of 1 second.Electrochemical detection of DXN.
In this work, gold (Au) rod electrode was used as a basis surface for modified of the aptamers. The immobilization is based on self-assembly of a disulfide-aptamer on Au surface. Before using Au electrodes (2.0 mm diameter) were cleaned and polished with 1, 0.3 and 0.05 µm alumina slurries (Al2O3). The electrodes were then washed and sonicated for 2 min in ultrapure water and subsequently immersed for 1 min in a piranha solution (3:1 mixture of concentrated H2SO4 and 30% H2O2), then washed again with ultrapure water and sonicated for 2 min in 100% ethanol. The electrodes were then electrochemically treated by cyclic voltammetry in 0.5 M of H2SO4 by cycling a potential of 0 to +1.6 V with the scan rate of 100 mV/s for 15 scans. After washing with ultrapure water and dry with nitrogen, the electrodes were incubated in 1 μM disulfide-modified DEX04 aptamer (the best performance aptamer) in the binding buffer for 24 hours at room temperature. After that, the DEX04 aptamer-modified electrodes were cleaned with the binding buffer to remove any unbound aptamers. The electrodes were then immersed in a 1 µM 6-mercapto-1-hexanol (MCH) in 10 mM phosphate buffer saline, pH 7.4 for 30 min in order to block the remaining bare surfaces and to reduce the density of the aptamer layers by the displacement of the aptamers non-specifically adsorbed. At the end, the modified electrodes were thoroughly washed with the binding buffer and 1 M NaCl solution. For further uses, the modified electrodes were stored in the binding buffer at 4 °C.For preliminary conditions of the detection, the aptamer-modified gold electrodes were incubated with 50 nM and 100 nM of DXN for 100 min. After washing with binding buffer to eliminate the unbound aptamers to DXN, the electrodes were subjected directly to record cyclic voltamograms and impedance spectra. For the electro-chemical measurements, they were carried out by using SP-300 potentiostat (Bio-Logic Science Instrument, France) connected to a personal computer and driven by EC-Lab program. A frequency ranges from 100 kHz to 50 mHz using an alternative voltage with an amplitude of 10 mV, superimposed on a DC potential of 0.21 V (vs a Ag/AgCl reference electrode) was programed. All measurements were carried out in 10 mM PBS buffer, pH 7.4, in the presence of 10 mM [Fe(CN)6]4−/3− as a redox couple.
References
1. Goyal, R. N., Chatterjee, S. & Rana, A. R. S. Effect of cetyltrimethyl ammonium bromide on electrochemical determination of dexamethasone. Electroanalysis 22, 2330–2338 (2010).
2. Wu, F. & Lv, J. Flow injection chemiluminescence detection and solvent extraction for human skin ointment dexamethasone acetate absorption analysis and the reaction mechanism study. Talanta 72, 1811–1817 (2007).
3. Reig, M., Mora, L., Navarro, J. L. & Toldrá, F. A chromatography method for the screening and confirmatory detection of dexamethasone. Meat science 74, 676–680 (2006).
4. Cherlet, M., De Baere, S. & De Backer, P. Quantitative determination of dexamethasone in bovine milk by liquid chromatography–atmospheric pressure chemical ionization–tandem mass spectrometry. Journal of Chromatography B 805, 57–65 (2004).
5. Yang, X. et al. Effect of dexamethasone contamination in drinking water on intestinal flora in mice. Nan fang yi ke da xue xue bao = Journal of Southern Medical University 36, 238–243 (2016).
6. Huang, T.-J. & Li, P. S. Dexamethasone inhibits luteinizing hormone-induced synthesis of steroidogenic acute regulatory protein in cultured rat preovulatory follicles. Biology of reproduction 64, 163–170 (2001).
7. Fonda, E. S., Rampacek, G. B. & Kraeling, R. R. The Effect of Adrenocorticotropin or Hydrocortisone on Serum Luteinizing Hormone Concentrations after Adrenalectomy and/or Ovariectomy in the Prepuberal Gilt. Endocrinology 114, 268–273, https://doi. org/10.1210/endo-114-1-268 (1984).
8. Rosen, H., Jameel, M. L. & Barkan, A. L. Dexamethasone suppresses gonadotropin-releasing hormone (GnRH) secretion and has direct pituitary effects in male rats: differential regulation of GnRH receptor and gonadotropin responses to GnRH. Endocrinology 122, 2873–2880 (1988).
9. Netherlands, H. C. O. T. (ed. The Hague: Health Council of the Natherlands) (publication no. 2016/15, 2016).
10. Wang, Z. et al. Preparation of an anti-dexamethasone monoclonal antibody and its use in development of a colloidal gold immunoassay. Food and Agricultural Immunology 28, 958–968, https://doi.org/10.1080/09540105.2017.1320360 (2017).
11. Fatahi, A., Malakooti, R. & Shahlaei, M. Electrocatalytic oxidation and determination of dexamethasone at an Fe3O4/PANI–CuII microsphere modified carbon ionic liquid electrode. RSC Advances 7, 11322–11330, https://doi.org/10.1039/C6RA26125F (2017).
www.nature.com/scientificreports
www.nature.com/scientificreports/
12. Dozmorov, I. & Miller, R. A. In Vitro Production of Antigen-Specific T Cells from Unprimed Mice: Role of Dexamethasone and Anti-IL-10 Antibodies. Cellular Immunology 178, 187–196, https://doi.org/10.1006/cimm.1997.1134 (1997).
13. van Mens, S. P. et al. Dexamethasone Treatment Has No Effect on the Formation of Pneumococcal Antibodies during Community-Acquired Pneumonia. Clinical and Vaccine Immunology 19, 811–813, https://doi.org/10.1128/cvi.05697-11 (2012).
14. Wang, X. et al. A competitive photoelectrochemical immunosensor based on a CdS-induced signal amplification strategy for the ultrasensitive detection of dexamethasone. Scientific reports 5, 17945 (2015).
15. Sefah, K. et al. Nucleic acid aptamers for biosensors and bio-analytical applications. Analyst 134, 1765–1775 (2009). 16. Ellington, A. D. & Szostak, J. W. In vitro selection of RNA molecules that bind specific ligands. nature 346, 818 (1990).
17. Tuerk, C. & Gold, L. Systematic evolution of ligands by exponential enrichment: RNA ligands to bacteriophage T4 DNA polymerase. Science 249, 505–510 (1990).
18. Bunka, D. H. & Stockley, P. G. Aptamers come of age-at last. Nature reviews. Microbiology 4, 588 (2006).
19. Liang, H.-R. et al. Selection of an aptamer against rabies virus: a new class of molecules with antiviral activity. Virus research 184, 7–13 (2014).
20. Maehashi, K. et al. Label-free protein biosensor based on aptamer-modified carbon nanotube field-effect transistors. Analytical Chemistry 79, 782–787 (2007).
21. Vega-Figueroa, K. et al. Aptamer-Based Impedimetric Assay of Arsenite in Water:Interfacial Properties and Performance. ACS Omega 3, 1437–1444, https://doi.org/10.1021/acsomega.7b01710 (2018).
22. Katsouras, I. et al. Transverse charge transport through DNA oligomers in large-area molecular junctions. Nanoscale 5, 9882–9887,
https://doi.org/10.1039/C3NR03183G (2013).
23. Dmitri, Y. et al. Quantitative Analysis and Characterization of DNA Immobilized on Gold. J. Am. Chem. Soc. 125(17), 5219–5226,
https://doi.org/10.1021/ja029450c (2003).
24. Taverniers, I., De Loose, M. & Van Bockstaele, E. Trends in quality in the analytical laboratory. II. Analytical method validation and quality assurance. TrAC Trends in Analytical Chemistry 23, 535–552 (2004).
25. Simossis, V., Kleinjung, J. & Heringa, J. Homology-extended sequence alignment. Nucleic Acids Research 33, 816–824 (2005). 26. Zuker, M. Mfold web server for nucleic acid folding and hybridization prediction. Nucleic acids research 31, 3406–3415 (2003). 27. Song, Y. K., Park, J. S., Kim, J. K. & Kim, C. K. HPLC Determination of Dexamethasone in Human Plasma. Journal of Liquid
Chromatography & Related Technologies 27, 2293–2306, https://doi.org/10.1081/JLC-200025726 (2004).
28. Jeyaseelan, C. & Joshi, A. Trace determination of dexamethasone sodium phosphate in pharmaceutical formulations by differential pulse polarography. Analytical and Bioanalytical Chemistry 373, 772–776, https://doi.org/10.1007/s00216-002-1408-6 (2002). 29. Oliveira, T. M. B. F., Ribeiro, F. W. P., Soares, J. E. S., de Lima-Neto, P. & Correia, A. N. Square-wave adsorptive voltammetry of
dexamethasone: Redox mechanism, kinetic properties, and electroanalytical determinations in multicomponent formulations. Analytical Biochemistry 413, 148–156, https://doi.org/10.1016/j.ab.2011.02.033 (2011).
Acknowledgements
This work was supported through funding from the Natural Science and Engineering Research Council of Canada (NSERC), the Canada Research Chairs program (CRC) and Canada Foundation for Innovation and Le Fonds de Recherche du Quebec -Nature et Technologies (FQRNT).
Author Contributions
S.M., S.P. and M.S. conceived the idea of this work. S.M. designed and performed the experiments, analyzed the data and wrote the manuscript. S.P. helps for the electrochemical measurements and the sensors conception. G.C.J. was involved in all discussions during the project. All authors reviewed the manuscript.
Additional Information
Supplementary information accompanies this paper at https://doi.org/10.1038/s41598-019-42671-3. Competing Interests: The authors declare no competing interests.
Publisher’s note: Springer Nature remains neutral with regard to jurisdictional claims in published maps and institutional affiliations.
Open Access This article is licensed under a Creative Commons Attribution 4.0 International License, which permits use, sharing, adaptation, distribution and reproduction in any medium or format, as long as you give appropriate credit to the original author(s) and the source, provide a link to the Cre-ative Commons license, and indicate if changes were made. The images or other third party material in this article are included in the article’s Creative Commons license, unless indicated otherwise in a credit line to the material. If material is not included in the article’s Creative Commons license and your intended use is not per-mitted by statutory regulation or exceeds the perper-mitted use, you will need to obtain permission directly from the copyright holder. To view a copy of this license, visit http://creativecommons.org/licenses/by/4.0/.