HAL Id: tel-01307916
https://pastel.archives-ouvertes.fr/tel-01307916
Submitted on 27 Apr 2016
HAL is a multi-disciplinary open access
archive for the deposit and dissemination of sci-entific research documents, whether they are pub-lished or not. The documents may come from teaching and research institutions in France or abroad, or from public or private research centers.
L’archive ouverte pluridisciplinaire HAL, est destinée au dépôt et à la diffusion de documents scientifiques de niveau recherche, publiés ou non, émanant des établissements d’enseignement et de recherche français ou étrangers, des laboratoires publics ou privés.
Safety Regulation
Lina Escobar
To cite this version:
Lina Escobar. Economics of Nuclear Power : Construction Costs and Safety Regulation. Economics and Finance. Ecole Nationale Supérieure des Mines de Paris, 2014. English. �NNT : 2014ENMP0093�. �tel-01307916�
MINES ParisTech
Centre de Économie Industrielle CERNA 60 Boulevard Saint Michel, Paris, France
$$
École doctorale n° 369 : Economie, Organisation, Société
! ! ! ! ! ! ! ! ! ! ! !
présentée et soutenue publiquement par
Lina Patricia ESCOBAR RANGEL
10 Novembre 2014
Economics of Nuclear Power : Construction Costs and Safety Regulation
L’Économie de l’Énergie Nucléaire : Coûts des Construction et Régulation
de la Sûreté $
$
Doctorat ParisTech
T H È S E
pour obtenir le grade de docteur délivré par
l’École nationale supérieure des mines de Paris
Spécialité “ Économie et Finance ”
$
Directeur de thèse : François LEVEQUE $
T
H
È
S
E
JuryM. Jan KEPPLER, Professeur d'économie, CGEMP, Université Paris - Dauphine Président
M. Nicolas BOCCARD, Professeur d'économie, Universitat de Girona Rapporteur
M. Benoit SEVI, Professeur d'économie, UPMF, Université de Grenoble Rapporteur
Economics of Nuclear Power:
Construction costs and Safety
Regulation
by
Lina Escobar Rangel
A thesis submitted in partial fulfillment for the degree of Doctor of Philosophy in Economics
in the
CERNA - Center for Industrial Economics
Abstract
CERNA - Center for Industrial Economics
Doctor of Philosophy in Economics
by Lina Escobar Rangel
This thesis studies the role of the construction costs and safety regulation on nuclear power competitiveness. The analysis of the construction costs is based on the use of the actual data coming from the american and french nuclear fleet. In particular, we study different channels from which cost reductions might arise. We show that standardization is a key criterion for the economic competitiveness of nuclear power, first because the positive learning effects are conditional to the technology, this means that cost reductions will arise only if the same type of reactor is built several times, but also because it allows to reduce the cost indirectly through shorter construction lead-times. In the analysis of the role of safety regulation, we first asses the effect of the latest major nuclear accident (i.e Fukushima Dai-ichi) in the probability of occurrence of such an event and then the effects of the uncertainty regarding how safety care reduce the probability of a nuclear accident in setting safety standards under moral hazard and limited liability. We find that the standard will be stricter when the regulator is optimistic in the safety care effectiveness to reduce the risk of an accident, but simultaneously this policy might induce no compliance of the most inefficient operators.
I would like to express my gratitude to my supervisor, Professor Fran¸cois L´evˆeque, whose expertise added considerably to my graduate experience. He has guided me over these three years rigorously and patiently. I would like to thank for his constant interest in my work and for encourage me throughout my thesis.
Besides my advisor, I would like to thank other senior members of Center for Industrial Economics (CERNA), in particular to Yann M´eni`ere for the assistance and advices he provided to me during the doctoral workshop. Likewise I would also want to thank, Pierre Fleckinger for his comments and suggestions that were key to write the last chapter of this thesis.
I must also acknowledge Sesaria Ferreira for her assistance with all the administrative procedures but also for helping, supporting and listening to me, in particular when things went wrong.
I thank my fellow colleagues in CERNA: Michel Berth´elemy, Justus Baron, Marine Lefort, Damien Dussaux, Charl`ene Cosandier and more recently, Carlotta Mariotto, Jiekai Zhang and Btissam El Bahraoui; for their useful comments in the doctoral work-shop, but specially for making these years an enriching and pleasant experience. I would also like to thank my colombian friends who became my family and were the most precious company here in Paris: Diego Milanes, Paula Arias, Fabio Dominguez, John Mauro Perdomo, Hernan Perez and David Espinosa.
Last but not the least, I would like to thank my family: my lovely parents Jairo and Esperanza, my sister Daniela and my brother Oscar, for their love, their words and unconditional support. I dedicate this thesis to them.
This PhD thesis is embedded in a research program called The new economics of nuclear energy directed by Fran¸cois L´evˆeque and financially supported by ´Electricit´e de France EDF. This project aimed to study the challenges of nuclear energy through an economic perspective, focusing on three research axes: innovation, competitiveness and industrial organization. This thesis tacked the second issue by studying the construction costs and nuclear safety regulation. This document presents four papers that have been presented in seminars and conferences. The opinions expressed in this document do not necessarily coincide with those of EDF.
Chapter 1is entitled How Fukushima Dai-ichi core meltdown changed the probability of nuclear accidents and was co-written with Fran¸cois L´evˆeque. This paper was presented in the seminar organized by the Finance for Energy Market Research Center FIME at the Institut Poincar´e in Paris (22 March 2013), at the 20th EAERE conference in Toulouse, France (26-29 June 2013) and was accepted and published in Safety Science, Volume 64 on April 2014.
Chapter 2, Revisiting the Cost Escalation Curse of Nuclear Power. New Lessons from the French Experience also co written with Fran¸cois L´evˆeque was submitted and is currently under revision to be published in Economics of Energy and Environmental Policy. This paper was presented at the Conference of Energy Markets organized by Toulouse School of Economics in Toulouse, France (17-18 January 2013) and afterwards at the IAEE International Conference held in Daegu, South Korea (16-17 June 2013). Chapter 3, Nuclear reactors’ construction costs: The role of lead-time, standardization and technological progress is co-authored with Michel Berth´elemy. This paper has been presented in: the S´eminaire de recherches en ´economie de l’´energie held in Paris, France (12 February 2014), in the Environmental Economics Lunch Seminar organized by Paris School of Economics (6 March, 2014), the International WPNE Workshop on Project and Logistics Management in Nuclear New Build, organized by the OECD Nuclear Energy Agency (NEA) in Paris, France (11 March 2014), the 3rd Mannheim Energy Conference (May 5-6, 2014) and the IAEE International Conference held in New York, U.S (16-18 June 2014). This paper was accepted to be published in Energy Policy.
Chapter4 is called Setting optimal safety standards for nuclear operators subject to un-certainty, moral hazard and limited liability at the moment, it has not been yet presented in any conference.
Abstract ii
Acknowledgements iii
Preface iv
List of Figures viii
List of Tables ix
General Introduction x
0.1 Context . . . x
0.2 The risks of nuclear power and the probability of major accident . . . xii
0.3 The cost escalation curse in the construction of new nuclear power plants xiii 0.4 Nuclear safety regulation. . . xv
0.5 Methodological approach, structure and contribution of this thesis . . . . xviii
1 How Fukushima Dai-ichi core meltdown changed the probability of nuclear accidents? 1 1.1 Introduction. . . 1
1.2 Literature review . . . 2
1.3 How to properly estimate the expected frequency of a nuclear accident using theoretical probability and past observations?. . . 4
1.3.1 Data . . . 5
1.3.2 Models . . . 8
1.4 Poisson Exponentially Weighted Average (PEWMA) model . . . 14
1.4.1 PEWMA Results . . . 16
1.4.2 Arrival rate estimates from 1952 to 2012. . . 17
1.5 Conclusion . . . 19
2 Revisiting the cost escalation curse of nuclear power. New lessons from the French experience 21 2.1 Introduction. . . 21
2.2 Data and Model . . . 28
2.2.1 French construction cost escalation . . . 28
2.2.2 Model and data. . . 30 v
2.2.3 Multicollinearity and Principal Component approach . . . 33
2.3 Results. . . 36
2.4 Conclusion and Policy Implications . . . 40
3 Nuclear reactors’ construction costs: The role of lead-time, standard-ization and technological progress 43 3.1 Introduction. . . 43
3.1.1 Toward a nuclear renaissance? . . . 43
3.1.2 Existing literature on nuclear power plants construction costs and lead-times . . . 45
3.1.3 The contributions of this paper to the economic literature and the nuclear energy policy debate . . . 47
3.2 Model, main hypothesis about learning opportunities and data . . . 48
3.2.1 Model for construction costs and lead-times in nuclear power . . . 48
3.2.1.1 Hypotheses on the role reactor’s design standardization . 50 3.2.1.2 Hypotheses on learning by doing . . . 50
3.2.1.3 Hypotheses on leaning by searching . . . 51
3.2.2 Data . . . 52
3.3 Model specifications and results: France versus the US . . . 56
3.3.1 Model specifications . . . 56
3.3.2 Results . . . 57
3.4 Nuclear reactors lead-time: Insights from other OECD countries . . . 61
3.4.1 Data and Model . . . 62
3.5 Conclusion . . . 64
3.5.1 Policy implications for nuclear new-build programs . . . 65
3.5.2 Paths for future research. . . 67
4 Setting optimal safety standards for nuclear operators subject to un-certainty, moral hazard and limited liability 69 4.1 Introduction. . . 69
4.2 The Model . . . 74
4.2.1 Benchmark: The regulator knows β . . . 78
4.3 Imprecise probabilities and robust optimization . . . 82
4.3.1 Worst-case approach . . . 82
4.3.2 Regret robustness approach . . . 85
4.4 Conclusion . . . 89
5 General Conclusion 93 5.1 Conclusion about Construction Costs. . . 94
5.2 Conclusion about Safety Regulation . . . 98
A Cour des Comptes Actual Construction Costs for the French Nuclear
Fleet 101
B Linear models for the Construction Costs 102
D Alternative model specifications for lead-time 105
E List of nuclear reactor models by manufacturer in France and the US106
F Operator’s best response 107
1.1 Core Damage Frequency Industry Average Trend . . . 3
1.2 International Nuclear and Radiological Event Scale . . . 5
1.3 Major nuclear accidents, reactors and operating experience 1955-2011 . . 7
1.4 Histogram for nuclear accidents 1952-2011 . . . 8
1.5 Cumulate frequency (Accidents/ReactorYears) for nuclear accidents 1952-2011 . . . 8
1.6 Bayesian updating with Poisson-Gamma model . . . 12
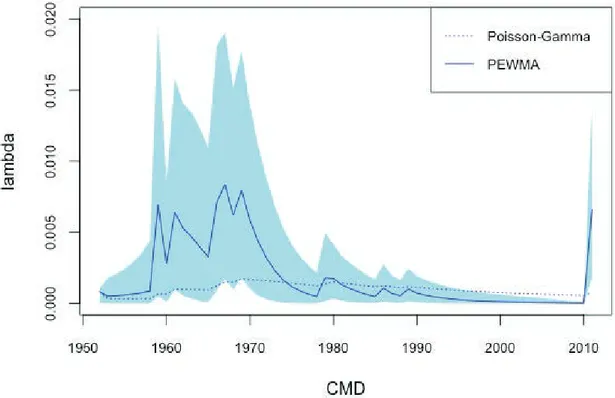
1.7 Poisson-Gamma vs PEWMA for CMD . . . 18
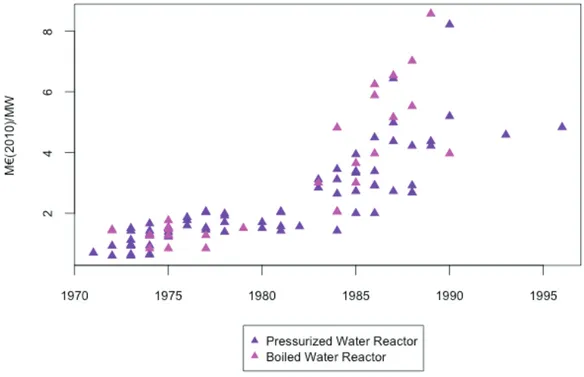
2.1 Overnight costs for the U.S Nuclear Fleet e2010/MW . . . 24
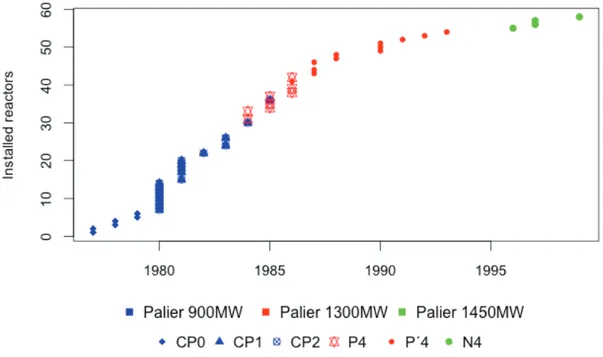
2.2 Evolution of French Nuclear Power Fleet by palier . . . 29
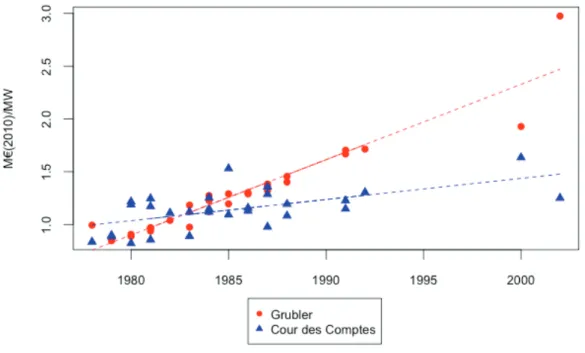
2.3 Grubler vs Cour de Comptes construction costs . . . 30
2.4 Cour de Comptes construction cost by palier and type . . . 31
2.5 Labor cost index (ICHT) and Price index for France =100 in 1973 . . . . 33
3.1 Nuclear reactors’ overnight construction costs in the US and France . . . 53
3.2 Nuclear reactors’construction lead-time in the U.S and France . . . 54
3.3 Nuclear reactors’ construction lead-time in OCDE countries . . . 63
4.1 Operator’s best response to different regulatory policies (s,q) . . . 79
4.2 Difference in the safety standards set taking worst-case and regret robust-ness approaches . . . 88
1.1 INES Events . . . 6
1.2 Poisson with constant arrival rate (1952-2011) . . . 10
1.3 Poisson with deterministic time trend . . . 13
1.4 PEWMA Estimates for Prior a=1 b=3.500 . . . 17
1.5 Test for reduction to Poisson H0: ω = 1 . . . 17
1.6 Summary of results . . . 19
2.1 First Generation of French Reactors . . . 28
2.2 Descriptive statistics . . . 34
2.3 Correlation Matrix . . . 34
2.4 Linear regression estimates . . . 35
2.5 VIF for explanatory variables . . . 35
2.6 Loadings and roots . . . 36
2.7 Principal Component Regression Results . . . 37
3.1 Descriptive statistics . . . 55
3.2 Estimation output of Equations (3.1) and (3.2) . . . 58
3.3 Estimation output of Equations (3.1) and (3.2) . . . 59
3.4 Mean for the explanatory variables . . . 62
3.5 Regression results for lead-time with experience and the HHI index . . . . 64
A.1 Data from the Cour des Comptes report . . . 101
B.1 Estimates for Model 2 . . . 102
B.2 VIF for Model 2 . . . 103
B.3 Estimates for Model 3 . . . 103
B.4 VIF for Model 3 . . . 103
B.5 Estimates for Model 4 . . . 103
B.6 VIF for Model 4 . . . 103
C.1 Alternative model specifications . . . 104
D.1 Alternative model specifications for lead-time in OECD countries . . . 105
E.1 List of nuclear reactor models by manufacturer in France and the US. . . 106
0.1
Context
On March 11 2011, the coast of Tˆohuku, the region located at the northeast of Japan’s main island, was devastated by a series of tsunami waves resulting after a 9.0 earthquake. This disaster affected several reactors in different nuclear power stations on the Pacific coast. Fukushima Dai-ichi was the most impaired nuclear plant, four of its six units were severely damaged and three reactors suffered core meltdowns followed by massive releases of radioactive material outside their containment structures. Undoubtedly, this has been one of the most severe accidents in the history of nuclear power for civil uses. Briefly, the timeline of the events that lead to the core melt at Fukushima Dai-ichi happened as follows: after the earthquake, reactors 1 to 3 shouted down automatically following the japanese safety protocols. The emergency generators were activated to power the cooling systems, in order to keep below the melting point the fission products that were in the fuel rods. The tsunami 14 meters waves arrived 50 minutes after the earthquake and overpassed the unit’s sea walls, which had 101 meters only. The sea water flooded the room where the emergency generators were located and they failed to power the cooling systems. Once the batteries of the active cooling systems ran out, the reactors began to heat up. As workers struggled to supply power to the reactors’ cooling systems and control rooms, multiple hydrogen-air chemical explosions occurred from 12 March to 15 March.
As soon as the images of this terrible catastrophe were broadcasted worldwide, they revived the memories of the core melt at Chernobyl in Ukraine in 1986 and materialized the hazards associated with the operation of a nuclear power plant. After the accident, the reactions from both the nuclear industry and anti-nuclear groups were swift. As expected, this accident deepened the divergence in their views regarding the role that nuclear power can play in the world’s energy production. But beyond the passionate 1
For further details of the affected reactors hit by the earthquake and tsunami, seePhillip Lipscy and Incerti (2013).
views of these groups, the debate following after Fukushima Dai-ichi accident raised important issues that put into question the convenience of nuclear power, both in safety and economical terms.
Paradoxically, Fukushima Dai-ichi accident happened in a period when, after a long time, prospects of nuclear deployment were positives. Throughout the 90s, the con-struction of new reactors had stagnated and the progressive aging of the fleet worldwide seemed to indicate the inevitable narrowing of nuclear power’s share in the world’s en-ergy production. However, since about 2001 the interest for nuclear power revived. In fact, the term nuclear renaissance appeared in the energy policy debate because many countries gave an important role to nuclear power in their agendas, with projections for new build similar to, or even exceeding, those of the early years of nuclear power. For instance, before the accident occurred 159 reactors were planned to be constructed around the world (WEC,2012), which would have meant an addition of 178.123 MWe (i.e. 47% of the present capacity).
The renewed interest in nuclear power was not fortuitous, on the contrary it appeared as a solution to multiples concerns. The high oil prices registered in 2000 and the fact that much of the oil and gas production is located in politically unstable countries recalled the importance of reducing the dependence of fossil fuels and secure the energy supply. Given that nuclear power uses an abundant mineral (uranium) in the earth’s crust made it attractive from an energy security standpoint. In addition, the growing awareness of the possible damages linked with climate change led to the implementation of different policies aimed to reduce CO2 emissions. Although most of the attention has been focused in renewables, it was acknowledge that nuclear power is the only technology that can provide base load electricity without carbon emissions (See Nuttall (2005),Joskow and Parsons (2009),Kessides (2012)).
Unquestionably, the accident meant a set back in terms of public perception about nuclear safety and induced a revision of the forecast of nuclear power expansion in many countries. The clearest example of how this accident triggered the political pressure against nuclear power was the decision to accelerate the nuclear phase-out in Germany. Just a couple of months after the accident, the Chancellor Angela Merkel decided to accelerate the phase-down and to move the shut down deadline to 2022, which reversed the decision that was taken one year before, when the life-time extension of nuclear power up to 20382 was granted.
This accident marked a breaking point in nuclear history, however the effect of Fukushima Dai-ichi in new nuclear builds is yet to be address. According Power Reactor Informa-tion System (PRIS) of the InternaInforma-tional Atomic Energy Agency (IAEA) 62 new reactors 2
were under construction in 2011 and in 2014, there are 72 reactors being built. Although this current level of new built is not as high as it was expected before the accident, it represents a record for nuclear industry and shows that public opinion is not the only barrier that nuclear power faces today. For the above, the materialization of the nuclear renaissance in those countries that still have a favorable opinion of nuclear power will depend, in some extent, on the responses that nuclear industry gives to the issues and challenges raised after this accident.
0.2
The risks of nuclear power and the probability of major
accident
The first issue for nuclear power development reemerged right after the accident. The possibility of a core melt down and the harm that such an event might provoke is the reason why nuclear power has been perceived as a latent hazard and has had to struggle with public opposition in many countries. At that moment, perhaps one of the subjects that raised more controversy in the public debate was how likely nuclear meltdowns could occur. Despite that this issue seems only a matter of applying a statistical formula, after Fukushima Dai-ichi supporters and opponents to nuclear power claimed diametrically opposite things.
On the one hand, nuclear industry claimed that Fukushima Dai-ichi core melts were the result of an unpredictable and very rare situation, they argued that core melts are not likely to occur and they claimed that new designs can resist natural events of similar magnitude of those that hit Japan. This point of view was supported with the results of the Probabilistic Risk Assessments (PRA) that have been done in different reactors around the world. For instance, the reportEPRI(2008) estimated that the average core melt frequency for the U.S nuclear fleet is equal to 2.0E-5, which means 1 core melt every 50.000 reactor years, or equivalently, 1 core melt each 1000 years for a fleet of 500 reactors in operation (today, world’s nuclear fleet has around 430 reactors in operation). On the other hand, nuclear opponents claimed that the observed frequency is higher than the (theoretical) expected frequency coming from the PRAs. Just dividing the total number of operating hours of all civilian nuclear reactors around the world, that is approximately 14.500 reactor-years, by the number of nuclear reactor meltdowns that have actually occurred (i.e. 4 nuclear meltdowns, 1 at Chernobyl and 3 at Fukushima), translates into one major accident every 3.625 reactor years. Which is substantially greater than what the nuclear industry suggested.
In this context, how to assess properly the probability of a major accident is an important question for nuclear power development, not only to clarify this debate, but also because it will allow a proper management of the risk. This means that societies can be better informed not only about the hazards that nuclear power entails but also on how likely is that major accidents occur. Nuclear regulators will be able to set attainable and coherent goals, in terms of the accepted risk level below which nuclear power plants should operate. In addition, operators can allocate better the safety investments aiming to reduce the probability of major accidents and finally, it could also be helpful to determine insurance policies.
0.3
The cost escalation curse in the construction of new
nuclear power plants
The second concern raised after Fukushima Dai-ichi accident is related with the safety investments that might have to be done to allow reactors under operation to resist natural aggressions, as those that impacted the Japanese nuclear fleet. But even more important for the future development of nuclear power are the consequences that this accident might have in terms of construction costs for new reactors. Investment costs are the main driver3 of nuclear electricity generating costs, thus any unexpected and significant increase of the expenses on the construction will undermine the profitability of a new build. It is possible to think that the lessons learned after Fukushima Dai-ichi may encourage nuclear vendors to include other safety features, safety authorities might impose stricter licencing rules, and greater public opposition to installing new nuclear power plants can result in an increase in the construction costs.
The potential effect of Fukushima Dai-ichi in the costs of new reactors worsen the doubts about the possibility of building nuclear power plants at a reasonable cost. It is impor-tant to mention that these concerns began to emerge before the accident, due to the con-tinuous revisions in the costs estimates for new reactors in the U.S. Taking into account the changes made by utilities in the application forms filled for the Nuclear Regulatory Commission, the cost expectation of an AP1000 reactor passed from US$2,000 in 2003 (See: Base case in Parsons and Du (2003)) to US$4,000 per installed kilowatt in 2009 (See: Parsons and Du (2009) andRosner and Goldberg (2011a)).
These concerns were also supported by the press releases announcing delays and im-portant cost overruns in the construction of the first of a kind Generation III+ EPR4 3
According to theIEA(2010) the share of the capital costs in the leveled cost of electricity in nuclear power is between 60% to 80%
4
reactors in Europe. In Finland, the construction of Olkiluoto 3 started in 2005 and was supposed to be ready in 2009. This delay will be by far failed, the commercial operation of this reactor was expected to be in 2016. The most recent news informed that it will be in 20185. Regarding the construction costs of the EPR at Flamanville unit in France, the continuous increases in the costs make the situation alarming. The first estimate was e3.3 billion in 2005 and passed to e6 billion in 2011. The most recent press release in 2012 announced a total cost ofe8.5 billion. Not to mention, that Flamanville 3 was ex-pected to start commercial operation in 2013, but due to delays during the construction is expected now to start up in 2016.
As if this were not enough, the doubts about nuclear power competitiveness were also supported by what has been registered in construction of the U.S and French nuclear fleet. For the former, it is possible to find a 7 times difference of the overnight cost6 expressed in Me(2010)/MW and collected byKoomey and Hultman(2007) for the first and last installed nuclear reactors. For France,Grubler(2010) found that the difference between the construction costs of the units installed in 1974 and those constructed after 1990 is 3.5 times. For all these reasons, the escalation of the construction costs of new reactors has been seen as a curse for nuclear industry.
The economic literature about nuclear power construction cost has not provided a clear cut answer to explain the main drivers of the new build’s costs overruns and how is it possible to reduce them. Most of the studies have used primarily U.S construction costs data, due to the lack of comparable data coming from other countries, therefore the re-sults are restricted to the american case. It is generally accepted that the heterogeneity of the nuclear U.S fleet, the longer lead-times that took to construct bigger reactors and the closer regulatory monitoring after Three Mile Island accident (Zimmerman(1982),David and Rothwell (1996), Rothwell (1986), Cantor and Hewlett(1988),McCabe (1996) and
Cooper(2012)) were the main elements that explain the substantial increase in the costs per MWe installed.
The cost assessment done byGrubler (2010) for the french nuclear fleet concluded that although the French nuclear fleet was constructed under a centralized industrial structure and it has a more homogenous nuclear fleet compared with the U.S fleet, it suffered of forgetting by doing. Making allusion to the fact that while EDF accumulated experience, nuclear construction costs per unit of capacity have been increasing instead of decreasing. 5
See: http://www.helsinkitimes.fi/finland/finland-news/domestic/
11836-olkiluoto-3-to-be-ready-in-2018.html
6
Overnight cost includes the investments linked with site preparation and construction, but it ex-cludes financing expenses. Therefore, it shows the cost of the plant as if it had been fully built in one night.
In this context, it has been argued that nuclear power is characterized by increasing investment costs and it is inevitable to build a new reactor without cost overruns and delays. However, in 2012 the actual construction costs for the French nuclear fleet were published in the Cour des Comptes report and by using this new information, it is possible to find that the cost escalation computed byGrubler(2010)7 was not as severe as argued. In fact, the ratio between the last and the first reactor installed in France using Grubler’s estimates is 3, while by taking the actual construction costs is 1.4. This difference suggests that there must be a way to curb the construction costs of nuclear reactors. Using the new information coming from the Cour des Comptes report is key to identify which have been the factors that allowed to ease the cost escalation in the construction of new nuclear power plants in France, compared with what happened in the U.S.
Nowadays, determine the main drivers of the construction costs of new reactors and the possible sources of cost reductions is of paramount importance for nuclear industry. As mentioned before, currently there are 72 reactors under construction in 14 different countries8, this is quite an achievement for nuclear power given that level of new build in 2014 has not been observed since 1987. It is likely that the success of the projects under construction, in terms of meeting the schedules and budgets, will represent a step towards the materialization of the nuclear renaissance, because it will give a green light for further deployment of nuclear power. While if this projects repeat the errors of the past, this might lead investments to other competing energy technologies, which have shown decreasing costs. For instance,Lindman and S¨oderholm (2012) found that the kW from onshore wind farms decreases by more than 10% each time the installed capacity doubles. In the same direction,Isoarda and Soria(2001) andC. Yu and Alsema
(2011) have identified significant learning effects in the photovoltaic industry, result that is confirmed by the dramatic reductions in the underlying costs and market prices of solar panels in the last years.
0.4
Nuclear safety regulation
One last issue, that also came as a result of Fukushima Dai-ichi accident is the role of safety regulation as an effective way to prevent these events. As described above, the height of tsunami waves was the cause of the flood, that made impossible to run the emergency generators to cool down the reactors, that eventually led to the core melts. 7 The costs assessment done by Grubler(2010) did not use the actual construction costs but some
estimations based on EDF financial statements 8
See the list published by the World Nuclear Association (WNA) http://world-nuclear.org/ NuclearDatabase/rdresults.aspx?id=27569&ExampleId=62
Right after the accident, it was somehow spread in the media that a tsunami of such magnitude was a surprise and it was not predictable, therefore the whole situation could be considered as a black swan. Nevertheless, different nuclear safety experts carried out investigations after the accident and discovered that the Japanese safety authority knew that similar tsunamis had happened in the past and it was possible to witness them again (seeGundersen (2012),Wang et al.(2013)).
This revelation harmed the reputation of the safety authority and the laxity of the Japanese nuclear regulator is now seen as the main cause of this accident (L´evˆeque,
2013). Indeed, the investigation showed that it was never required to Tokyo Electric Power Company (TEPCO), the operator of Fukushima Dai-ichi, to back fitted the sea walls even if they knew that it was likely to observe a violent tsunami in that region. Today, it is possible to argue that upgrading the unit’s sea walls would have been much cheaper, than the costs of damages that the accident has caused. However, before the accident, the investment decision was not as clear cut as it might be seen now. First, because even if the regulator knew that a tsunami of that magnitude was possible, still its probability was very small. Second, because the potential damages in case of an event like this were highly uncertain. Finally, because it is hard to measure how the sea wall’s upgrade would have reduced the probability of this accident. In consequence, before the accident the costs of upgrading the walls could have been seen as unnecessary, thus harmful for the profitability of the company.
Taking into account the above, it is clear that safety regulation aside from preventing nuclear accidents, also plays its role in the economics of nuclear power. Safety authorities are in charge of determining and enforcing the acceptable risk level at which nuclear power plants should operate. However, to attain the envisioned risk levels they can not demand the first thing that comes to mind. First, because it might not be effective to reduce the probability of an accident and second, because it might be too costly. In economics, this tension simply means that the regulators will have to identify the standards that allow to reduce the risk of major accident in a cost-efficient way. In other words, they have to determine the optimal balance between the marginal private costs of providing safety and the social marginal benefits of achieving that level of safety. Although this balance between the costs and benefits of providing safety is also present in other sectors, like transport, food, drugs, etc; nuclear safety authorities have to deal with several particularities. First, the damages left after an accident are huge and its consequences are long-lasting. For instance, the preliminary cost estimates of the Fukushima Dai-ichi accident are around 250 billion USD.Schneider and Froggatt(2014) claimed that 11 municipalities in Fukushima Prefecture covering 235 km2 will have to undertake decontamination efforts, not to mention the costs related with all the people
that had to be relocated after the accident. In the literature, Shavell (1984), Kolstad et al.(1990) andHansson and Skogh(1987) showed that when the magnitude of the harm is huge, as is the case of nuclear accidents, liability rules although they are necessary to provide incentives to exert safety care, are not enough to achieve sufficiently high safety levels.
Second, nuclear safety regulators have to monitor that operators comply with the re-quirements established in the safety standards, due to the unobservability of their ac-tion (although this is not specific for nuclear power). In the economic literature,Strand
(1994), Hiriart and Martimort(2004), Hiriart et al. (2004), inter alia, have shown that this information asymmetry (moral hazard) means that it is not possible to enforce the first best safety level at zero cost. Therefore, the challenge for nuclear safety authorities is to be able to define a policy that induce the compliance of the safety standard as the operator’s optimal response.
Finally, another problem present in nuclear safety regulation is the epistemic uncer-tainty regarding the probability of a major accident, but in particular how safety care can reduce it. Nuclear regulators have some statistical tools, as the PRA, to evaluate how operator’s safety care translates into reductions/increases in the probability of an accident, however the results coming from these techniques are random variables with unknown distribution functions. This last feature means nuclear regulators do not have a single and precise probability measure when setting the safety standards, but instead they have some partial information (i.e. an interval of values coming from the PRA) about the link between safety care and the probability of an accident.
How to set optimal safety standards in the presence of all the particularities mentioned above is an important challenge for nuclear power development. In the first place, be-cause safety authorities have to be able to guarantee that nuclear facilities run under the accepted risk level. Second, because safety standards are an effective way to comple-ment liability rules and achieve higher safety levels. Finally, because it is in the interest of both, the society and the operator to avoid the damages linked with major nuclear accidents.
0.5
Methodological approach, structure and contribution
of this thesis
All the issues described before make nuclear power a passionate subject and pose re-search questions, that are far from dull. Specifically in this thesis, we will try to give an answer, from a positive perspective, to the following questions: how to assess properly
the probability of a nuclear accident?, which are the determinants of the nuclear con-struction costs and the possible sources of reductions? and finally how to set optimal safety standards in the nuclear power sector?, taking into account the particularities of major nuclear accidents. To answer to these questions, this thesis is composed by four chapters that aim to study rigorously these three issues, in order to derive conclusions that shed some light in current debate, but also that allow us to predict to the possible trends in nuclear power development and help to shape future energy policies.
Chapter 1 is entitle How Fukushima Dai-ichi core meltdown changed the probability of nuclear accidents and was co-authored with Fran¸cois L´evˆeque. This chapter investigates how to compute the probability of a nuclear accident by using past observations. But in particular, how the observation of the last catastrophe at the Fukushima Dai-ichi nuclear power plant changed the expected frequency for such events. In this chapter we aimed to answer these questions by using historical data and testing different statistical models. We have compared four Poisson models using three different definitions of nuclear accidents from 1952 to 2012.
Our results allow us to conclude that as the definition of accident takes into account other events, (i.e. not only the major nuclear disasters but also less serious accidents) the independence assumption underlying the classical Poisson models is violated. This result called for a time-varying mean model, such as the Poisson Exponentially Weighted Moving Average (PEWMA). By using this last model we find a greater increase in the risk of a core meltdown accident, owing to the accident that took place in Japan in 2011, than the estimates that we obtained using the classic Poisson models.
Chapter2is entitle Revisiting the Cost Escalation Curse of Nuclear Power: New Lessons from the French Experience and it was also co-written with Fran¸cois L´evˆeque. This chapter studies the so called cost escalation curse that has affected the construction of new nuclear power plants, ever since the completion of the first wave in 1970 to the ongoing construction of Generation III+ reactors in Europe. As we have mentioned, this phenomenon has been studied for the U.S., and it has been argued that the escalation can partially be explained by a heterogeneous nuclear fleet, which has made it difficult to learn from experience. The French nuclear power program has followed a standardization strategy, however, previous cost assessments have also pointed to an increase in the capital costs. This observation implied that even in the best economic conditions, cost escalation is inherent to nuclear power.
In this chapter we reexamine the drivers of cost escalation in France, based on con-struction costs taken from a recent report by the Cour des Comptes. Using this new information, we find that the cost escalation observed in previous studies was lower than argued. Our results indicate that the scale-up resulted in more costly reactors,
however we were not able to disentangle the effect of the technological change embedded on bigger reactors, from the effect of the increase in the size. In parallel we find positive learning effects, but they were restricted to the same type of reactors (i.e. the construc-tion cost of decrease as the experience in the same type increases). Finally, we find that those reactors with better safety performance were also more expensive. This last result suggests that safety concerns have played a role in the cost escalation observed in France.
Chapter 3, Nuclear reactors’ construction costs: The role of lead-time, standardization and technological progress is co-authored with Michel Berth´elemy and complements the previous chapter by analyzing the nuclear reactor construction costs and lead-times in France and the United States. We estimate a regression model for both the overnight costs and construction time. In this chapter, we test the presence of standardization gains in the short term and long term. The former might arise when the diversity of nuclear reactors’ technologies under construction is low, and the latter might arise as the result of learning by doing, that in this context means the experience in the construc-tion of the same type of reactor. In addiconstruc-tion, we study the effect of innovaconstruc-tion in the construction of new reactors, by using priority patent data as a proxy for technological progress.
We find that overnight construction costs benefit directly from learning by doing, but the spillovers were only significant for nuclear models built by the same firm. In addition, we show that the standardization of nuclear reactors has an indirect and positive effect in the short run, through a reduction in lead-time, the latter being one of the main drivers of construction costs. Conversely, we also explore the possibility of learning by searching and find that, contrary to other energy technologies, innovation leads to construction costs increases
Chapter 4is entitle Setting optimal safety standards for nuclear operators under uncer-tainty, moral hazard and limited liability. It examines the features of an optimal safety regulatory policy under uncertainty about how safety care reduces the probability of accident, moral hazard and limited liability. The regulatory policy consists in setting a safety standard and choose a probability of inspection to the nuclear facilities. After the inspection, the regulator can impose a fine in case the nuclear operator did not comply with the safety standard. The main objective of this paper is to characterize the optimal regulatory policy that induce compliance by the operator, when the regulator does not know perfectly how the safety care level will reduce the probability of a nuclear accident. To tackle this issue we use robust optimization techniques: worst case and regret robustness.
Our results suggest that under the most conservative approach, i.e. when the regulator minimizes the maximum expected costs, the regulatory policy will be less strict, than when he is better informed. On the contrary, when the regulator attempts to mini-mize regret, the safety standard might be stricter but it also increases the risk of no compliance.
Finally, Chapter 5concludes. This chapter outlines the main results of this PhD thesis and links them with the challenges that nuclear power faces today. In short, we claim that the development of nuclear power in the world will depend predominantly, on how the industry is able to curb the cost escalation. For this reason, nuclear vendors should direct their innovation efforts not only on achieving better safety performance (as they have done so far), but also on reducing the construction costs. Countries with ambitious nuclear power programs should adopt a standardization strategy by reducing the technologies to be installed, but also they have to determine which will be the pace of technological change. Finally, nuclear regulators should concentrate their efforts in fostering better safety performance levels within the operators through stricter operating standards, once the reactors guarantee that they have reached an acceptable ex ante risk level.
How Fukushima Dai-ichi core
meltdown changed the probability
of nuclear accidents?
1.1
Introduction
The triple core meltdown at Fukushima Dai-ichi power plant on March 11, 2011 is the worst nuclear catastrophe after Chernobyl in 1986. The substantial losses of this accident have aroused in the public opinion an old age debate: Is nuclear power safe? Critics claim that nuclear power entails a latent threat to society and we are very likely to witness an accident in the near future. Proponents say that the conditions that provoked the Fukushima disaster were unlikely, assert that new reactors can successfully face extreme conditions and conclude that the probability of a nuclear accident is very low.
In the media this debate is far from be clear. For instance, two months after the Fukushima Dai-ichi meltdown, a French newspaper published an article1 saying that the risk of a nuclear accident in Europe in the next thirty years is not unlikely but on the contrary, it is a certainty. The authors claimed that in France the risk is near to 50% and more than 100% in Europe.
Their striking result comes from dividing the number of reactor explosions (one in Cher-nobyl and 3 in Fukushima Dai-ichi) over cumulated experience (14.000 reactor-years) and multiplying this ratio by the number of reactors and 30 years. So if we take 58 operative reactors in France, we get 0.49 and if we consider 143 reactors in Europe we 1
Benjamin Dessus and Bernard Laponche, June 3, 2011, available athttp://www.liberation.fr/ politiques/01012341150-accident-nucleaire-une-certitude-statistique
obtain 1.22; hence, their conclusion that a nuclear accident is a certainty in the European Union.
Although their methodology is essentially flawed since the figures they found are larger than 1, the estimated frequency of a major accident reported by nuclear industry is not very convincing neither. According to a report issued byEPRI(2008) , the probabilistic risk assessment for the U.S nuclear fleet estimates an average expected rate of core meltdown of the order of 2.0E-5. This figure means that in average we can expect one accident per 50.000 reactor years, which seems quite optimistic with respect to what has been observed in the history of nuclear power. As of today, one accounts approximately 14.500 operating years of nuclear reactors and 10 core meltdowns. This implies an observed frequency of 1 accident per 1450 reactor years, which is a higher rate than what is predicted by the probabilistic risk assessments (PRA, hereafter).
From this debate we can conclude that assessing properly the probability of a nuclear accident with available data is key to shed light in the risks that nuclear power will entail on tomorrow. For this reason, the main objective of our paper is to discuss different statistical approaches to estimate the expected frequency of nuclear accidents. Our results suggest that although the Poisson model is the most used for addressing this problem, it is not suitable when the independence assumption is violated. In such cases a time-varying mean model, like a Poisson Exponentially Weighted Moving Average (PEWMA) is more suitable to estimate the expected frequency of core meltdown. The remainder of this paper is structured as follows. Section 1.2outlines the literature about nuclear risk assessment. Section 1.3 investigates how to estimate the expected frequency and compute the probability of a nuclear accident using successively a fre-quentist and a Bayesian approach. Section 1.4 presents the PEWMA model and its results. Section 1.5concludes.
1.2
Literature review
It is possible to distinguish two approaches to assess the probability of nuclear accidents: PRA models and statistical analysis. PRA models describe how nuclear reactor systems will respond to different initiating events that can induce a core meltdown after a se-quence of successive failures. This methodology estimates the core damage frequency
(CDF, hereafter)2 based on observed and assumed probability distributions for the dif-ferent parameters included in the model.
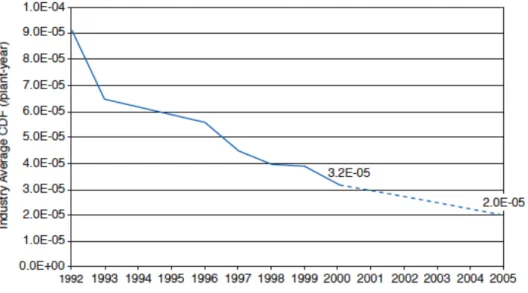
The use of PRA in commercial reactors is a common practice in the U.S, because the results are a key input for the risk-based nuclear safety regulation approach (Kadak and Matsuo, 2007). The Nuclear Regulatory Commission (NRC, hereafter) has been doing PRA studies since 1975, when the so-called WASH-1400 was carried out. This first study estimated a CDF equal to 5E-05 and suggested an upper bound of 3E-04. The lessons from Three Mile Island accident and the ensuing improvements in PRA techniques allowed the NRC to perform a PRA for 5 units in 1990; the average CDF found was 8.91E-05. In 1997 the NRC published the Individual Plant Examination Program NUREG-1560, which contains the CDFs, for all the 108 commercial nuclear power plants in the U.S.
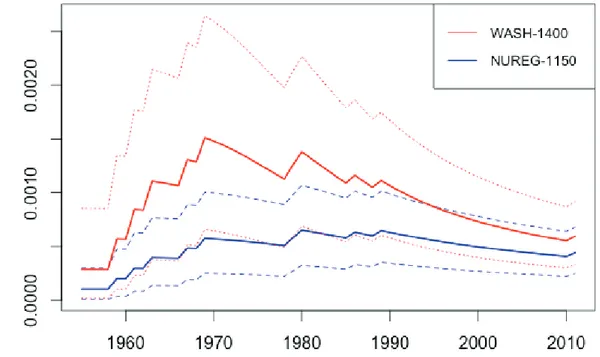
The latest EPRI (2008) report about the U.S nuclear fleet pointed out that this met-ric has shown a decreasing trend from 1992 to 2005 (see Figure 1) due to safety en-hancements that have induced significant reductions in the risk of core melt down. As mentioned before, it claimed that the average CDF is 2.0E-5.
Figure 1.1: Core Damage Frequency Industry Average Trend (EPRI,2008)
2
PRA can be done at 3 levels. The first one considers internal or external initiating events followed by a series of technical and human failures that challenge the plant operation and computes the CDF as a final outcome. Level 2 evaluates how the containment structures will react after an accident, at this level the Large Early Release Frequency (LERF) is computed. The last level determines the frequencies of human fatalities and environmental contamination.
The second approach to assess the probability of nuclear accidents is statistical anal-ysis. Basically this approach combines theoretical probability functions and historical observations, to estimate the parameters of interests.
Hofert and W¨uthrich (2011) is the first attempt in this category. The authors used Poisson maximum likelihood (MLE) to estimate the frequency of annual losses derived from a nuclear accident. The total number of accidents is computed as a Poisson random variable with constant arrival rate denoted by λ.
The authors recognized that the λ estimates change significantly depending on the time period taken. This suggests that there are doubts about the assumption of a non-time dependent arrival rate. If the arrival rate depends on time, it means that the events are correlated somehow, which in turns means that one of main assumptions underlying this model is violated and therefore the results coming from the classic Poisson model are no longer valid. The main purpose of our paper is to fill this gap in the literature by using a structural-time series approach. This model has been developed by Harvey and Fernandes(1989) and used in political science by Brandt and Williams(1998), but is yet to be used to assess nuclear risks.
1.3
How to properly estimate the expected frequency of a
nuclear accident using theoretical probability and past
observations?
How to compute the probability of a serious accident is a key input to assess the risk of nuclear power. Nevertheless, the use of a theoretical probability distribution to predict an outcome, like a nuclear accident, requires a clear interpretation of the estimates that we are obtaining.
The results that we will present in the following sections correspond to an arrival rate of a Poisson distribution, which corresponds to the expected frequency of an accident (the mean of the distribution). Given that we are dealing with a rare event, the estimates for this rate will tend to be close to zero, and this feature make it possible to approximate the value of the arrival rate to the probability of observing at least one accident. The usual interpretation for an arrival rate, for instance equal to 5E-0.5, is that in average we will observe at least one accident each 20000 reactor-years. Following Aven and Reniers (2013) we can have a better interpretation and think this arrival rate, as the equivalent uncertainty that a person will assign to drawing a specific ball from an urn containing 20000 balls.
1.3.1 Data
Defining which events can be considered as nuclear accidents was the first step in our study. As we will explain in this section, the scope of the definition of accident will determine the number of observations to be used in the statistical models that we are going to test.
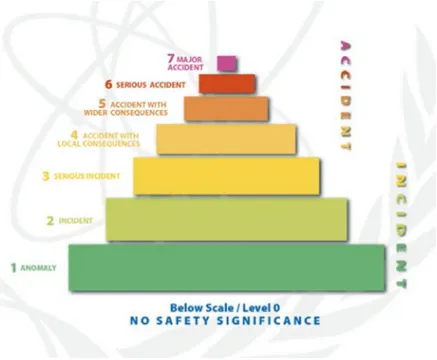
In general, the criterion used to define nuclear accidents is closely linked with the amount of radioactive material that is released outside the unit. The International Atomic Energy Agency introduced the INES scale inspired by the so-called Birds pyramid that seek to determine the ratio between the fatal and less serious accidents. As we can see in Figure 1.2, this scale ranks nuclear events into 7 categories. The first 3 are labeled as incidents and only the last 4 are considered as accidents. The major nuclear
accident is rated with 7 and is characterized by a large amount of radioactive material
release, whereas the accidents with local consequences are rated with 4 because only minor releases of radioactive material have occurred.
Figure 1.2: Core Damage Frequency Industry Average Trend Source: IAEA: http:
//www-ns.iaea.org/tech-areas/emergency/ines.asp
This pyramid is a good representation of both the severity and frequency nuclear inci-dents/accidents. On the top, we find the major nuclear accidents that are rare events. Since the installation of the first commercial nuclear reactor in 1952 unit nowadays, there have been only 2 events classified in this category: Chernobyl and Fukushima Dai-ichi. On the base, we find minor incidents that are more frequent but less serious. As we
climb the pyramid, we have fewer observations but each one represents a more serious accident.
The International Atomic Energy Agency has recorded every single event reported by nuclear operators since 1991 using the INES scale3. Unfortunately, not all the nuclear incidents recorded previous to 1991 are rated with this scale; only the most significant events have been evaluated and rated accordingly. Table1.1summarizes the number of observations that we gathered in each category.
Table 1.1: INES Events
INES 3 4 5 6 7
Observations 20 13 5 1 2
As we can see in Table 1.1, the low frequency of a major nuclear accident (Level 7) makes difficult to appraise its probability. However, if we expand the definition of nuclear accident more observations make the cut. For instance, we can consider nuclear accidents as all the events rated with more than 3 in the INES scale. Table 1 shows that with this new definition, we count 21 accidents.
From the above it can be deduced that the definition of nuclear accident is an important empirical issue, because as it gets narrower (i.e. more serious accidents) the number of observed events is reduced. This tension implies a trade-off between estimation reliability and the meaning of the results. A broader scope will result in better estimates, but they will not give a precise insight about major nuclear accidents. On the contrary, if we restrict our attention only to the most dramatic accidents, we only have 2 cases, which undermine the degrees of freedom, therefore the reliability of any statistical model. In order to avoid the sparseness when focusing only on major nuclear accidents, we considered 3 definitions. The first definition corresponds to events rated with more than 2 in the INES scale (serious incidents + accidents), the second counts those accidents rated with more that 3 within the same scale. The third definition is core meltdowns with or without radioactive releases, this events have been recorded by Cochran (2011), who counted 9 nuclear commercial reactors that have experienced partial core meltdown from 1955 to 2010, including the well-known Three Mile Island accident in 1979. Given that this last definition (core melt downs) is the narrowest, we can compare it with the CDF computed in the PRA studies. Another advantage of using this definition is that the magnitude of internal consequences of a core meltdown (i.e., the loss of the reactor and its clean-up costs) do not differ much between a major and less severe 3
accidents4. Therefore, knowing the expected frequency of a core meltdown as we have defined, could be useful to design insurance contracts to hedge nuclear operators against the internal losses that will face in case of any of these events.
It is important to recognize that given that the broader definitions (events with INES> 2 and >3) contain heterogeneous events, it is possible that the magnitude of internal consequences that they had had differ substantially, therefore they cannot be used to insurance purposes. Nevertheless, we consider it is worthwhile to consider these two definitions despite this shortcoming, because the results can be seen as an upper bound for the expected frequency of serious catastrophes.
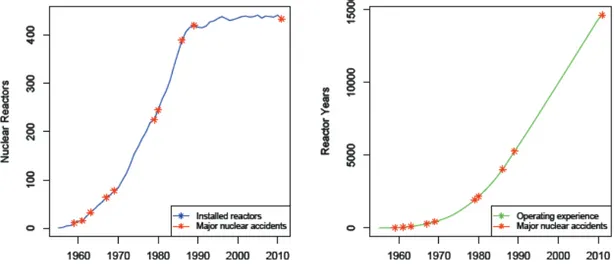
Figure 1.3: Major nuclear accidents, reactors and operating experience 1955-2011
Figure1.3plots the number of core melts downs (CMD, hereafter) collected byCochran
(2011) as well as the number of installed reactors, on the left panel and cumulated nuclear operating experience (in reactor years) published in the PRIS5 database, on the right panel.
At first glance, we can conclude that PRA results might not be completely wrong, given that most of the accidents were recorded at the early stages of nuclear power history. It is important to highlight that during the period in which nuclear experience grew exponentially (i.e., over the last 10 years), only (and fortunately) the Fukushima Dai-ichi meltdowns have been observed. This intuitively suggests that there have been safety improvements in the operation of the worldwide nuclear power fleet.
Figure 1.4 shows how many times we have observed in our sample nuclear accidents using our three definitions. As we can see in this Figure, the most frequent value for an 4 By contrast, the damages in case of radioactive elements releases in the environment could vary in several orders of magnitude depending on the meteorological conditions and the population density in the areas affected by the nuclear cloud
Figure 1.4: Histogram for nuclear accidents 1952-2011
event rated with more than 2 and 3 in the INES scale, as well as CMD is zero. This means that that sparseness remained, even if the scope of accidents that we have taken is broader.
Figure 1.5: Cumulate frequency (Accidents/ReactorYears) for nuclear accidents 1952-2011
1.3.2 Models
Once we had defined the scope of accident, we parameterized the problem. We assumed that nuclear accidents are realizations that follow a Poisson distribution. This function computes the probability of a number of discrete events occurring in a continuous but fixed interval of time, given an arrival rate. In our case, the events correspond to nuclear accidents and the interval time to one year.
Assumption 1: Let yt denote the number of nuclear accidents observed at year t. Assume that ytis a Poisson random variable with an arrival rate λ and density function given by:
f (yt|λ) =
(λEt)ytexp(−λEt) yt!
(1.1)
Although the time period is one year, we have to offset the observations by Et, that is the exposure time within this interval. It corresponded to the number of operative reactors at year t.
Under Assumption 1, the problem is fully parameterized and we only need to estimate the arrival rate, denoted by λ that in our case represents the expected frequency of a nuclear accident, to compute the probability of a nuclear accident at time t.
Before we proceed further, we want to reiterate the necessary conditions for a count variable to follow Poisson distribution:
i. The probability of two simultaneous events is negligible
ii. The probability of observing one event in a time interval is proportional to the length of the interval
iii. The probability of an event within a certain interval does not change over different intervals
iv. The probability of an event in one interval is independent of the probability of an event in any other non-overlapping interval
In the case of nuclear accidents, the first two assumptions do not seem far from reality. Even if in Fukushima Dai-ichi the core melts occurred the same day, the continuous nature of time allows us to claim that they did not happen simultaneously; and it is not unreasonable to expect that as we reduce the time interval, the likelihood of an accident goes down.
On the contrary, conditions (iii) and (iv) might be more disputable. In this section, we assumed that the data satisfy these assumptions; in the next section they will be relaxed.
The simplest procedure to estimate λ is to use the observations in the sample ({yt}Tt=0, {Et}Tt=0) a and compute the maximum likelihood estimate. Which simply means that ˆλ equals the cumulative frequency. Using the three definitions of nuclear accidents, we computed the estimate for λ. Table1.2 summarizes the results.
Table 1.2: Poisson with constant arrival rate (1952-2011)
Database λˆ Coefficients Estimate Std. Error z value Pr(> |z|)
INES > 2 0.00273 -5.902 0.156 -37.8 <2e-16 ***
INES > 3 0.00139 -6.571 0.218 -30.12 <2e-16 ***
CMD 0.00066 -7.312 0.316 -23.12 <2e-16 ***
If we compute ˆλ using the information available up to year 2010, we can define ∆ as the change in the estimated arrival rate to measure how Fukushima Dai-ichi affected the rate.
∆ = λˆ2011− ˆλ2010 ˆ
λ2010
(1.2)
Using this first model, the Fukushima accident represented an increase in the arrival rate of the CMD equal to 0,079. In other words, after assuming a constant world fleet of 433 reactors on the planet from 2010 to 2011, was equal to 6.17E-04 in the absence of Fukushima Dai-ichi accident. By including this accident, it went up to 6.66E-04 (i.e., about a 8% increase).
However, the simplicity of this model comes at a price. First, the estimation only took into account the information contained in the sample (i.e. observed accidents), it would been suitable to incorporate the knowledge brought by nuclear engineers and scientists over the past 40 years on the potential causes that may result in major accidents, especially core meltdowns.
Second, it is assumed that all the reactors built over the past 50 years are the same and their safety features are time invariant. This basic Poisson model does not measure if there have been safety improvements that reduce the probability of a nuclear accident progressively, as PRA studies have shown.
To address the first limitation, our second alternative was to consider λ as a random variable. Under this approach, using Bayes law, the observations were combined with a prior distribution, denoted by f0(λ), that encoded the beliefs about our parameter, to update the distribution of our parameter of interest.
f (λ|yt) =
f (yt|λ)f0(λ) R f (yt|θ)f0(θ)dθ
(1.3)
Equation1.3shows the updating procedure for a continuous random variable. Note that once we have updated f0(λ) using the available information {yt}Tt=0, we can use mean
of the posterior distribution f (λ|yt) in Equation 1.1 to compute the probability of an accident.
The choice of the prior distribution has always been the central issue in Bayesian mod-els6. Within the possible alternatives, the use of a conjugate prior has two important advantages: it has a clear-cut interpretation and it is easier to compute.
Inasmuch as we have already assumed that accidents come from a Poisson distribution, we have also assumed that λ followed the conjugate distribution for this likelihood, which is a Gamma distribution with parameters (a, b).
Assumption 2: The arrival rate λ is a Gamma random variable with parameters (a, b) and density function given by:
f0(λ) =
exp(−bλ)λa−1ba
Γ(a) (1.4)
Due to the properties of the gamma distribution, it is easy to interpret the chosen parameters. The intuition is the following: Prior to collecting any observations, our knowledge indicates that we can expect to observe a number of accidents in b reactor years. This gives us an expected rate equal to a/b, that will be the mean of the gamma (prior) distribution. The parameter that reflects how confident we are about this pre-vious knowledge is b. Given that it is closely related with the variance (V (λ) = a/b2), the greater b, the more certain we are of our prior. Once we collect observations, yt accidents in Et reactor years, we update our prior following a simple formula:
au= a + yt (1.5)
bu = b + Et (1.6)
Which gives a new expected rate given by au/bu.
PRA estimates have valuable information to construct the prior. For instance, the WASH-1400 report found an upper bound CDF equal to 3E-04, it means approximately 1 accident over 3.500 reactor years, that can be expressed in terms of prior parameters as (a = 1, b = 3.500). Likewise, the NUREG-1150 study computed a CDF equal to 8.91E-05, that in terms of prior parameters is (a = 1, b = 10.000).
6 For an extended discussion on the prior’s selection, see Carlin and Louis(2000) orBernardo and
As we can see in Figure 1.6, using the WASH-1400 information as prior, the Bayesian model predicted both a higher expected arrival rate and a wider confidence interval, because the low value of b. In this case, the results were driven by the observations and quickly converged towards the results of the previous model. However, by taking the NUREG-1150 study as a source for the prior, we needed a larger number of observations to move far from the prior.
Figure 1.6: Bayesian updating with Poisson-Gamma model
In fact, by using (a = 1, b = 3.500) as prior, we found similar results for the CMD. The Poisson-gamma model predicted an expected arrival rate equal to ˆλ2011= 5.99E-04 and ∆ represented an increase of 7.09%. After using the figures form the NUREG-1150 (a = 1, b = 10.000), we found an expected arrival rate equal to ˆλ2011 =4.3E-04 and ∆= 8% for CMD.
To deal with the second limitation of the Poisson model, we defined λ as a function of a time trend. With this third model, is possible to test if that there has been a sustained decrease in the expected rate of nuclear accidents over the past 10 years. However, note that such an approach challenges what is stated in condition (iii) because we are allowing that the arrival rate changes in each time interval (i.e., one year in our case).
Assumption 3: The systematic component (mean) λt is described by a logarithmic
link function given by:
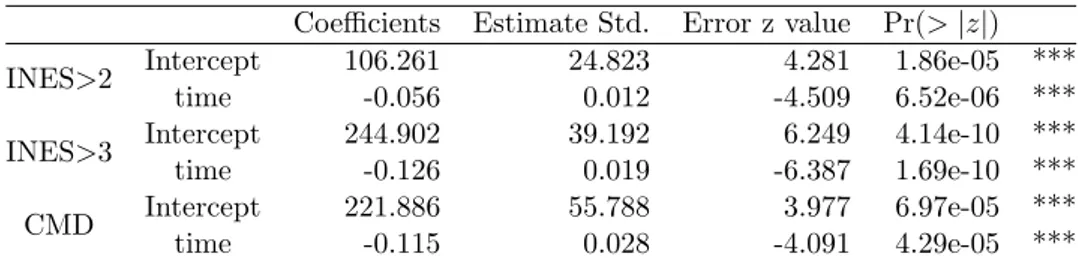
Table 1.3: Poisson with deterministic time trend
Coefficients Estimate Std. Error z value Pr(> |z|)
INES>2 Intercept 106.261 24.823 4.281 1.86e-05 ***
time -0.056 0.012 -4.509 6.52e-06 ***
INES>3 Intercept 244.902 39.192 6.249 4.14e-10 ***
time -0.126 0.019 -6.387 1.69e-10 ***
CMD Intercept 221.886 55.788 3.977 6.97e-05 ***
time -0.115 0.028 -4.091 4.29e-05 ***
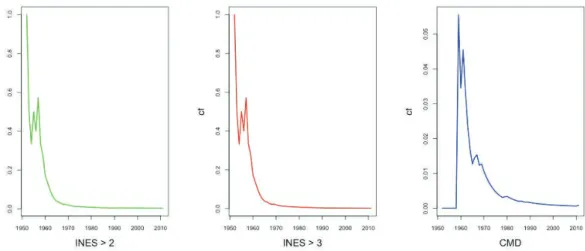
Results in Table1.3are maximum likelihood estimates for (β0, β1). Given the clarity of these results, there is every reason to believe that the expected frequency of a nuclear accident has changed along this period. As expected, the estimates were negative and significant. Therefore, if the effect of regulatory strictness, technological improvements and safety investments can be summarized in this variable, we have found some evidence that supports the decreasing trend for the core damage frequency that the PRA studies have shown.
In the CMD case, the ˆλ2011=3.20E-0.5 that is close to the estimated CDF of last PRA studies. After computing the Fukushima Dai-ichi effect on the arrival rate, we found an increase of =2.3. Unlike in the previous two models this increment is substantial7. In this last set of results, we found a negative and significant time trend, which in a nutshell means arrival rate is decreasing in time. Although this feature does not seem controversial, it invalidates condition iii (non time varying arrival rate) and we cannot make use the traditional Poisson models, as we have done so far. We need a model in which the parameter of interest (i.e ˆλ ) is function of time.
Regarding the no correlation hypothesis (i.e., condition iv), at first glance one could say that nuclear accidents fulfill this condition. Three Mille Island accident is not related with what happened in Chernobyl, etc. Nevertheless, we have a long time series data that in some sense reflect the evolution of nuclear power technology and knowledge. It is important to recognize that nuclear reactors have a long lifetime thus there is some technological inertia in the world nuclear fleet, but at the same time innovations have been adopted and new reactors have been installed along the time period that we have analyzed. For this reason, it is possible that our data exhibit some correlation. In fact 7 The Poisson regression can also be done under a Bayesian approach, nevertheless the prior is not as easy to construct as in the previous case, because in this setting the coefficients (β0, β1) are the random variables. Generally it is assumed that they come form a normal distribution β ∼ Nk(b0, B0). Where k = 2 (in our case) is the number of explanatory variables; b0is the vector of prior means and B0 is the variance-covariance matrix. Then to construct the prior will require a lot of assumptions not only in the level and precision of the coefficients, but also in how they are related. Given that precisely what we want is to relax as much assumptions as possible, we are not going to consider such a model.
as we pointed out before, it is clear from Figure 1.3 that the early stages of nuclear power industry are related with more accidents than the lasts years of our sample. To confirm or reject the validity of this assumption, it is customary when using a time series, to check if there is a stochastic process that governs data dynamics. In our case, this means to know if accidents are somehow correlated, or if instead we can assume that they are independent events (condition iv). To test this we propose to use a time series state-space approach.
Before turning to the last model, it is worthwhile to understand why conditions (iii) and (iv) are relevant? As in the classical regression analysis, the maximum likelihood estima-tion assigns an equal weight to each observaestima-tion because under these assumpestima-tions, all of them carry the same information. However, if observed events are somehow correlated, some of them bring more information about the current state than others, therefore past observations have to be discounted accordingly.
1.4
Poisson Exponentially Weighted Average (PEWMA)
model
Autoregressive Integrated Moving Average (ARIMA, hereafter) models are the usual statistical frameworks to study time series, however there are two limitations to use them in the case of nuclear accidents. First, it is inappropriate for discrete variables because ARIMA models are based on normality assumptions (thus it is incompatible with Assumption 1). Second, Harvey and Fernandes(1989) noted that when the mean of the process tends to zero, ARIMA estimates could result in negative predictions, which cannot be the case for nuclear accidents.
To deal with these two limitations, Harvey and Fernandes (1989) and Brandt and Williams (1998) proposed to use a structural time series model for count data. This framework has a time-varying mean as in the ARIMA models but is based on a Poisson or a negative binomial conditional distribution.
The idea is to estimate the coefficients in the exponential link as in a Poisson regression, but each observation is weighted by a smoothing parameter, this is the reason why the model is called Poisson Exponentially Weighted Moving Average (PEWMA).
We briefly describe below the structural time series approach8, following what has been developed by Brandt and Williams (1998) and (2000). The model is defined by three equations: measurement, transition and a conjugate prior. The first is the models 8