HAL Id: tel-02951486
https://tel.archives-ouvertes.fr/tel-02951486
Submitted on 28 Sep 2020HAL is a multi-disciplinary open access archive for the deposit and dissemination of sci-entific research documents, whether they are pub-lished or not. The documents may come from teaching and research institutions in France or abroad, or from public or private research centers.
L’archive ouverte pluridisciplinaire HAL, est destinée au dépôt et à la diffusion de documents scientifiques de niveau recherche, publiés ou non, émanant des établissements d’enseignement et de recherche français ou étrangers, des laboratoires publics ou privés.
high cycle fatigue behavior of additive manufactured
stainless steel 316L : free surface effect and
microstructural heterogeneity
Xiaoyu Liang
To cite this version:
Xiaoyu Liang. high cycle fatigue behavior of additive manufactured stainless steel 316L : free surface effect and microstructural heterogeneity. Materials. HESAM Université, 2020. English. �NNT : 2020HESAE017�. �tel-02951486�
i
ÉCOLE DOCTORALE SCIENCES DES MÉTIERS DE L’INGÉNIEUR
[LAMPA – Campus de Angers]
THÈSE
présentée par :
Xiaoyu LIANG
soutenue le : 09 Juillet 2020pour obtenir le grade de :
Docteur d’HESAM Université
préparée à :École Nationale Supérieure d’Arts et Métiers
Spécialité : Mécanique-Matériaux
High cycle fatigue behavior of additive
manufactured stainless steel 316L: free
surface effect and microstructural
heterogeneity
THÈSE dirigée par :
Prof. MOREL Franck
et co-encadrée par :
Dr. ROBERT Camille et Dr. HOR Anis
Jury
Mme. Catherine MABRU, Professeure des Universités, ISAE-SUPAERO Présidente M. Eric CHARKALUK, Directeur de Recherche CNRS, Ecole Polytechnique Rapporteur M. Yves NADOT, Professeur des Universités, ISAE ENSMA Rapporteur M. Mehdi SALEM, Ingénieur de Recherche, Ecole des Mines d'Albi-Carmaux Examinateur M. Franck MOREL, Professeur des Universités, Arts et Métiers - Centre d’Angers Examinateur M. Camille ROBERT, Ingénieur de Recherche, Arts et Métiers - Centre d’Angers Examinateur M. Anis HOR, Maître de Conférence, ISAE-SUPAERO Examinateur
M. Luis REIS, Professeur, University of Lisbon Invité
T
H
È
S
E
i
Acknowledgement
Firstly, I would like to express my deepest gratitude to my supervisor Franck MOREL for the continuous support of my PhD stud, for his patience, motivation, and immense knowledge. His guidance helped me in all the time of research and writing of this thesis.
I wish to express my sincere appreciation to my co-supervisors Camille ROBERT and Anis HOR for the many selfless hours of their time that they have given on my behalf without which this work would not have materialized.
I would like to thank Catherine MABRU who has done me the honor of being the president of the jury of my thesis. I would like to thank Eric CHARKALUK and Yves NADOT, my two examiners of thesis, for their well-directed support and meticulous reading of my dissertation. I am really touched and thankful for their time and patience in reading carefully my manuscript. I would like to give my thanks to Mehdi SALEM and Luis REIS, my other jury members, for their time and their valuable advices. Especially, the help from Dr. SALEM for certain experiments is acknowledged. I am also indebted to Etienne PESSARD, who is my committee member with Prof. NADOT, for his suggestion and support. I wish to thank all the people whose assistance was a milestone in the completion of my research: Nikita DOROFEEV, Marco SCARPETTA, Nicolas CHAMBRIN, Linamaria GALLEGOS, Idriss TIBA, Daniel BELLETT.
I would also like to express my great appreciate to the colleagues of LAMPA for a lot of happy moments and giving me this agreeable and unforgettable memory: Rou, Hela, Bessam, Siti, Hugo, Benoit, Driss, Houssem, Racha, Sana, Amandine, Antoine, Vincent, Viet-duc, Foued, …
I appreciate the financial support from China Scholarship Council during the first three years of my PhD study.
I would like to thank my parents and my sister for supporting me throughout writing this thesis and my life in general.
In the end, I would like to dedicate this dissertation to my small family: my wife Xiaodong WANG, my daughter Yilian, my cat Wanzi and myself.
“For many a lonely day sailed across the milky seas Ne'er looked back, never feared, never cried”
iii
Contents
Acknowledgement ... i
Contents ... iii
List of figures ... vii
List of tables ... xv
Résumé étendu ... xvii
Introduction ... 1
Literature research ... 5
I.1. Generality ... 6
I.1.1. Selective laser melting of additive manufacturing ... 6
I.1.2. High cycle fatigue... 9
I.1.3. Stainless steel 316L ... 10
I.2. The state-of-the-art research about fatigue behavior of SLM SS 316L ... 12
I.2.1. Effect of surface finish ... 13
I.2.2. Effect of heat treatment ... 18
I.2.3. Effect of building direction ... 21
I.2.4. Effect of processing parameters ... 23
I.2.5. Discussion ... 25
I.3. Summary ... 26
Syntheses ... 28
Material preparation and characterization ... 29
II.1. Specimens elaboration ... 30
II.1.1. Powder characterization ... 30
II.1.2. Fabrication of specimens ... 33
II.1.3. Heat treatment ... 35
II.2. Microstructural characterization ... 38
II.2.1. Macrostructure of the SLM SS 316L ... 39
II.2.2. Microstructure of the SLM SS 316L ... 41
II.2.3. Grain morphology and Crystallographic texture ... 44
iv
II.3.1. Surface state characterization ... 48
II.3.2. Porosity characterization ... 51
II.4. Mechanical behavior ... 54
II.4.1. Hardness ... 54
II.4.2. Monotonic tensile test... 55
II.4.3. Cyclic tensile test ... 59
II.5. Conclusions ... 63
Syntheses ... 65
Fatigue experiments and analysis ... 67
III.1. Experimental fatigue test set-ups and conditions ... 68
III.1.1. Tensile fatigue tests ... 68
III.1.2. Bending and torsional fatigue tests ... 68
III.1.3. Surface preparation ... 70
III.2. Fatigue strength results and analysis ... 71
III.2.1. S-N curves ... 71
III.2.2. Effect of the surface state ... 73
III.2.3. Effect of loading type ... 73
III.2.4. Discussion... 74
III.3. Fractographic analysis ... 76
III.3.1. Bending samples ... 76
III.3.2. Torsion samples ... 84
III.3.3. Summary... 90
III.4. Correlation between defect size and HCF strength ... 90
III.4.1. Defect measurement ... 90
III.4.2. Kitagawa-Takahashi diagram ... 92
III.5. Conclusions ... 95
Syntheses ... 97
Preliminary investigations on the high cycle fatigue sensitivity to microstructure and defect ... 98
v
IV.2. Explicit microstructure model and fatigue prediction approach ... 102
IV.2.1. Finite element model ... 102
IV.2.2. Material constitutive laws and fatigue approach ... 104
IV.3. Results ... 110
IV.3.1. Application and evaluation of non-local method based on experimental results 110 IV.3.2. Further investigation of the non-local method on the microstructure effect ... 118
IV.4. Conclusions ... 124
Synthesis ... 126
Numerical study of the effect of roughness and porosity on the HCF performance of AM 316L ... 127
V.1. Preparatory investigations on the modeling of SLM steel 316L ... 129
V.1.1. Crystallographic orientation & grain morphology ... 130
V.1.2. Surface roughness & Pores ... 136
V.2. Modeling configurations ... 141
V.2.1. Design of geometrical models ... 141
V.2.2. Constitutive models ... 144
V.2.3. Loading condition ... 148
V.2.4. Fatigue criteria ... 148
V.3. Fatigue simulations of smooth models ... 148
V.3.1. Discussion on the experimental reference for simulation... 148
V.3.2. Statistical method for microstructural heterogeneity ... 149
V.3.3. Investigations on R* ... 155
V.4. Fatigue simulations using models with roughness and defects ... 159
V.4.1. Models with artificial semi-ellipsoidal defects ... 159
V.4.2. Models with roughness ... 162
V.4.3. Models containing artificial defect and roughness ... 169
V.5. Role of plasticity in fatigue simulation... 172
V.5.1. Comparisons between elastic and plastic constitutive models in smooth models ... 172
V.5.2. Comparisons between elastic and plastic predictions in defective models ... 174
vi
V.6. Conclusions ... 177
Syntheses ... 179
Conclusions and prospects ... 180
References ... 183
Appendix A. Experimental data of vertically fabricated SLM 316L high cycle fatigue tests ... 195
A.1. Staircase method ... 195
A.2. Tensile fatigue tests ... 196
A.3. Torsional fatigue tests... 198
A.4. Bending fatigue tests ... 201
Appendix B. Mesh convergence test ... 205
Appendix C. Application of the neighbor layer method ... 207
C.1. Smooth models ... 207
C.2. Models with artificial semi-ellipsoidal defects ... 208
C.3. Roughness models ... 210
C.4. Combined models ... 211
Résumé substantiel ... 213
Chapitre I. Bibliographie ... 217
Chapitre II. Fabrication et caractérisation du matériau de l’étude ... 224
Chapitre III. Les expériences et analyses sur la tenue en fatigue ... 239
Chapitre IV. Etude préliminaire de l’effet de la microstructure et des défauts sur la tenue en fatigue ... 251
Chapitre V. Etude numérique de l’effet de la rugosité et de la porosité sur les performances en fatigue du 316L SLM ... 264
vii
List of figures
Figure I-1: Comparison of AM processes in terms of deposition rate and precision of features ... 7 Figure I-2: Schematic illustrations of the SLM process (Patterson, Messimer and Farrington, 2017) ... 8 Figure I-3: Diagram of the various domains of fatigue and highlighting of the dispersion at low amplitudes of stress. (Guilhem, 2011) ... 10 Figure I-4: Customized removable partial dentures made from SLM SS 316L (Almufleh et al., 2018) ..
... 11 Figure I-5: (A-C) fatigue crack initiates from internal defect; (D-E) fatigue crack initiates from surface defect (Solberg et al., 2019) in a SLM SS 316L under cyclic tension loading ... 14 Figure I-6: S-N plots of vertically built SLM 316L under loading at R=0.1 with different surface treatments ... 15 Figure I-7: Fracture surfaces of as-built sample [σa =350 MPa, 28161 cycles] (a) (b) (Elangeswaran et al., 2019) ... 16
Figure I-8: Fracture surfaces of a machined sample [σa =350 MPa, 254980 cycles] (a) (b) (Elangeswaran et al., 2019) ... 16
Figure I-9: LoF defects responsible for crack initiation and failure in machined specimens fabricated vertically (Shrestha, Simsiriwong and Shamsaei, 2019) ... 17 Figure I-10: S-N plots for vertically built SLM 316L under loading at R=-1 with different surface treatment ... 17 Figure I-11: S–N curves for machined SLM processed 316L specimens under different heat treatments (Leuders et al., 2014) ... 19 Figure I-12: EBSD inverse pole figure (IPF) maps for (a) as-built 316L specimens, (b) 316L following heat treatment for 2 h at 650 °C and (c) HIP processing. Orientations in the IPF maps have been plotted with respect to building direction (BD). (Riemer et al., 2014) ... 19 Figure I-13: S-N plots of DMLS 316L in bending fatigue at a frequency of 25 Hz with regards to building direction (Mower and Long, 2016) ... 21 Figure I-14: (a) S-N curves for differently oriented specimens; (b) Light optical micrographs and EBSD-mappings of SLM-H (a, d), SLM-45 (b, e) and SLM-V specimens (c, f). (Blinn et al., 2019) ... 22 Figure I-15: Strain-life fatigue data along with Coffin-Manson fits for LB-PBF SS 316L specimens in (a) machined vertical, diagonal, and horizontal directions(Shrestha, Simsiriwong and Shamsaei, 2019)
... 23 Figure I-16: S-N curves of SS 316L samples with different laser powers (Zhang et al., 2017) ... 24 Figure I-17: (a) Mechanical (b) and fatigue properties of SS 316L samples (Zhang et al., 2017)... 24
viii
Figure I-18: (a) Variation of Maximum stress at failure (MPa) with internal porosity fraction (%); (b) Kitagawa diagram of all the samples tested (Andreau, Pessard, et al., 2019) (A, B, C represent different
scanning speeds) ... 25
Figure II-1: Particle size distribution of 316L powder Prismadd12 ... 31
Figure II-2: Powder of steel 316L under microscope: (a) SEM (b) SE detector (topography) (c) with BSE detector (chemical contrast) ... 32
Figure II-3: Powder structure (after chemical attack) ... 32
Figure II-4: (a) SLM machine (3D system ® ProX 320) and (b) fabricated tray of specimens ... 34
Figure II-5: Geometries of specimens (dimensions in mm): (a) Characterization specimens (microstructure); (b) Tension specimens (cyclic behavior and fatigue); (c) Bending specimens (fatigue); (d) Torsion specimens (fatigue)... 35
Figure II-6:The temperature-time curve of stress relief heat treatment ... 36
Figure II-7: (a) Example of a diffraction peak obtained after a counting time of 60 seconds in a given direction and (b) example of fitting by the sin2(𝜓) method... 37
Figure II-8: Location of the residual stress measures on the torsion and bending samples ... 37
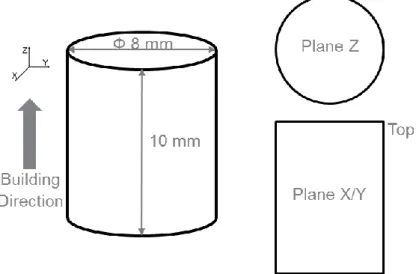
Figure II-9: Illustration of microstructure observation planes. ... 39
Figure II-10: Optical microscope observation on lasing plane Z ... 40
Figure II-11: Optical microscope observations on plane X/Y ... 41
Figure II-12: SEM observations in the plane Z ... 42
Figure II-13: SEM observations in the plane X/Y (long chemical attack) ... 43
Figure II-14: dendritic cellular network in SLM SS 316L ... 44
Figure II-15: Observation positions with the EBSD technique ... 44
Figure II-16: Post-treated EBSD mapping of the Z-plane ... 45
Figure II-17: Post-treated EBSD mappings of the X/Y-plane ... 45
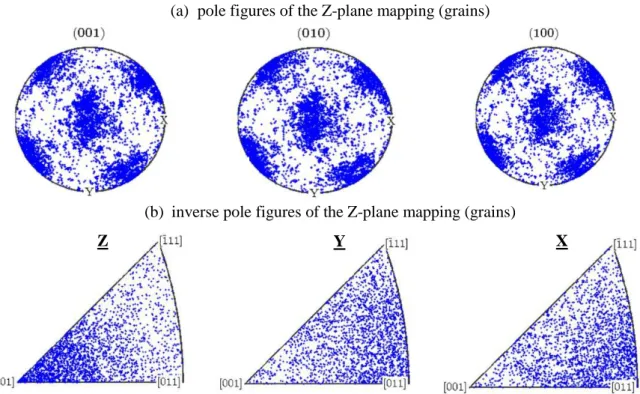
Figure II-18: (a) pole figures and (b) inverse pole figures representing the mean orientations of the grains observed in the mapping of Z-plane. ... 46
Figure II-19: (a) EBSD Maps and (b) optical micrographs of SS 316L obtained by SLM (Andreau, Koutiri, et al., 2019) ... 47
Figure II-20: Influence of the shape of the melt pools on the preferential orientation of the grains: (a) case of low energy density and (b) case of high energy density (Sun et al., 2019). ... 47
Figure II-21: (a) Effect of heat input on surface roughness and (b) effect of powder diameter on surface roughness (DebRoy et al., 2018) ... 49
Figure II-22: Surface roughness in sample No.15, Tray 1 ... 49
Figure II-23: Surface and linear roughness in (a) bending specimen and (b) torsion specimen ... 50
Figure II-24: Tomography in Z-plane: (a) slice No.250 (b) superimposing all slices ... 52
ix
Figure II-26: Histogram and cumulative percentage of porosity of measured samples: (a) Tray1 - S3 -
Porosity 0.0035%; (b) Tray2 - S5 - Porosity 0.026% ... 53
Figure II-27: Defects observations by SEM : (a) un-melted powder, (b) lack of powder and (c) pore formed between the particles of powder. ... 54
Figure II-28: Measured micro-hardness in an SLM sample ... 55
Figure II-29: Machined used in tensile test (MTS 809) ... 56
Figure II-30: Comparison between extensometer and gauge extensometer in tension for the polished specimen ... 57
Figure II-31: Tension curves for the raw surface specimen (red) and for the polished surface specimen (blue). ... 57
Figure II-32: Estimated Young’s modulus of (a) as-built sample and (b) total-polished sample ... 58
Figure II-33: S-N curve of 316L under tension loading in LCF domain... 60
Figure II-34: Stress-strain curves under cyclic tension-compression at E=0.3%: (a) all cycles and (b) selected cycles. ... 61
Figure II-35: Stress-strain curves under cyclic tension-compression at E=0.45%: (a) all cycles and (b) selected cycles. ... 61
Figure II-36: Stress-strain curves under cyclic tension-compression at E=0.6%: (a) all cycles and (b) selected cycles. ... 61
Figure II-37: Stress-strain curves under cyclic tension-compression at E=0.75%: (a) all cycles and (b) selected cycles. ... 62
Figure II-38: Half-life cycles of different loadings ... 62
Figure II-39: Cyclic softening curves under different cyclic deformations ... 63
Figure III-1: Bending and torsional fatigue test machine (Rumul ® CrackTronic) ... 69
Figure III-2: Frequency evolution along a bending fatigue test carried out with a Rumul® CrackTronic machine. The experiment is stopped when the frequency drop reaches 0.1 Hz. ... 69
Figure III-3: Bending specimens after different preparations: (a) as-built and (b) simple-polished ... 71
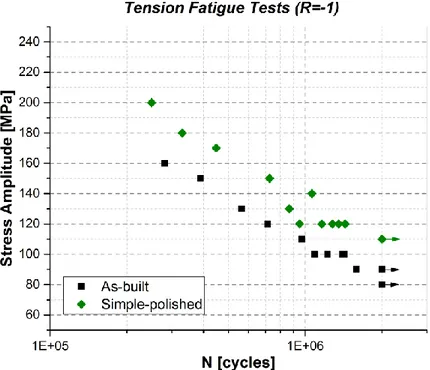
Figure III-4: S-N curves for two surface state conditions (As-built and Simple-polished) in fully reversed uniaxial tension/compression ... 71
Figure III-5: S-N curves for three surface state conditions (As-built, Simple-polished and Total-polished) in fully reversed plane bending. The fatigue test results for machined specimens of wrought 316L steel are also given for comparison. ... 72
Figure III-6: S-N curves for three surface state conditions (As-built, Simple-polished and Total-polished) in fully reversed torsion ... 72
Figure III-7: SEM observations on fatigue crack initiation site(s): (a) single defect at one initiation site; (b) several defects at two initiation sites ... 77
Figure III-8: (a) Elongated shaped defect (b) and irregular shaped defect at fatigue crack initiation site ... 78
x
Figure III-9: Fracture surface of specimen P1-S5 (scenario of fatigue crack initiation and growth is not
clear) ... 78
Figure III-10: Two independent fatigue crack initiation sites in specimen (P1-S16) ... 79
Figure III-11: Parallel adjacent defects observed in simple-polished specimens ... 80
Figure III-12: Defects observed on the as-built lateral surface of simple-polished bending specimens: (a) a combination of roughness and pores; (b) parallel adjacent defects ... 80
Figure III-13: Representative crack initiation site in as-built specimen: (a) in the middle of top surface; (b) in the edge of top surface ... 82
Figure III-14: Morphology of defects in as-built specimens: (a) open-form defect; (b) subsurface defect ... 82
Figure III-15: The three fracture modes ... 85
Figure III-16: Representative fatigue crack path under torsion loading ... 85
Figure III-17: Macroscopic crack path in total-polished torsion specimen: stage I (mode II) followed by stage II (mode I) ... 86
Figure III-18: Fracture surfaces of total-polished specimen under torsion loading ... 86
Figure III-19: Secondary crack in the total-polished specimen under torsion loading ... 87
Figure III-20: Example of the fatigue crack initiation and growth mechanism from defect under torsional loading. Two stages are clearly visible. ... 87
Figure III-21: Fracture surface observation on the simple-polished torsional specimen ... 88
Figure III-22: Surface state of an as-built torsion specimen ... 88
Figure III-23: Crack path in an as-built torsional specimen ... 89
Figure III-24: Defects at the origin of failure in as-built torsion specimens: (a) a series of surface defects; (b) two clustering subsurface defects ... 89
Figure III-25: Different methods proposed to measure irregular defect(s) (HOURIA, 2015; Le et al., 2018; El Khoukhi et al., 2019; Romano, Miccoli and Beretta, 2019) ... 91
Figure III-26: Two different measurement techniques to assess the size of a cluster of adjacent defects ... 92
Figure III-27: Kitagawa diagram using the minimalist measurement methods with different parameters as effective defect size: (a) depth, (b) Feret diameter, (c) Murakami parameter, (d) modified Feret diameter ... 93
Figure III-28: Kitagawa diagram using the maximalist measurement methods with different parameters as effective defect size: (a) depth, (b) Feret diameter, (c) Murakami parameter, (d) modified Feret diameter ... 94
Figure IV-1: Example of finite element models used... 103
Figure IV-2: Pole figures of (a) 100, (b) 111 orientation for the crystallographic orientations implanted in numerical models ... 104
xi
Figure IV-3: Comparison of the maximal shear stress (a) between isotropic elasticity (Iso. E.) and cubic elasticity (Cub. E.). and (b) between cubic elasticity (Cub. E.) and cubic elasticity + crystal plasticity (Cub. E. + CP.) (Robert et al., 2012) ... 106 Figure IV-4: Schematic illustrations of non-local methods: (a) critical radius method and (b) neighbor layer method ... 109 Figure IV-5: FE models containing semi-circular defects with radii of 5,15,30,60,120,200 µm respectively ... 110 Figure IV-6: Von Mises equivalent stress fields in numerical models with same microstructure configuration but different defect size: (a) 5µm; (b) 15µm; (c) 30µm; (d) 60µm; (e) 120µm; (f) 200 µm
... 111 Figure IV-7: Distribution of maximum local stress concentration factor in models with different microstructures but same defect size (defect size as legend) ... 112 Figure IV-8: Distributions of grain-average hydrostatic stress amplitude and shear stress amplitude in numerical models with same microstructure configuration but different defect size: (a) 5µm; (b) 15µm; (c) 30µm; (d) 60µm; (e) 120µm; (f) 200 µm ... 113 Figure IV-9: Results of the fatigue tests conducted on the 316L steel in uniaxial tension and torsion with a loading ratio R =-1 (Guerchais et al., 2015) ... 114 Figure IV-10: Kitagawa-Takahashi diagrams of local fatigue indicating parameters ... 114 Figure IV-11: Normalized Kitagawa-Takahashi diagrams with the application of (a) critical radius Dang Van criterion;(b) neighbor layer Dang Van criterion;(c) critical radius Matake criterion; (d) neighbor layer Matake criterion; (e)critical radius Papadopoulos criterion; (f) neighbor layer Papadopoulos criterion ... 115 Figure IV-12: Fatigue limit intervals of 96 models containing the same defect but different microstructure from the criteria: Dang Van, Matake, Papadopoulos. (a) critical radius method (b) neighbor layer method ... 117 Figure IV-13: Fatigue limit intervals of 24 models containing the same defects and grain shapes but different grain orientations from the criterion: Dang Van. (a) critical radius method (b) neighbor layer method ... 118 Figure IV-14: Histograms of grain size for different grain morphology configurations: (a) Gaussian distributed Voronoi polygon (b) uniform distributed quadrangle (c) log-normal distributed Voronoi 1 (d) log-normal distributed Voronoi 2 ... 119 Figure IV-15: Illustrations of different grain morphology configurations: (a) Gaussian distributed Voronoi polygon (b) uniform distributed quadrangle (c) normal distributed Voronoi 1 (d) log-normal distributed Voronoi 2 ... 120 Figure IV-16: Fatigue limit intervals of 24 models containing same defects but different grain morphology from (a) critical radius Dang Van criterion;(b) neighbor layer Dang Van criterion;(c) critical
xii
radius Matake criterion; (d) neighbor layer Matake criterion; (e)critical radius Papadopoulos criterion;
(f) neighbor layer Papadopoulos criterion ... 121
Figure IV-17: Effective areas of critical radius method and neighbor layer method in different studied microstructures: (a) uniform distributed grains and (b) log-normal distributed grains ... 122
Figure IV-18: Illustrations of different grain size configurations: (a) 30 µm; (b)100 µm ... 122
Figure IV-19: Relationship between grain size and effective crack length (replot from (El Haddad, Smith and Topper, 1979)) ... 123
Figure IV-20: Effective defect sizes for different average grain size configurations of proposed realizations of non-local method and pre-fixed parameter values ... 124
Figure V-1: BC maps of SLM 316L: (a) bottom (b) top (c) middle part of the sample ... 131
Figure V-2: Ellipticity measurement of EBSD map (top area of the sample) ... 132
Figure V-3: Theoretical log-normal distribution and empirical distributions of grain size... 133
Figure V-4: Comparison of theoretical log-normal distribution curve and probability density of grain size of generated models ... 133
Figure V-5: Calculated Young’s moduli for 24 realistic textured grain orientations sets generated randomly ... 135
Figure V-6: Pole figures in direction 100, 110 and 111 of employed orientation sets ... 136
Figure V-7: Schematic illustration of several surface roughness parameters (adapted from (Tekçe et al., 2018)) ... 137
Figure V-8: Selected roughness profiles ... 138
Figure V-9: Reconstructed pores detected by µCT ... 139
Figure V-10: Histogram and kernel density estimation curve of pores’ sizes ... 139
Figure V-11: Schematic illustration of designing imitating LoF defect in the numerical model(*: adapted from (Mergulhão and Das Neves, 2018)) ... 140
Figure V-12: Illustrations of 5 tessellations involved in the numerical model ... 142
Figure V-13: Different types of defective models (zoom view of the local top surface) ... 143
Figure V-14: Comparison between the experimental responses of 316L steel under different imposed amplitudes and the predictions of the crystal plasticity model ... 148
Figure V-15: Von Mises stress distribution in a smooth polycrystalline model subjected to a tension loading of 100 MPa ... 150
Figure V-16: Scatter maps of hydrostatic stress and maximum shear stress (a) from every element or (b) from every grain in a polycrystal FE model ... 152
Figure V-17: Evolution of the median of the extreme value distributions of Dang Van FIP as a function of loading conditions. The black dots correspond to the median (probability of 0.5), the two limits of the interval correspond to a probability of 0:1 and 0:9 (i.e. 80% of the results are within this interval).(Hor et al., 2014) ... 153
xiii
Figure V-18: GEV fitting for predicted fatigue limits using Dang Van criterion from different tessellated polycrystal models: (a) Quadrangle (b) Voronoi ... 154 Figure V-19: Scatter map of the two components in Dang Van criterion from the critical grains in 100 instantiations ... 155 Figure V-20: Dang Van stress distributions with respect to different non-local parameters in a smooth polycrystalline model subjected to a tension loading of 100 MPa ... 156 Figure V-21: PDF and CDF curves fitting the stochastic responses of FIP in polycrystalline models with different microstructural configurations using R*= 60 µm ... 156 Figure V-22: Scattered predicted fatigue limits from three fatigue criteria((a) Matake; (b) Dang Van; (c) Papadopoulos) regarding texture types and categorized by the tessellation type ... 158 Figure V-23: Distributions of the non-local fatigue indicating parameters (Dang Van (R*=60µm)) in non-textured and textured numerical models under tension loading of 100 MPa ... 161 Figure V-24: Non-local Dang Van stresses using different R* (15, 30, 45 and 60 µm) for a log-normal Voronoi-polygon-tessellated model with roughness ... 163 Figure V-25: Distributions of three non-local FIPs (Dang Van, Matake, Papadopoulos) with R*=60 µm in models with roughness under cyclic tension loading ... 164 Figure V-26: Histograms and fitted Weibull distribution curves of predicted fatigue limits using different non-local parameter values for stochastic configured polycrystalline models ... 165 Figure V-27: Medium values of predicted fatigue limits using different non-local FIPs with respect to different roughness profiles ... 166 Figure V-28: Distributions of non-local Dang Van stress and roughness profiles for model P3 and model P4 ... 167 Figure V-29: Predicted fatigue limit of models containing surface roughness versus roughness characteristic parameters ... 168 Figure V-30: Distributions of FIP (non-local Dang Van stress with R* = 30 µm) of models with the same microstructure configurations (morphology and orientation of grain) but different defect(s): (a) surface roughness, (b) LoF defects, (c) surface roughness + LoF defects ... 170 Figure V-31: Predictions of fatigue limit from Dang Van criterion using different values of R* categorized by the tessellation type (2 log-normal distributed Voronoi tessellations:LN_V1, LN_V2 and 1 quadrangle tessellation: Q2) ... 171 Figure V-32: Distribution of plastic strain in a smooth polycrystal aggregate with isotropic texture after a cyclic tension loading at 232 MPa ... 172 Figure V-33: Distribution of the difference of von Mises stress between elastic constitutive model and plastic constitutive model in a smooth polycrystal aggregate with isotropic texture in the most stressed timestep in the last cycle of a cyclic tension loading at 232 MPa ... 173
xiv
Figure V-34: Distribution of the Dang Van stress (R*=60 µm) in smooth polycrystal aggregates using plastic and elastic constitutive models respectively with isotropic texture after a cyclic tension loading at 232 MPa ... 173 Figure V-35: Distribution of the Dang Van stress (R*=60 µm) in smooth polycrystal aggregates using plastic and elastic constitutive models respectively with realistic texture after a cyclic tension loading at 232 MPa ... 174 Figure V-36: Distribution of the Dang Van stress (R*=60 µm) in defective polycrystal aggregates using plastic and elastic constitutive models respectively with realistic texture after a cyclic tension loading at 150 MPa ... 175
Figure C-1: Comparisons of predicted fatigue limit intervals under tension loading using different N* values for non-local Dang Van criterion ... 208 Figure C-2: Distributions of the local fatigue indicating parameters (Dang Van (N*=4)) in non-textured and non-textured numerical models under tension loading of 100 MPa ... 209 Figure C-3: Non-local Dang Van stresses using different N* (1, 2, 3,4 and 5) from a log-normal Voronoi-polygon-tessellated model with roughness ... 210 Figure C-4: Predictions of fatigue limit from Dang Van criterion using the neighbor layer method . 211
xv
List of tables
Table I-1: Chemical compositions of SS 316L ... 12
Table I-2: Mechanical properties of SLM SS 316L from 3D systems® ... 12
Table II-1: Nominal and measured chemical composition of 316L ... 31
Table II-2: SLM processing parameters for specimen’s fabrication ... 33
Table II-3: The parameters of residual stress analysis ... 36
Table II-4: Surface residual stress values after stress releasing heat treatment for the studied specimens. ... 38
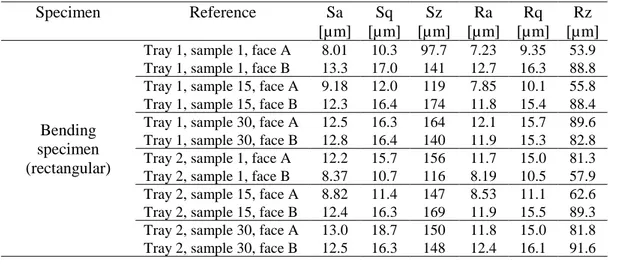
Table II-5: Surface and linear roughness parameters of measured samples. ... 50
Table II-6: Porosity of the samples measured ... 54
Table II-7: Macro-hardness of tested specimens ... 55
Table II-8: Manufacturer and literature data of the mechanical properties in uniaxial tension of SS 316L obtained by SLM. ... 59
Table II-9: Low cycle tension-compression fatigue tests ... 60
Table III-1: Fatigue strength values assessed with the staircase method for different surface state conditions and different loading modes ... 73
Table III-2: Positions of crack initiation sites in simple-polished specimens ... 79
Table III-3: Summary of fractography observations on all the tested samples ... 84
Table IV-1: Characteristics summary of the different configured model... 104
Table IV-2: Parameters of the constitutive models ... 106
Table IV-3: Parameters of the fatigue criteria for a 316L steel ... 108
Table IV-4: Local stress concentration factor with respect to different defect radius ... 112
Table IV-5: Experimental results for defective steel 316L ... 116
Table V-1: Calculated Young’s moduli and Poisson ratios for different sampling areas of EBSD specimen ... 134
Table V-2: Characteristic roughness parameters of the 5 selected profiles ... 138
Table V-3: Statistical information of detected pores ... 140
Table V-4: Configurations of the models employed in the simulations ... 142
Table V-5: Isotropic elastic constitutive model parameters for studied 316L steel with regards to the different texture configuration ... 144
Table V-6: Interaction matrix of FCC structure and the associated slip systems ... 146
Table V-7: Searched intervals of objective parameters ... 147
Table V-8: Identified parameters of the Méric&Cailletaud crystal plasticity constitutive model... 147
xvi
Table V-10: Median values of predicted fatigue limits from models with the same type of loading,
tessellation and orientation using non-local criteria (R*=60 µm) ... 158
Table V-11: Median values of predicted fatigue limits from models with the same type of loading, tessellation and orientation using Dang Van criterion with different values of R* ... 159
Table V-12: Mean values of predicted fatigue limits from models containing geometrical defects with the same type of loading, tessellation and orientation using non-local Dang Van criterion (R*=60 µm) ... 162
Table V-13: Predictions from a crystal plasticity model and a purely elastic model under a cyclic tension loading at 150 MPa... 175
Table V-14: Predictions from a crystal plasticity model and a purely elastic model under a cyclic tension loading at 90 MPa... 176
Table V-15: Predictions from a crystal plasticity model and a purely elastic model under a cyclic tension loading at 120 MPa... 176
Table A-1: Staircase method for as-built and simple-polished tensile specimens ... 196
Table A-2: Parameters identification of staircase method for as-built and simple-polished tensile specimens ... 196
Table A-3: Summary of all the tensile fatigue tests conducted ... 198
Table A-4: Staircase method for as-built, simple-polished, and total polished torsional specimens .. 198
Table A-5: Parameters identification of staircase method for as-built, simple-polished, and total polished torsional specimens ... 199
Table A-7: Staircase method for all bending specimens ... 201
Table A-8: Staircase method calculations for all bending specimens ... 202
Table A-9: Summary of all the bending fatigue tests conducted ... 203
Table B-1: Comparison of different mesh qualities ... 205
Table C-1: Mean values of predicted fatigue limits from models containing geometrical defects with same type of loading, tessellation and orientation using Neighbor layer Dang Van criterion ... 210
xvii
Résumé étendu
Ces travaux de thèse de doctorat s'inscrivent dans le cadre de l’étude de la Fatigue à Grand Nombre de Cycles (FGNC) de l'acier 316L obtenu par Fabrication Additive (FA). Ils comportent deux volets bien distincts mais complémentaires portant pour le premier sur une caractérisation expérimentale du comportement en fatigue et pour le second sur la modélisation par la méthode des éléments finis des effets de la microstructure, de la microgéométrie de surface et des défauts.
Le Chapitre I est consacré à une revue bibliographique relative aux aspects clés de l’étude. La technique de FA, en particulier le procédé SLM (Selective Laser Melting), la FGNC et l'acier inoxydable 316L sont passés en revue pour préciser le contexte des travaux.
Des résultats expérimentaux récents de la littérature sont présentés. De nombreux facteurs interviennent dans les conditions d’amorçage des fissures de fatigue au sein de l’acier 316L SLM SS (Stainless Steel). Le facteur le plus étudié est l’état de surface. Les pièces brutes de fabrication présentent un état de surface caractérisé par une forte rugosité, considérée comme très néfaste à la résistance en fatigue. Il est confirmé que les pièces brutes ont des mauvaises performances en fatigue tandis que l'usinage ou le polissage des pièces obtenues par FA permettent d’augmenter les caractéristiques mécaniques notamment en fatigue. En ce qui concerne l’effet des traitements thermiques, les avis divergent. La microstructure semble être notamment modifiée par le traitement HIP (Hot Isostatic
Pressing) mais la résistance en fatigue dans le régime FGNC ne semble parfois pas être affectée. On
constate que la direction de fabrication qui modifie la texture cristallographique influence également le comportement à la fatigue. Il faut néanmoins être conscient du fait que les résultats présentés dans les différentes publications disponibles ne correspondent pas nécessairement aux mêmes paramètres de procédé. Des recherches récentes démontrent par exemple que la densité laser utilisée peut entraîner des performances en fatigue très différentes.
D’après les éléments disponibles dans la littérature sur le 316L SLM, il ne fait aucun doute que les défauts associés à la surface ainsi que certains paramètres microstructuraux comme la texture possèdent un impact considérable sur la réponse en fatigue.
Les travaux proposés dans ce projet de thèse visent à conduire une étude approfondie de ces deux paramètres tant du point de vue expérimentale que de la simulation.
Le Chapitre II est consacré à la description des conditions expérimentales et de certaines des propriétés de l’acier SLM SS 316L étudié. La démarche adoptée consiste en une maîtrise complète des étapes de préparation, fabrication et caractérisation des échantillons obtenus par la technique de SLM.
xviii
On se penche à la fois sur la caractérisation de la poudre utilisée pour la fabrication mais également sur les caractéristiques microstructurales des pièces fabriquées. Les défauts inhérents au procédé de fabrication additive sont mesurés et analysés. En plus des identifications mentionnées, des essais mécaniques de traction monotone et cyclique ainsi que des tests de dureté sont conduits et analysés.
Il est important de préciser que toutes les éprouvettes sont fabriquées verticalement et que des mesures des contraintes résiduelles effectuées après le traitement thermique de détensionnement appliqué montrent que certaines contraintes résiduelles peuvent subsister.
Des observations microscopiques montrent la présence de défauts et la tomographie μCT met en évidence la présence de pores. On constate également que le matériau est fortement texturé, avec des grains d'austénite allongés le long de l'axe de fabrication. Des scans EBSD (Electron BackScatter
Diffraction) permettent d’accéder au type de texture cristallographique en jeu. Des mesures de rugosité
de surface sur les échantillons bruts montrent que le niveau de rugosité (Rz) peut dépasser 200 μm. Des mesures de dureté montrent que la dureté du SLM SS 316L se situe dans la plage 220-250 HV, ce qui est cohérent avec les données du SS 316L corroyé. En traction monotone, les caractéristiques recueillies sont proches de celles obtenues pour le 316L corroyé en matière d'UTS et d’allongement à rupture. Le module de Young est néanmoins bien plus faible avec une valeur aux alentours de 150 GPa. Afin de caractériser le comportement à l’écrouissage cyclique, des tests en traction-compression sous chargement cyclique sont conduits à quatre niveaux de déformation totale imposés : ± 0,30%, ± 0,45%, ± 0,60%, ± 0,75%. On observe une phase de durcissement rapide puis un adoucissement plus lent.
Les résultats des tests de fatigue sont présentés et analysés au Chapitre III. Les essais sont effectués en traction, flexion et torsion. Pour chaque condition de chargement, différents échantillons avec différents états de surface sont utilisés pour mieux appréhender l'effet de l'état de surface sur les performances en fatigue à grand nombre de cycles. Pour mieux comprendre le mécanisme d'amorçage des fissures de fatigue, des analyses fractographiques sont effectuées. Les défauts de type « Lack of Fusion » sont toujours à l’origine de l’amorçage des fissures. Les tailles des défauts observés sont ensuite mesurées et mises en regard avec les limites de fatigue correspondantes.
Il est très important de préciser qu’aucune étape de lasage de contour n’est appliquée dans cette étude. Les valeurs de rugosité de surface atteintes sont néanmoins cohérentes avec des données de la littérature où un lasage final de contour est adopté. Quoiqu’il en soit, de nombreux défauts de type LoF
(Lack-of-Fusion) sont observés sur les faciès de rupture à la surface ou en sous couche et sont à l’origine des
fissures de fatigue.
L'effet du gradient de contrainte n'est pas observé dans la présente étude car les résultats des tests de fatigue en flexion et en traction donnent des résultats similaires.
xix
Les résistances en fatigue observées sont globalement faibles (en comparaison des données de la littérature). Ces valeurs peuvent s’expliquer par l’absence de lasage de contour et par conséquent par la présence de nombreux défauts de type LoF.
En utilisant la théorie de Murakami, on montre que la diminution de la résistance à la fatigue est bien corrélée avec l'augmentation de la taille effective du défaut. Dans les zones d’amorçage, on constate souvent des chapelets de défauts de type LoF. Pour obtenir des résultats cohérents, il est nécessaire de tenir compte de l’ensemble des défauts dans la mesure de la taille du défaut qui intervient dans l’analyse en fatigue.
En raison de la présence en nombre des défauts de type LoF, il est difficile de connaître avec précision l’effet seul de la rugosité de surface sur les conditions d’amorçage des fissures de fatigue.
Le Chapitre IV porte sur la mise en place d’une démarche de simulation numérique visant à mieux comprendre les effets de défaut et de microstructure et ceci à travers une approche non locale. Les travaux présentés sont purement numériques et les résultats des prédictions sont comparés aux résultats expérimentaux de Guerchais (Guerchais et al., 2015). Un modèle éléments finis de microstructure virtuelle explicite est construit et utilisé. Les modifications des critères de fatigue par l'introduction de deux méthodes non locales sont expliquées et évaluées pour explorer qualitativement le lien entre la distance critique et la taille du défaut ou la microstructure. Pour mieux appréhender la portée des méthodes non locales proposées, certaines analyses concernant la morphologie et la taille des grains sont menées.
A l’aide des modèles éléments finis mis en place, la réponse mécanique locale à l’échelle des grains est obtenue. Il ressort de l'analyse mécanique que la microstructure introduit une forte hétérogénéité.
On montre cependant qu’une approche purement locale ne peut refléter correctement l'effet Kitagawa-Takahashi. Des résultats très conservatifs sont obtenus.
En introduisant une méthode non locale, une prédiction satisfaisante en fatigue tenant compte explicitement à la fois des défauts et de la microstructure peut être atteinte. La dispersion des résultats due aux hétérogénéités de microstructure est montrée et discutée. En particulier, pour le défaut de taille moyenne, la grande dispersion montre la compétition entre le défaut et la microstructure locale.
Trois critères de fatigue multi-axiaux exprimés en contraintes sont utilisés et évalués, Matake, Dang Van et Papadopoulos. Les trois critères sont à même, associée à l’approche non locale, de traduire l'effet Kitagawa-Takahashi. Le critère de Matake fournit toujours la limite de fatigue la plus élevée. Ceci doit être dû à l’utilisation de la contrainte normale dans l’expression du critère, au contraire des deux autres formulations qui font appel à la contrainte hydrostatique.
xx
Concernant les deux formulations possibles de la méthode non locale, la méthode de la couche voisine est plus sensible à la microstructure. Des diffusions plus fortes peuvent être observées dans les résultats de la méthode de la couche voisine par rapport à ceux de la méthode du rayon critique.
D'autres analyses portant sur la morphologie et la taille des grains montrent la différence entre la méthode du rayon critique et la méthode de la couche voisine. La sensibilité à la taille des grains dépend du modèle non local utilisé.
Le cadre d’une approche de modélisation et de simulation numérique sensible à la microstructure a été utilisé avec succès au chapitre 4 pour reproduire l'effet K-T dans le cas d’un SS 316L corroyé. L’objectif du Chapitre V est d’appliquer la même démarche pour mieux comprendre le comportement en fatigue du SLM SS 316L.
Pour construire un modèle éléments finis de microstructure explicite dédié au SLM SS 316L, il est important d’intégrer l’ensemble des informations relatives à la microstructure et aux défauts issu des caractérisations présentées aux chapitres 2 et 3. Les résultats des calculs éléments finis sont post-traités par les méthodes non locales et une méthode statistique est employée pour obtenir des prédictions de la tenue en fatigue.
Les effets de rugosité, des défauts de type LoF et de la microstructure sont discutés sur la base d'un grand nombre de simulations.
L'application d’un modèle de comportement en plasticité cristalline est présentée à la fin du chapitre pour confirmer que la plasticité a une influence négligeable sur les prédictions conduites à l’aide d’une approche non locale et d’un critère exprimé en contrainte.
Les simulations sont donc conduites à partir de modèles EF où des paramètres de texture cristallographique, de taille et forme de grain, de rugosité de surface réaliste, de défaut type LoF sont intégrés.
Parmi les nombreux résultats obtenus, on peut souligner que la morphologie des grains ne semble pas être un paramètre du premier ordre sur la réponse en fatigue. La texture cristallographique présente elle un effet bien plus marqué. Les quelques simulations conduites en présence d’un défaut de géométrie simplifiée laissent également à penser que les défauts de type LoF ont un impact très important sur le comportement en fatigue.
1
Introduction
Context
Endurance is always a major concern of the industry. Fatigue failures were firstly observed and investigated in the 19th century. Since then, continuous research has accumulated abundant data and
results. But a comprehensive understanding of the fatigue phenomenon is not yet achieved as the fast evolution of technologies brings out more new materials and new products. In this decade, Additive Manufacturing (AM) techniques undergo rapid advancements. The mechanical behavior of AM parts, particularly the fatigue behavior, becomes a concern for future industrial application. The AM materials, however, have distinguished mechanical properties compared to that of the conventional ones. More efforts are needed to complement the understandings, especially about the influences of inherent imperfect surface state and microstructure which is strongly dependent on the fabrication process of AM materials on fatigue behavior.
The present study is a continuation of several former pieces of research completed in the lab LAMPA (Laboratoire Angevin de Mécanique, Procédés et innovAtion). Mainly based on the numerical modeling solution given by Camille Robert, the experimental and numerical research about the effect of the defect on fatigue strength of wrought austenitic stainless steel 316L carried out by Raphael Guerchais, and the statistical analysis of fatigue indicator parameters done by Anis Hor, as well as the other related findings cumulated by the research team of the lab, this study will focus on the free surface effect of high cycle fatigue behavior of AM steels by experimental and numerical methods. Particularly, since the studied material is from the AM technique, the effect of microstructure will be assessed as well.
This research project is financially supported by the China Scholarship Council (CSC). The experimental part is realized in the lab ICA (Insititute Clément Ader) and the numerical part is completed in the lab LAMPA.
Objectives
The work presented in this dissertation deals with the fatigue behavior of additive manufactured metallic materials, particularly, of austenitic steel 316L in the context of high cycle fatigue (HCF) regime. Compared to the conventionally fabricated materials, the additive manufactured materials in as-built condition are distinguished by two main features: imperfect surface state and heterogeneous microstructure. AM material has an inevitable poor surface state which mainly originates from the inherent defects during the fabrication process, for instance, surface roughness, lack-of-fusion (LoF) defect, and gas-penetrated pore. These defects in AM parts are small in size and have an order of magnitude close to that of several grains. The influence of small defects on fatigue behavior is supposed to be connected with the microstructure, while the microstructure in AM products is often different from
2
that in conventional fabricated products. The objective is more precisely to study the effect of the stress concentration induced by inherent small defects and of the stress heterogeneity from the anisotropy of microstructure as well as their competitions.
Scientific approach
The investigations on exploring the high cycle fatigue behavior of selective laser melted (SLM) steel 316L are realized in both experimental and numerical ways.
The specimens are fabricated from recycled powder to be in line with industrial products. Contouring is intentionally prevented to represent the worst application scenario. Part of the specimens is kept in as-built condition while others are polished. Comprehensive fatigue tests are conducted in three loading modes including tension, bending and torsion. Because fracture surface observations show that fatigue failures are mainly caused by the lack-of-fusion defect, critical defects are measured and correlated with fatigue strengths based on the theory of Murakami.
A quasi-realistic explicit microstructure sensitive finite element model is then built up. The roughness profile comes from profilometry measurement. The microstructure is derived from data collected by EBSD observation. Multiaxial fatigue criterion combining non-local method is used. Simulated results are post-treated by a proper statistical method.
The layout of the thesis
This thesis is divided into 5 chapters.
A literature review of various important points for the understanding and orientation of the study is presented in the first chapter. General information concerning the three crucial aspects, namely, an advanced fabrication technique: selective laser melting; an industrial application interest: high cycle fatigue; and a widely used metallic material: stainless steel 316L, are introduced. Recent investigations on the fatigue behavior of selective laser melting stainless steel 316L are reviewed in different aspects.
Material preparation and characterization are presented in the second chapter. The fabrication process is described in detail from the powder to the specimens regarding powder characterization, specimens designing, fabrication process parameters, heat treatment, and mechanical treatment. The optical microscope, Scanning Electron Microscope (SEM) and Electron BackScatter Diffraction (EBSD) is used to characterize the microstructure of fabricated specimens. Profilometry and X ray tomography are conducted to measure the inherent defect in the as-built material. Typical mechanical experiments as the hardness test, monotonic tensile test, and cyclic tensile test are carried out and discussed.
The third chapter summarizes all conducted fatigue experiments. Experimental preparation of the fatigue test is presented. Staircase method is used to estimate fatigue limit under different configurations of surface treatment, loading mode, and building direction. The results are analyzed and discussed. Fracture surface observations of all tested specimens display typical fatigue-provoking defect patterns
3
in different surface situations. Modified Murakami method is used to quantitatively evaluate the relation between fatigue limit and inherent defect size.
A preliminary numerical study on defective material and based on 2D numerical simulations of polycrystalline aggregates is reported in the fourth chapter. The non-local method is introduced to an explicit microstructure model to resolve the problem in fatigue prediction raised by the complex stress state containing stress concentration and stress heterogeneity. Two different non-local method implementations are compared under different conditions. Kitagawa-Takahashi effect is reproduced on the defective models by both the proposed realizations of the non-local method.
The fifth chapter is devoted to a study of numerical simulations on quasi-realistic explicit microstructures of 316L austenitic steel in different surface states. Problems encountered during the establishment of the numerical polycrystalline aggregate model are discussed. The non-equiaxed grains are characterized by log-normal distributed Voronoi polygons. The strongly textured microstructure is represented by crystallographic grains with preferential directions. Roughness and porosity are examined numerically to be added to the numerical models. A statistical method based on generalized extreme value distribution is used to describe the stochasticity of microstructural attributes. Identification of the parameters in the plastic constitutive model is presented. Data from experiments are processed to create statistically representative numerical models. Simulations of differently configured microstructure are analyzed and discussed.
This dissertation ends with a conclusion summarizing the main results obtained during this study. Research perspectives aimed at improving the numerical methodology are proposed.
Literature research
I.1. Generality ... 6 I.1.1. Selective laser melting of additive manufacturing ... 6 I.1.2. High cycle fatigue... 9 I.1.3. Stainless steel 316L ... 10 I.2. The state-of-the-art research about fatigue behavior of SLM SS 316L ... 12 I.2.1. Effect of surface finish ... 13 R=0.1 ... 13 R=-1 ... 15 Summary ... 18 I.2.2. Effect of heat treatment ... 18 I.2.3. Effect of building direction ... 21 I.2.4. Effect of processing parameters ... 23 I.2.5. Discussion ... 25 I.3. Summary ... 26 Syntheses ... 28
Chapter I Literature research
6
I.1. Generality
This research project is under the context of the high cycle fatigue behavior of additive manufactured products. In this section, we give brief introductions of additive manufacturing and fatigue phenomenon as well as the studied material – austenitic stainless steel (SS) 316L.
I.1.1. Selective laser melting of additive manufacturing
Additive Manufacturing (AM) refers to the fabrication process where the solid object is made from numerical model by adding material together in contrast to the material-removing traditional technique such as machining. In the past two decades, AM technology has achieved rapid development. A series of terms were used, such as “Rapid prototyping”, “3D printing” and “Solid free-form fabrication”, which describe the characteristics of the technology from different aspects. Additive manufacturing can intervene at any point in a product's life: pre-production (Rapid prototyping), large scale production (rapid manufacturing) or repair (reload) for its advantages over the conventional fabrication methods: flexibility without fixed tool requirement, the possibility of mass customization, short production times, and manufacture of very complex shapes. The material-adding processes are realized in various ways which are categorized in ISO/ASTM52900-15, namely: Binder Jetting; Directed Energy Deposition; Material Extrusion; Material Jetting; Powder Bed Fusion; Sheet Lamination; Vat Photopolymerization. And this technique is compatible with different kinds of materials, i.e., metal materials, non-metal materials, and medical biomaterials.
Lately, AM becomes a very promising technology for the manufacture of complex-shaped components used in the aeronautics and aerospace industry because of the progress made by the industrial manufacturers in metal-based fabrication. There has been an exponential growth of the interest on the AM applications for metals in the fields of research and industry in recent years. A remarkable industrial breakthrough was reported from SIEMENS. 3D-printed turbine blades were fabricated and survived full-load tests in 2017. A continuous 8000 hour run for one full year of operation was reported later in 2018.1 With the successful application in the industrial domain, AM proves its value in
“l’industrie du futur” (the future industry).
As a developing technology, AM still has its limitations. Poor surface state and dimensional precision are the most evident flaws. As-built products show a strong surface roughness and have inherent defects, for instance, lack-of-fusion powder, porosity, and inclusions, which influence mechanical properties eventually. In Figure I-1, different Metal AM processes are evaluated with regards to production
1
Generality
7
precision and deposition rate. However, by sacrificing the deposition rate, i.e. the production time, improved precision is achieved by several techniques, particularly Powder Bed Fusion processes.
Figure I-1: Comparison of AM processes in terms of deposition rate and precision of features The commonly studied techniques for AM of metals are Selective Laser Melting (SLM), Electron Beam Melting (EBM), both classified as Powder Bed Fusion processes, and Laser Metal Deposition (LMD), categorized as a Direct Energy Deposition process (Herzog et al., 2016). The AM technique involved in this project is SLM which is originated in the 1990s at the Fraunhofer Institute ILT in Aachen, Germany and was classified as Laser Sintering. It grew exponentially in the field of metal component manufacturing (Meiners, Wissenbach and Gasser, 1996). By 2005, commercial laser sintering systems appeared, incrementally fusing layers of metal powder and thus obtaining solid objects (J. P. Kruth et al., 2005). The appearance of these systems marked the birth of a new branch of technology - the rapid manufacture of parts.
The first selective laser sintering systems used powders with a polymer coating. Parts obtained by this process had low densities and required post-heat treatment under pressure to reach near-maximal densities (Shellabear and Nyrhilä, 2004). Parallel innovations have made it possible to use uncoated metal powders in Direct Selective Laser Sintering (DSLS) (Agarwala et al., 1995). This concept served as a basis for the processes referred to today as Direct Metal Laser Sintering (DMLS), which is technically a particular embodiment of SLS (Selective Laser Sintering) (J. Kruth et al., 2005). It should be emphasized that SLM systems rely on the melting of powders and initially used only pure metals. Nevertheless, there is a significant difference between SLM and SLS: while the former fully melts the powder, the latter heats it to a specific point where the powder grains can fuse; thus, SLS cannot achieve the near full density which characterizes the SLM products, and it usually requires postprocessing, such
Chapter I Literature research
8
as heat treatment and material infiltration. But although the difference between the SLM and SLS systems is clearly stated, the distinction between the two processes has become blurred because the new SLS systems are operated at sufficient powers to fuse powders; this is why, in practice, SLM and DMLS are used interchangeably.
The SLM building process starts with laying a thin layer of metal powder on a substrate plate in a building chamber. Once the powder is laid, the laser is used to melt and fuse selected areas according to the processed data. Once the laser scanning is completed, the building platform is lowered, the next layer of powder is deposited on top and the laser scans a new layer. The process is then repeated for successive layers of powder until the required components are completely built.
The process is represented in Figure I-2.
Figure I-2: Schematic illustrations of the SLM process (Patterson, Messimer and Farrington, 2017) With this technique, a high energy density laser is used to melt and fuse metallic parts, in an inert gas atmosphere. Since the powder is fully melted, it is possible to have low porosity and good control over crystal structure, acting on the production parameters (such as laser power, scanning speed, hatch spacing, and layer thickness). Several physical phenomena have to be taken into account, such as the absorption of laser irradiation by the powder material, the balling phenomenon, that disrupt the formation of continuous melts, or the thermal fluctuation experienced by the material during the process, that causes residual stress on the components built, and can therefore lead to crack formation and delamination. However, small localized heating and rapid cooling in SLM reduce the pick-up of interstitial elements. Previous studies have shown good results in terms of relative density, especially under high laser power and low scanning speed, and strength (UTS, YS) of the manufactured pieces, compared to parts produced by casting or other AM techniques (Tolosa et al., 2010).
Generality
9
Although SLM is by far the best solution among AM metal processes in terms of surface quality, the as-built surface of SLM products is not satisfying. One purpose of the present work is to study the influence of surface roughness and porosity in the 316L steel fabricated by SLM on its fatigue behavior. I.1.2. High cycle fatigue
Fatigue failure has always been a concern for engineers for centuries. Fatigue failure has the characteristics of locality, and sensitivity to the environment and defects. Therefore, fatigue damage is often not easy to detect in time and easily causes accidents. The most representative description of the fatigue phenomenon is “Material can be induced to fail by many repetitions of stresses, all of which are lower than the static strength. The stress amplitudes are decisive for the destruction of the cohesion of the material.”, known as “Wohler laws” (Schütz, 1996).
Typical mechanical properties of materials (such as yield stress and ultimate tensile strength) are identified by static experiments. These mechanical properties do not fully reflect the characteristics of the material under the loading of cyclic alternating stress. Therefore, if a part or structure that works under an alternating loading is still designed according to static loading, sudden failures often occur during use. There are many obvious essential differences between fatigue failure and traditional static failure:
(1) Static failure is a failure under a maximum load: Fatigue failure is a failure under repeated loads. It does not occur in a short period of time, but it takes a certain period of time, or even a long time, to fail.
(2) When the static stress is less than the yield limit or strength limit, static failure does not occur; while the alternating stress is far less than the static strength limit, or even less than the yield limit, fatigue failure may occur.
(3) Static failure usually has obvious plastic deformation. Fatigue failure usually does not have significant external plastic deformation signs, even for ductile metallic materials. Just like the brittle failure, it is not easy to detect in advance, which indicates that Fatigue failure is even more dangerous.
Three Fatigue regimes can be distinguished (shown in Figure I-3), depending on the number of cycles to failure.
Low cycle fatigue (LCF) is a situation where the stress is high enough to generate plastic deformation and fail within a low number of cycles (Nf < 104-105).
High cycle fatigue (HCF) corresponds to the low-stress situation which is below the macroscopic yield stress and the rupture happens in 106-107 cycles.
Chapter I Literature research
10
Very high cycle fatigue (VHCF) concerns the situation of a long service life as well as often a high loading frequency. Fatigue limit declines further after 107 cycles. An infinite life does not seem to exist
for metallic materials (Pyttel, Schwerdt and Berger, 2011).
Figure I-3: Diagram of the various domains of fatigue and highlighting of the dispersion at low amplitudes of stress. (Guilhem, 2011)
Today, a large number of aeronautical and aerospace components, such as engine components and turbine blades, are often subject to cyclic loads of very high frequencies that exceed, for their lifetime, one million cycles. Damage to parts under this type of loading is very often referred to as HCF.
HCF is a type of fatigue that involves small deformations and a large number of cycles to lead to failure. The total stress is composed of average stress and alternating stress. The average stress is caused by the residual stresses, the loads induced during assembly or by a highly heterogeneous temperature distribution. The alternating stress is mechanical or thermal stress of any frequency. HCF implies lower stresses with respect to the yield stress. Usually, there is no plastic deformation at the macroscopic scale in the HCF regime. That is to say, the main macroscopic deformation in HCF is the elastic deformation. In HCF regime, the fatigue crack preferably initiates at the surface and the crack initiation phase represents a greater proportion of the total lifetime. A large dispersion of the results is noted in this area. This is mainly due to the peculiarities of the microstructure of the material, among which the grain orientation configurations and the presence of impurities or/and flaws.
In the present study, we focus on the HCF regime with number of cycles to failure such as Nf >106
to 107.
I.1.3. Stainless steel 316L
SS316 is an austenitic chromium-nickel stainless steel containing a deliberate amount of molybdenum which increases general corrosion resistance and especially improves its pitting resistance
Generality
11
to chloride ion solutions. SS 316L is the extra-low carbon version of SS316 that minimizes harmful carbide precipitation during welding. Because of its combination of good mechanical properties at high temperatures, excellent corrosion resistance, and good machinability, this steel is used as a general-purpose material with excellent mechanical and corrosion properties. Its chloride resistance makes this specific grade of stainless steel suitable for marine applications. SS 316L is also the preferred material for use in hydrogen atmospheres or for hydrogen piping/cooling applications. Furthermore, 316L retains good mechanical properties at sub-zero and even cryogenic temperatures and is suitable for structural components in low-temperature applications.
For the Additive Manufactured (AM) SS 316L, its applications are often limited in high value-added scenarios because of the expensive cost of fabricating process, e.g.: medical and dental applications (Figure I-4), heat exchangers, lightweight structures, etc. (Yap et al., 2015)
Figure I-4: Customized removable partial dentures made from SLM SS 316L (Almufleh et al., 2018) Generally, higher porosity is encountered in AM parts due to incomplete fusion, if compared to wrought material. AM SS 316L has achieved significant success with near full density, reasonable tensile properties and fatigue crack growth behavior (Lou et al., 2017).
According to ASTM A240 (ASTM International, 2018), chemical compositions in SS 316L should meet certain standards. In terms of AM, the chemical compositions of manufactured material have slight differences. The values from the ASTM standard and from AM machine provider 3D systems are listed in Table I-1. The differences are denoted by using italic form.
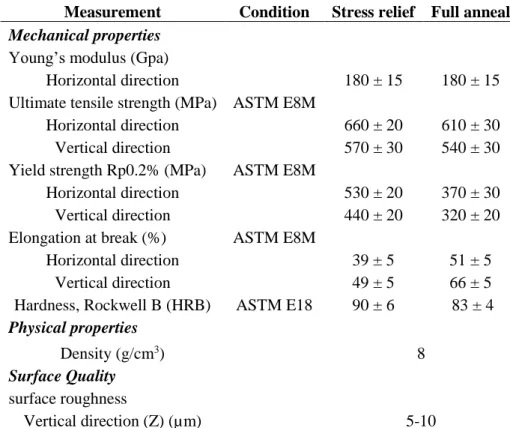
Moreover, because of the distinguished fabrication process, the material properties from AM parts are different from conventional ones. Regarding this study, the mechanical properties of SLM SS 316L from 3D Systems® are listed in Table I-2. As stated by the producer, the specimens tested were manufactured with standard parameters on a ProX DMP 320 machine using the process parameter of Config B.
Chapter I Literature research
12
Table I-1: Chemical compositions of SS 316L
Element % of weight
<<ASTM>> <<3D SYSTEMS>>
Iron Balance Balance
Carbon ≤0.03 ≤0.030 Manganese ≤2.0 ≤2.00 Silicon ≤0.75 ≤1.00 Phosphorus ≤0.045 ≤0.045 Sulfur ≤0.03 ≤0.030 Chromium 16.0-18.0 16.50-18.50 Molybdenum 2.0-3.0 2.00-2.50 Nickel 10.0-14.0 10.00-13.00 Nitrogen ≤0.1 ≤0.11
Table I-2: Mechanical properties of SLM SS 316L from 3D systems® Measurement Condition Stress relief Full anneal Mechanical properties
Young’s modulus (Gpa)
Horizontal direction 180 ± 15 180 ± 15
Ultimate tensile strength (MPa) ASTM E8M
Horizontal direction 660 ± 20 610 ± 30
Vertical direction 570 ± 30 540 ± 30
Yield strength Rp0.2% (MPa) ASTM E8M
Horizontal direction 530 ± 20 370 ± 30
Vertical direction 440 ± 20 320 ± 20
Elongation at break (%) ASTM E8M
Horizontal direction 39 ± 5 51 ± 5
Vertical direction 49 ± 5 66 ± 5
Hardness, Rockwell B (HRB) ASTM E18 90 ± 6 83 ± 4 Physical properties
Density (g/cm3) 8
Surface Quality surface roughness
Vertical direction (Z) (µm) 5-10
I.2. The state-of-the-art research about fatigue behavior of SLM SS 316L
One of the most concerned topics in the field of the durability of additive manufacturing metallic materials is the complexity of predicting fatigue failure. For the AM materials, the microstructure is often different from its conventional counterpart although they share the same chemical composition. The process parameter and post-processing treatment have great influences on AM materials’ fatigue