HAL Id: tel-02940092
https://pastel.archives-ouvertes.fr/tel-02940092
Submitted on 16 Sep 2020
HAL is a multi-disciplinary open access archive for the deposit and dissemination of sci-entific research documents, whether they are pub-lished or not. The documents may come from teaching and research institutions in France or abroad, or from public or private research centers.
L’archive ouverte pluridisciplinaire HAL, est destinée au dépôt et à la diffusion de documents scientifiques de niveau recherche, publiés ou non, émanant des établissements d’enseignement et de recherche français ou étrangers, des laboratoires publics ou privés.
Hybrid refrigeration system with a novel membrane
exchanger
Rasha Mustapha
To cite this version:
Rasha Mustapha. Hybrid refrigeration system with a novel membrane exchanger. Chemical and Process Engineering. Université Paris sciences et lettres, 2019. English. �NNT : 2019PSLEM073�. �tel-02940092�
Composition du jury :
Laurence, FOURNAISON
Directrice de Recherche, Irstea Président Predrag, HRNJAK
Professeur, Université d’Illinois Rapporteur Vincent, LEMORT
Professeur, Université de Liège Rapporteur Khalil, EL KHOURY
Professeur, Université Libanaise Examinateur Kamel, GHALI
Professeur, Université Américaine de Beyrouth Examinateur Assaad, ZOUGHAIB
Professeur, PSL-Mines ParisTech Directeur de thèse
Préparée à MINES ParisTech
Hybrid Refrigeration System with a Novel Membrane
Exchanger
Système de Réfrigération Hybride Comportant un
Echangeur Membranaire Innovant
Soutenue par
Rasha MUSTAPHA
Le 15 Novembre 2019
Ecole doctorale n° 621
Ingénierie des Systèmes,
Matériaux,
Mécanique,
Énergetique
Spécialité
2
ACKNOWLEDGMENT
This thesis would never have been realized without some great people who contributed with their expertise and precious help.
I am absolutely thankful to my thesis advisor Dr. Assaad ZOUGHAIB for his continuous support and insightful comments. His encouragement, friendly attitude and one-of-a-kind sense of humor were the main sources of motivation during these three years.
Besides my adviser, I wish to thank the members of my dissertation committee: Dr. Predrag HRNJAK, Dr. Vincent LEMORT, Dr. Laurence FOURNAISON, Dr. Kamel GHALI and Dr. Khalil EL KHOURY for generously offering their time, support, guidance and good will throughout the preparation and review of this thesis. I feel proud and honored that you have accepted to be on my committee.
I would like to gratefully acknowledge the financial support of ERANETMED project Sol-Cool-Dry, ID number: ERANETMED_ENERG-11-138 under ERA-MET Initiative “EURO-MEDITERRANEAN Cooperation through ERANET joint activities of FP7 INITIATIVE ERANETMED.
Throughout the ERANETMED project, I had the chance to participate in international academic discussions. I am indebted to those who contributed to the rich exchange of ideas and information especially Dr. Nesreen GHADDAR and Dr. Kamel GHALI. This research process was greatly supported by their valuable insights. I would like to thank them as well for supplying us with some membrane materials manufactured in the laboratories of the American University of Beirut. I wish to record my gratitude to Dr. Khalil EL KHOURY for his help and constructive advices throughout these years and who has always generously made his broad international relationships available for his students.
My debts go to my colleagues for providing a stimulating environment for learning and growing and even far beyond to those who read the manuscript and those who have accompanied me from one moment to another during this period of research life.
Finally, nobody has been more important for me in the completion of this work than my family members, Daad, Samer, Nathalie, Reem, Roni, Rayn and last but least Rami. I would like to thank them all for their endless love and support providing me the necessary faith and strength to pursue my goals. Without them life would have been much harder.
4
Table of Contents
ACKNOWLEDGMENT ... 2 Table of Contents ... 4 List of Figures ... 8 List of Tables ... 10 Nomenclature ... 12 General Introduction ... 16Chapitre 1 Contexte, Etat de l’art et la Problématique (résume) ... 18
Chapter 1 Context, State of the Art and Problem Statement ... 28
1.1 Context ... 28
1.1.1 The energy and environmental context ... 28
1.1.2 The refrigeration and cooling context ... 32
1.1.3 The humidity control issue... 34
1.1.4 Conclusion ... 36
1.2 Desiccant Systems Review ... 36
1.2.1 Types of Desiccant ... 37
1.2.2 Hybrid desiccant/vapor compression systems ... 39
1.2.3 Heat and mass exchangers ... 43
1.3 Thesis Problem Statement ... 53
Chapitre 2 Méthode Modifiée de la coupe pour Tester la Perméabilité de la Vapeur D'eau dans les Membranes Poreuses (résumé) ... 54
Chapter 2 Modified Upright Cup Method for Testing Water Vapor Permeability in Porous Membranes ... 62
2.1 Introduction ... 62
2.2 ASTM E96 Upright Cup Method ... 63
2.2.1 Procedure ... 63
2.2.2 Assumptions ... 64
2.2.3 Discussion ... 64
2.3 Modified Upright Cup Method ... 65
2.3.1 Experimental Conditions Assessment ... 66
5
2.3.3 Experimental Data and Measurements ... 66
2.3.4 Deduction of Water Vapor Permeability ... 68
2.3.5 Results ... 72
2.3.6 Uncertainty Analysis ... 73
2.4 Conclusion ... 79
Chapitre 3 Modélisation de l'échangeur de chaleur et de masse et validation expérimentale (résumé) .... 82
Chapter 3 Modeling the Heat and Mass Exchanger and Experimental Validation ... 100
3.1 Introduction ... 100
3.2 Test bench description ... 101
3.2.1 Layout and components ... 102
3.2.2 Description of the exchanger ... 102
3.2.3 Testing Procedure ... 104
3.3 Experiments ... 105
3.4 Proposed heat and mass membrane exchanger model ... 106
3.4.1 Assumptions ... 107
3.4.2 Definitions, properties and basic relations ... 108
3.4.3 Mathematical and discretized model ... 114
3.4.4 Numerical implementation of the model ... 117
3.5 Application done on the prototype ... 129
3.5.1 Selection of water side heat transfer coefficient correlation ... 130
3.5.2 Comparison of the three computations schemes ... 131
3.5.3 Model verification and validation ... 133
3.5.4 Uncertainty analysis ... 141
3.5.5 Air side heat transfer coefficient correction ... 150
3.6 Conclusion ... 153
Chapitre 4 Étude de Cas : Une Conception Flexible d'un Système de Climatisation Hybride dans un Bureau (résumé) ... 156
Chapter 4 Case Study: Flexible Design of a Hybrid Air Conditioning System in an Office ... 168
4.1 Introduction ... 168
4.2 Case study ... 169
4.2.1 Building description ... 169
6
4.3 Hybrid system description ... 173
4.3.1 Configurations ... 175
4.3.2 Modeling the hybrid system ... 179
4.3.3 Discussion of the simulation protocol ... 183
4.3.4 Analysis ... 192
4.4 Conclusions and outlook ... 194
Conclusion and General Outlook ... 196
8
List of Figures
Figure 1.1: World electricity final consumption by sector 29
Figure 1.2: Global electricity generation by source and its evolution throughout the years 30 Figure 1.3: World percentage CO2 emissions by sector with its atmospheric concentration in ppm 31
Figure 1.4: World energy consumption for space cooling in buildings 32
Figure 1.5: World electricity consumption for space cooling in the baseline and efficient cooling scenarios
(Birol, 2018) 33
Figure 1.6: Stock of AC in the baseline scenario by country/region (Birol, 2018) 34
Figure 1.7: Schematic of a solid desiccant wheel 38
Figure 1.8: A liquid desiccant dehumidification system with a liquid–liquid heat exchanger 38
Figure 1.9: A hybrid liquid desiccant vapor compression cooling system 40
Figure 1.10: A schematic of a parallel plate cross flow membrane exchanger 46 Figure 1.11: Schematic of the hollow fiber membrane module and the cell with a free surface model (L.-Z.
Zhang et al., 2012). (a) The shell and the tube structure; (b) The cell with a free surface 48
Figure 1.12: Design model of the proposed system 50
Figure 1.13: A picture of the proposed system with the spraying desiccant 51 Figure 1.14: A collection of different membranes (a) pillow cases, (b) sack, (c) roof underlay, d) Tyvek
mail envelope, (e) electrospun nanofiber 52
Figure 2.1 ASTM E96 upright cup test for measuring water vapor transmission 63 Figure 2.2: Three resistances to water vapor transfer in ASTM E96 standard 64
Figure 2.3: Schematic drawing of the modified cup method 65
Figure 2.4: a) Variation of the measured mass (i) and calculated mass (ii) of water with respect to time in the control cup, b) mass conductivity of air determined by optimization 69 Figure 2.5: Variation of the measured mass (i) of water with respect to time in the cup covered with
NWF-1in experiment 1 69
Figure 2.6: Mass conductivity results for all membranes from the 11 experiments 70 Figure 2.7: a) Variation of the measured mass (i) and calculated mass (ii) of water with respect to time in a
covered up, b) mass conductivity of membrane determined by optimization 72 Figure 2.8: Mass conductivity results for all membranes from the 11 experiments 73 Figure 2.9: Illustrations of the methodologies of propagation of distributions (Guimaraes Couto et al.,
2013). 75
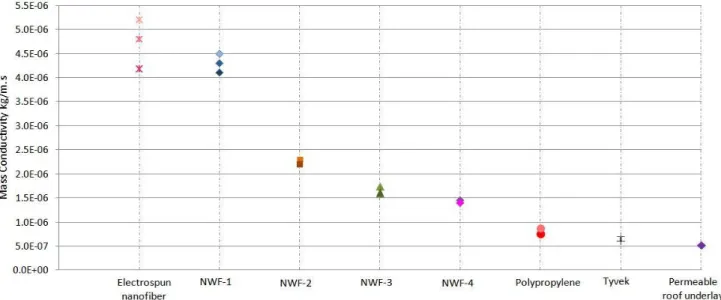
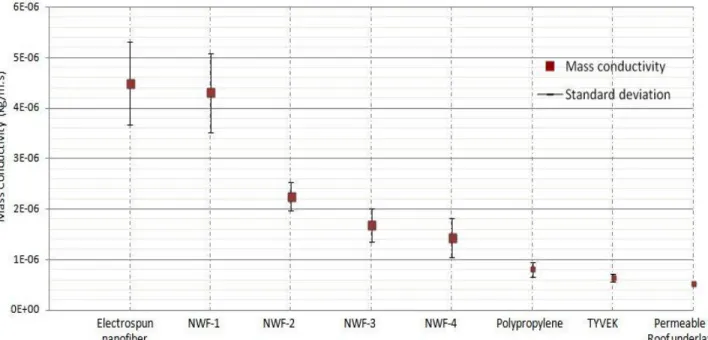
Figure 2.10: Histogram of a) thickness of the membrane b) exchange surface area 77 Figure 2.11: Mass conductivities of the different membranes with their error distribution 79
Figure 3.1: The prototype heat and mass exchanger 100
Figure 3.2: A drawing of the test bench from the left side view 101
Figure 3.3: A drawing of the test bench from the front side view 101
Figure 3.4: a) One channel with the membrane placement, b) Four consecutive channels of the exchanger
with dimensions 103
Figure 3.5: Flat jet nozzle 103
Figure 3.6: Dimensions and properties of the nozzle 104
Figure 3.7: Mass conservation of the water vapor at the air side in an elementary control volume 115
Figure 3.8: Section of the exchanger with 15 liquid channels 118
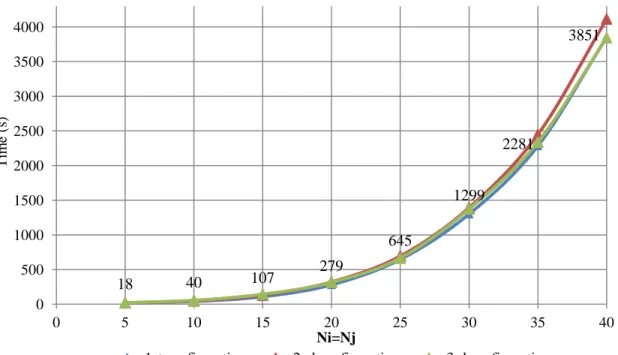
9 Figure 3.10: A representation of the grid nodal quantities of the 2nd computation 120 Figure 3.11: A representation of the grid nodal quantities of the 3rd computation 122 Figure 3.12: Variation of the power of the 3 computations as a function of the model discretization 132 Figure 3.13: Variation of the time needed for one simulation as a function of the model discretization in
the 3 computations 133
Figure 3.14: Predicted versus experimental power distribution for all experiments 141 Figure 3.15: Uncertainty on the total power numerically and experimentally (water side) 149 Figure 3.16: Uncertainty on the sensible and latent loads of a) EXP9 and b) EXP18 150 Figure 3.17: Predicted versus experimental power distribution for all experiments after optimization 152
Figure 4.1: Temperature and relative humidity in each month. 169
Figure 4.2: Monthly cooling load distribution. 170
Figure 4.3: Vapor compression cycle with T-S diagram 170
Figure 4.4: Schematic of a hybrid system with storage tanks 174
Figure 4.5: Schematic of the first configuration 176
Figure 4.6: Schematic of the second configuration 178
Figure 4.7: Schematic of the third configuration 179
Figure 4.8: A drawing of a cross flow heat and mass exchanger. 181
Figure 4.9: Calculated COP and distribution of cooling load removal (a) 1st configuration, (b) 2nd
configuration, (c) 3rd configuration 189
10
List of Tables
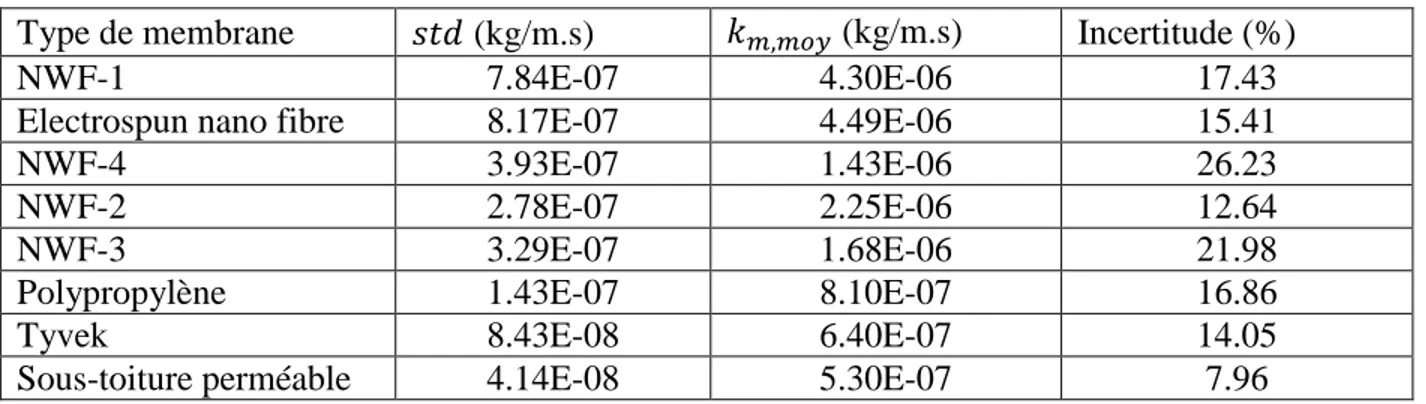
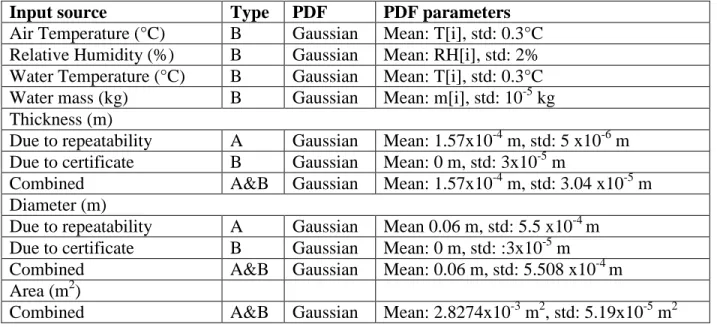
Table 2.1: Input conditions of the different experiments along with the mass of water variation with time 67 Table 2.2: The thickness, average mass conductivity and mass transfer resistance of all membranes 73 Table 2.3: A summary of the Gaussian PDF for all input uncertainties of NWF-1 78
Table 2.4: Percentage uncertainty for the tested membranes 78
Table 3.1: A summary of the design parameters and the inlet conditions of a typical example 129
Table 3.2: Comparison of the different heat transfer correlations 130
Table 3.3: Initial inlet conditions of each experiment 134
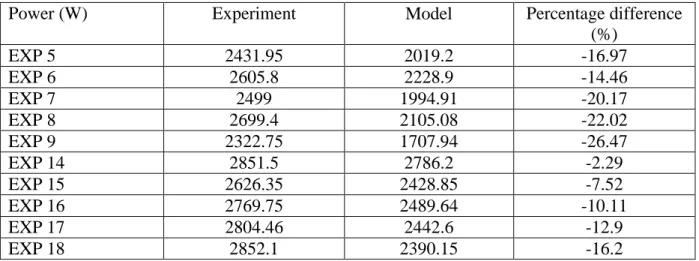
Table 3.4: Experimental and numerical results of EXP5 with uniform air speed 136 Table 3.5: Experimental and numerical results of EXP8 with uniform air speed 136 Table 3.6: Experimental and numerical results of EXP14 with uniform air speed 137 Table 3.7: Experimental and numerical results of EXP17 with uniform air speed 137 Table 3.8: Experimental and numerical results of EXP5 with non-uniform air speed 138 Table 3.9: Experimental and numerical results of EXP8 with non-uniform air speed 139 Table 3.10: Experimental and numerical results of EXP14 with non-uniform air speed 139 Table 3.11: Experimental and numerical results of EXP17 with non-uniform air speed 140 Table 3.12: percentage difference between the predicted power and the actual power 140
Table 3.13: Uncertainty at low and high air speed channel by channel 143
Table 3.14: Uncertainty on the air flow rate at low and high air speed channel by channel 144 Table 3.15: A summary of the Gaussian PDF for all input uncertainties of EXP18 145 Table 3.16: Uncertainties on the experimental results at the water side and the air side 146 Table 3.17: A summary of the Gaussian PDF for all input uncertainties of EXP9 147 Table 3.18: A summary of the Gaussian PDF for all input uncertainties of EXP18 147 Table 3.19: The effect of different input uncertainties on the numerical results at water and air side for
EXP9 148
Table 3.20: The effect of different input uncertainties on the numerical results at water and air side for
EXP18 148
Table 3.21: The percentage difference between the predicted and the actual results after optimization for
experiments done at low air speed 151
Table 3.22: The percentage difference between the predicted and the actual results after optimization for
experiments done at low high speed 151
Table 3.23: Detailed comparison of the numerical results before and after optimization for EXP9 152 Table 3.24: Detailed comparison of the numerical results before and after optimization for EXP18 153
Table 4.1: Loads removed by the vapor compression cycle 173
Table 4.2: Dimensions of the dehumidifier and regenerators in all configurations 184 Table 4.3: Input parameters to the system for the three configurations 187 Table 4.4: Loads removed by the system and the COP of the 1st and 2nd configurations 188 Table 4.5: Loads removed by the system and the COP of the 3rd configuration 188 Table 4.6: Calculated temperature and relative humidity of the supply air 190 Table 4.7: A summary of the input values, the outputs and supply air conditions in the three configurations191 Table 4.8: Condensation and evaporation temperatures with percentage concentration of solution. 193
12
Nomenclature
Latin letters
A Area [m2]
C Concentration [kg/kg] unless indicated otherwise
Specific heat at constant pressure [J/kg.K]
Mass diffusion coefficient [m2/s]
D Hydraulic diameter [m]
g Gravitational acceleration, [m/s2]
h Specific enthalpy [J/kg]
H Enthalpy [J]
H Height [m]
Fan static pressure [m]
Latent heat of vaporization of water [J/kg]
Pump head [m]
Mass transfer coefficient [kg/m2.s]
Heat transfer coefficient [W/m2.K]
Heat transfer coefficient in the confined space [W/m2.K]
Thermal conductivity [W/m.K]
km Mass conductivity of the membrane [kg/m.s]
L Length [m]
Lc Characteristic length for convection correlations [m]
m Mass [kg]
Mass flow rate [kg/s] unless indicated otherwise
Ni Number of discretization in the direction of x-axis [-] Nj Number of discretization in the direction of z-axis [-]
P Pressure [Pa]
Q Load or heat transfer [W]
Resistance to heat and mass transfer [m2s/kg] unless indicated otherwise
R’ Ratio of latent to sensible load [%]
RH Relative humidity [%]
t Time [s]
T Temperature [K] unless indicated otherwise
u Uncertainty [%]
UM Overall mass exchange coefficient [kg/m2.s]
W Width [m]
X Mass of water per mass of dry desiccant [kgw/kgd] Y Mass of water vapor per mass of dry air [kgv/kgda]
13
Z Height of the dehumidifier [m]
Dimensionless Numbers Gr Grashof number [-] Le Lewis number [-] Nu Nusselt number [-] Pr Prandtl number [-] Ra Rayleigh number [-] Re Raynold number [-] Greek symbols
Correction factor at low air speed [-]
β Coefficient of volume expansion [1/K]
Correction factor at low air speed [-]
Thickness [m]
η Efficiency [%]
Reduced temperature [-]
Kinematic viscosity of the fluid [m2/s]
Dynamic viscosity [N.s/m2]
Concentration of desiccant in the solution [kg/kg]
Density [Kg/m3] Subscripts a Humid air avg Average b Boundary layer c Cavity C Celsius cf Cold fluid comp Compressor cond Condenser d Dry desiccant da Dry air dp Dew point evap Evaporator f Fan f Falling film hf Hot fluid i Inlet is Isentropic
14 L Latent m Membrane ma Membrane-air ms Membrane-solution mw Membrane-water o Outlet or Outlet return p Pump r Return ref Refrigerant reg Regenerator s Desiccant solution S Sensible T Total v Vapor w Liquid water
Abbreviations and Acronyms
AC Air Conditioner ACH Air Changes per Hour
ASTM American Society for Testing and Materials CaCl2 Calcium Chloride
CO Carbon Monoxide
CO2 Carbon Dioxide
COP Coefficient of Performance ESA European Space Agency GHG Green House Gases
HVAC Heating, Ventilation and Air Conditioning
hx Heat Exchanger
IEA International Energy Agency
IPCC Intergovernmental Panel on Climate Change ISO International Organization for Standardization LAMEE Liquid to Air Membrane Energy Exchanger LiBr Lithium Bromide
LiCl Lithium Chloride MAE Mean Absolute Error
NOAA National Oceanic and Atmospheric Administration NOx Nitrogen Oxides
NTU Number of Transfer Units
15 PCM Phase Change Material
PDF Probability Density Function
PE Poly-Ethylene
PP Poly-Propylene
PTFE Poly-Tetra-Fluoro-Ethylene RMSE Root Mean Square Error SHGC Solar Heat Gain Coefficient SOx Sulfur Oxides
std Standard Deviation
16
General Introduction
The drastic impact of high energy consumption on the environment and on human’s health is raising a critical alert which requires global strategic plans to overcome its destructive consequences. Energy consumption has been remarkably increasing during the last few decades and is likely to rise further in light of the developing global economy. In particular, higher electricity demands are forecasted mainly for heating and cooling in some cities of the world. Amidst the universal growth in the energy demand and its significant environmental impacts, it is of great importance to find techniques that provide the energy needs of the economies and simultaneously reduce the GHG emissions. Fundamental changes in the energy sector is evolving worldwide primarily driven by the integration of renewable energy sources and more energy efficient technologies.
Our work starts by describing the energy and environmental context related to the world electricity final consumption and percentage of CO2 emissions by sector. It is shown that buildings play a dominant role accounting to 36% of global final energy consumption and having the largest share of the energy-related CO2 emissions. Electricity use in buildings has had the largest growth of 15% between 2010 and 2017 with the space cooling leading this growth by more than 20% (International Energy Agency and the United Nations Environment Program, 2018). Space cooling is usually performed through vapor compression cycles that have low Coefficients of Performance (COP) and show deficiencies in handling latent loads. They consume excessive energy to remove humidity through cooling the air below its dew point temperature and then they reheat it to the desired indoor temperature. Therefore, realizing the potential of the buildings sector in contributing to the electricity consumption triggers the initiation of energy efficient building measures aiming to improve applications related mainly to space cooling.
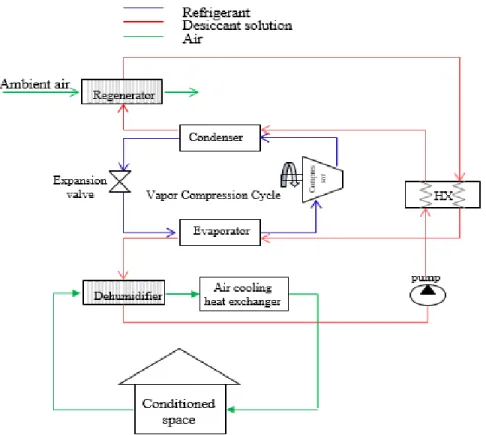
Hybrid liquid desiccant vapor compression systems showed to be reliable alternatives for the conventional cooling systems by which the control of latent and sensible load is done separately. In these systems, a liquid desiccant cycle dehumidifies the air prior to its cooling by the vapor compression cycle. In some cases, the desiccant cycle could contribute simultaneously to both dehumidifying and partially cooling the air. This is accomplished through passing the desiccant solution by the evaporator of the vapor compression cycle to decrease its temperature. After absorbing water vapor from the air, the concentration of the desiccant solution decreases. Thus, it needs to be reactivated through a regeneration cycle that exchanges the solution with high temperature air heated by the free energy provided by the condenser of the vapor compression cycle. The movement of water vapor to or from the solution depends on the difference of vapor pressure between the solution and the surrounding air. A literature review of such hybrid systems is investigated in the first chapter focusing on the dehumidifier and the regenerator which are membrane based heat and mass exchangers. Their existing designs are then subjected to deep analysis and their drawbacks are inspected. In a way to solve their drawbacks, an innovative membrane based heat and mass exchanger is described and analyzed. It addresses a new
17 technique based on vertically spraying the liquid desiccant to increase the indirect contact surface area between the air and the liquid. Moreover, it questions the possibility of using certain low cost materials with convenient enduring characteristics as membranes for these exchangers. Yet, the challenge remains to find the physical properties of these materials that were originally fabricated for uses other than heat and mass exchange.
One major property of these materials, the mass conductivity, is determined in the second chapter. It is the ability to transmit water vapor and it greatly affects the transfer of heat and mass within the material. Aiming to infer the water vapor permeability of these materials, a collection of different fabrics is tested by a modified upright cup method, based on the ASTM E96 standard, but using a new methodology. The results of this test are subjected to an uncertainty analysis to assess the accuracy of our measurements. From the tested materials, the fabric with the best cost/quality compromise is then adopted and employed as a membrane to cover the channels of a prototype of a cross flow heat and mass exchanger.
The prototype is tested on a dedicated test bench allowing evaluating its performance. Validation experiments are performed at different operating conditions and data is collected from the different sensors inserted in the system. Next, in order to numerically predict the behavior of such an exchanger, a detailed mathematical model is developed using conjugate heat and mass transfer based on fitted algebraic equations and specific correlations. Simulations are performed and the validity of the suggested model is analyzed by comparing the simulation results to the experimental data mainly related to the power of the exchanger at the water side.
Finally, in the last chapter a complete evaluation of a hybrid liquid desiccant system is conducted to assess the seasonal air conditioning operation of an office located in a Mediterranean climate in the south of France. Several flexible configurations of such a hybrid system are suggested by adding heat exchangers and changing their location for different applications. Our developed model is used to estimate the performance of the dehumidifier and regenerator of the hybrid system. This study sheds the light on the importance of the system’s flexibility and on the effect of the indoor latent to sensible load ratio (R’) on the system’s performance. As a final point, the simulation results of the three configurations are then compared to that of a conventional air conditioning system to evaluate their potential savings.
18
Chapitre 1 Contexte, Etat de l’art et la Problématique
(résume)
1.1 Contexte
1.1.1 Le contexte énergétique et environnemental
L'énergie et l'environnement sont les problèmes globaux qui semblent préoccuper sérieusement les sociétés. Le réchauffement climatique représente le principal problème environnemental auquel le monde est confronté de nos jours. La principale cause du réchauffement de la planète est l'émission de CO2 dans l'atmosphère qui est causée principalement par la combustion de combustibles fossiles. Si le réchauffement de la planète continue d'augmenter, des changements climatiques importants se produiront et des effets graves auront lieu à long terme. Ces impacts incluent la fonte des masses glacières polaires menant à la montée de la mer et menaçant les villes côtières et les zones de faible altitude. Selon l'Agence Spatiale Européenne (ESA), le niveau de la mer a augmenté de 20 % entre 1992 et 2012. D'autres impacts consistent en l'assèchement des climats tropicaux, principalement en Afrique et en Inde, les phénomènes météorologiques extrêmes comme les inondations et les tempêtes, l'acidité accrue des océans et l'air plus pollué. Ces changements affectent la santé humaine par la dégradation de la qualité de l'eau et des aliments. En outre, le changement climatique provoque des maladies contagieuses et des élévations de température, ce qui entraîne la perturbation de notre écosystème et réduisant ainsi les ressources nécessaires à un mode de vie sain.
La croissance de la population et les progrès technologiques des dernières décennies ont fait grimper la demande d'énergie et donc d'électricité. La consommation mondiale d'électricité était de 5271 TWh en 1974 et en 2016 cette valeur a atteint 20864 TWh, 3,2% de plus que celle de 2015 (fig.1). Les sources utilisées pour produire de l'électricité font évoluer le monde vers un changement climatique significatif grâce aux émissions de GES et, plus particulièrement, de CO2, et des études montrent qu'environ la moitié des émissions mondiales de CO2 sont dues à la production d'électricité et de chaleur.
La croissance de la consommation d'électricité s'est principalement produite dans le secteur du bâtiment qui constitue les bâtiments résidentiels et commerciaux et les bâtiments de service public. Cela fait du secteur du bâtiment le plus grand consommateur d'électricité dépassant la part industrielle. L'utilisation de l'électricité dans les bâtiments a connu la plus forte croissance de 15 % entre 2010 et 2017, le rafraichissement des espaces ayant conduit cette croissance de plus de 20 % (Agence internationale de l'énergie et Programme des Nations Unies pour l'environnement, 2018). En outre, le secteur du bâtiment a la plus grande part des émissions de CO2 liées à l'énergie. Ainsi, prendre des mesures responsables et durables concernant nos ressources naturelles et notre écosystème contribue au bien-être de la population.
19
Figure 11: Consommation finale mondiale d'électricité par secteur et concentration atmosphérique de CO2
1.1.2 Le contexte de climatisation
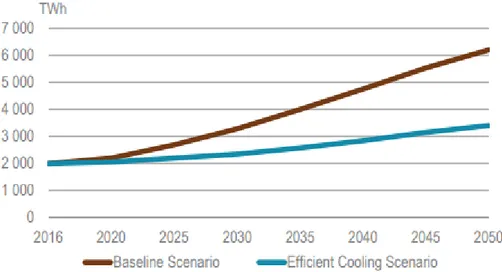
Le graphique de la figure 2 montre l'expansion de l'électricité utilisée pour la climatisation au fil des ans ainsi que sa part dans la consommation totale d'électricité dans les bâtiments (Birol, 2018). La climatisation consomme assez d'électricité, cependant nous sommes certains que le besoin de climatisation va augmenter globalement dans les décennies à venir. Cette augmentation est le résultat du changement climatique, de l’élévation de la température, de la croissance de la population et d'un plus grand désir de confort thermique. L’électricité consommée par la climatisation pourrait croître de 1997 TWh en 2016 à 6200 TWh en 2050 selon le scénario de base ou à 3400 TWh selon un scénario de climatisation efficace. L'utilisation de nouvelles technologies de climatisation à basse énergie permet alors de maîtriser la consommation d'énergie au niveau global en réduisant celle de l'électricité.
Figure 2: Consommation mondiale d'énergie pour la climatisation de l'espace dans les bâtiments
5.3 4.6 4.3 4.2 4.1 4.1 4.3 4.2 26 2.6 2.8 2.8 2.8 27 2.7 2.7 1.5 2.0 2.2 2.4 2.3 22 22 2.2 0.6 0.5 0.5 0.4 0.6 0.6 0.7 0.7 0.2 0.3 0.2 0.2 0.2 0.2 0.2 0.2 354 361 369.5 380 390 399 350 355 360 365 370 375 380 385 390 395 400 405 0 10 20 30 40 50 60 70 80 90 100 1974 1990 1995 2000 2005 2010 2014 2016 CO 2 atm o sp h er ic co n ce n tr atio n ( p p m ) P er ce n tag e (%)
Industry Residential buildings Commercial & public services Other sectors Transport CO2 emissions
0% 1% 2% 3% 4% 5% 6% 0 400 800 1200 1600 2000 2400 Sh ar e o f to tal fin al en er g y ( %) T W h
20 Les climatiseurs (AC) souvent utilisés sont généralement basés sur une technologie à cycle de compression de vapeur. Il n'est pas surprenant que le nombre d'unités de l’AC augmente rapidement en raison de l'augmentation de la température mondiale et des capacités d’achat dans les pays en développement, ce qui peut justifier le stock mondial de ces unités : En 2000, le nombre d'unités stockées était de 815 millions et a doublé en 2016 pour atteindre 1622 millions. La croissance prévue du marché de l’AC d’ici à 2050 montre que la majorité des unités AC mondiales sera concentrée dans les pays du sud les plus touchés par l’augmentation de la température, d’où le besoin le plus crucial pour la climatisation.
Les systèmes de climatisation à compression de vapeur AC peuvent gérer efficacement la température, mais ils présentent certaines lacunes lorsqu'il s'agit de contrôler l'humidité intérieure.
1.1.3 Problème de contrôle de l'humidité
Afin d'extraire l'humidité, les cycles à compression de vapeur abaissent la température de l'air en dessous de celle du point de rosée afin d'éliminer l'humidité par le processus de condensation, et de réchauffer l’air ensuite pour atteindre la température de confort intérieure désirée. Ce processus consomme environ 20 à 40 % de l’énergie totale et augmente la demande d’électricité (Zhang et al., 2010). Un autre inconvénient est la faible qualité de l'air généré qui cause des problèmes de santé et qui affecte le bien-être humain.
1.1.4 Conclusion
Vue la relation directe entre la climatisation et la consommation d'électricité, et tenant compte de tous les problèmes environnementaux liés à l’exploitation des ressources fossiles pour produire de l'électricité, il est désormais prioritaire de développer de nouveaux systèmes de réfrigération économes en énergie. Ces systèmes innovants devraient réduire la consommation d'énergie et répondre à l'augmentation de la demande pour le confort en termes de bien-être thermo hygrométrique et de la qualité de l'air.
L'une de ces solutions alternatives est l'utilisation de la technique de desiccation pour réaliser la déshumidification avant le refroidissement de l'air d'alimentation. Cela sépare le contrôle de l'humidité de celui de la température dans les systèmes traditionnels de climatisation, ce qui améliore leur efficacité énergétique globale et réduit les coûts énergétiques qui en résultent.
1.2 Système de dessiccation 1.2.1 Types de dessiccants
Un dessiccant a la propriété d'absorber une grande quantité de vapeur d'eau et de la désorber facilement en étant réactivé à une température de régénération relativement basse. Il peut être de type solide sous forme de roue tournante (fig.3) (Jani et al., 2016, p. 20; Rambhad et al., 2016) ou liquide comme solution d'eau et de sel (fig.4) (Abdel-Salam et Simonson, 2016). L'objectif principal du dessiccant est d'absorber l'humidité de l'air à travers la différence de pression de vapeur entre la surface du desiccant et l'air qui agit comme force motrice pour le transfert de masse ou d'humidité (Mohammad et al., 2016). Lorsque la pression de vapeur à la surface du desiccant est inférieure à celle de l'air, la déshumidification se produit et vice versa. Le processus
21 de déshumidification se poursuit jusqu'à ce que les pressions de vapeur soient égales. Après ce point, la vapeur d'eau commencera à se déplacer dans le sens opposé qui va du dessiccant à l'air. Afin de réactiver le desiccant, sa pression de vapeur de surface doit être augmentée par préchauffage après avoir quitté l'unité de déshumidification. La régénération se fait généralement à basse température, de 30 à 80 °C environ.
Figure 3: Schéma d'une roue de dessiccation solide
Figure 4: Système de déshumidification par dessiccation liquide avec échangeur de chaleur liquide-liquide
1.2.2 Systèmes hybrides de compression des déformations/vapeurs
Les systèmes hybrides basés sur des desiccants liquides sont donc de bons candidats pour permettre le contrôle séparé de la charge latente et sensible. La figure ci-dessous (fig. 5) montre le principe de cette technologie. Dans ces systèmes, un cycle de dessiccation liquide déshumidifie l'air et le refroidissement et réalisé par le cycle de compression de vapeur. Dans certains cas, le cycle desiccant pourrait contribuer simultanément à la déshumidification et au refroidissement partiel de l'air. Pour ce faire, la solution desiccante est traverse par l’évaporateur du cycle de compression de vapeur pour réduire sa température. Après avoir absorbé la vapeur d'eau de l'air, la concentration de la solution dessiccante diminue. Ainsi, il doit être réactivé par
22 un cycle de régénération qui échange la solution avec de l'air à haute température (chauffé par l'énergie libre fournie par le condenseur du cycle de compression de vapeur).
Figure 5: Système hybride de refroidissement par compression de vapeur de liquide dessiccant
Le déshumidificateur et le régénérateur d'un tel système hybride sont considérés comme les composants principaux sachant que leur conception affecte énormément le contrôle de la température et de l'humidité. Un autre défi lié à ces échangeurs de chaleur et de masse est l’entrainement possible de gouttelettes de solution desiccante générant des problèmes de corrosion. Pour ces raisons, plusieurs études ont été réalisées et de nouvelles technologies ont été mises au point sur ces deux composants et sur les échanges de chaleur et de masse accompagnés.
1.2.1 Les échangeurs de chaleur et de masse
Ils peuvent être de type direct ou indirect. Dans le type direct, le transfert simultané de chaleur et de masse se fait entre deux fluides à grande surface de contact alors que dans les échangeurs à contact indirect, les flux de fluide sont toujours séparés par une paroi de séparation.
1.2.1.1 Type Direct
Dans les échangeurs de type direct, il est possible d'atteindre des rendements de transfert de chaleur et de masse très élevés parce que les deux fluides sont en contact et donc des approches de température plus faibles sont atteintes. On peut les trouver dans différentes applications, y compris les processus de dessalement de l'eau, la production d'énergie géothermique et le stockage de la chaleur (Hyun et al., 2005; Mahood, 2008). Leur coût d'exploitation est également faible en raison de l'efficacité du transfert de chaleur et de masse élevée. Les tours de refroidissement sont des exemples où le fluide qui doit être refroidi (habituellement de l'eau) est
23 dispersé sur un courant d'air et le contact direct permet à l'air de refroidir l'eau par évaporation et convection (Evans, 2016). Le processus d’entrainement de gouttes dû au transfert du fluide refroidi par l'air représente un inconvénient majeur de ces dispositifs. Dans le cas où une solution de dessiccation doit être refroidie, l’entrainement de fines gouttelettes transportées par l'air contiendra du sel qui se dépose dans les zones avoisinantes et dans le processus. Le dépôt de sel est nocif pour le procédé et l'équipement en raison de son caractère corrosif.
1.2.1.2 Type indirect
Les échangeurs de type indirect sont utilisés lorsque le contact direct entre les deux fluides est indésirable, comme dans le cas de l'air et de la solution dessiccante. Ici, le contact direct entre les deux fluides qui s’écoulent est complètement évité par une paroi de séparation, mais le transfert de la chaleur et de la masse se font à travers la paroi. Le transfert se produit lorsqu'une force motrice est appliquée et qui est généralement une différence de pression ou de concentration entre les fluides des deux côtés de la paroi. Les parois (aussi appelées membranes) ont la capacité d'empêcher la solution liquide de se diriger vers l'air humide, mais ils permettent le transport de vapeur d'eau et de chaleur de la solution dessiccante vers l'air et vice versa. Ils peuvent être constitués de polypropylène (PP), de polyéthylène (PE) ou de polytétra-fluoro-éthylène (PTFE) recouvertes d'une couche dense de silicium ou de téflon amorphe (Huang et Zhang, 2013).
De nombreuses études ont porté sur la performance des échangeurs de chaleur et de masse, soulignant par exemple l'importance des propriétés de la membrane dans les types indirects ou l'avantage de certains arrangements utilisant des techniques de pulvérisation dans les types directs. Toutefois, après avoir décrit les dessins ou modèles existants de ces échangeurs, on peut remarquer qu'ils présentent encore certains inconvénients.
1.2.1.3 Inconvénients des échangeurs existants et des solutions possibles
La technologie de pulvérisation d'eau dans les tours de refroidissement a prouvé son importance e t sa bonne performance mais le problème d’entrainement conduit à de graves complications en pa rticulier lorsque les gouttelettes de solution de sel sont transportées par l'air. (Ruiz et al., 2016). En outre, en ce qui concerne les échangeurs membranaires de chaleur et de masse, il y a des défis à relever. Premièrement, ces systèmes sont généralement sophistiqués en raison de l'installation et de la distribution de canaux avec différentes configurations. Deuxièmement, elles sont coûteuses en raison du prix élevé des membranes qui sont faites de structures complexes et sont difficiles à traiter. Concernant les membranes, l'un des inconvénients est qu'elles devraient pouvoir résister à une pression liquide sans être endommagées ou mouillées, de sorte qu'elles doivent être assez rigides pour résister à la différence de pression (X Zhao et al., 2008). L'imperméabilité à l'eau liquide constitue également un autre défi important pour les membranes par lesquelles l'eau liquide ne devrait jamais pénétrer de l'autre côté de la membrane chaque fois qu'une pression d'eau est appliquée. Cependant, la vapeur d'eau devrait toujours pouvoir se déplacer d'un côté de la membrane à l'autre. Toutes ces caractéristiques exigent des propriétés spécifiques qui devraient être présentes dans la membrane, telles que des conductivités thermiques et massiques acceptables, la tension de surface et la résistance à l'usure (Onsekizoglu, 2012). Ainsi, la résistance au transfert de chaleur et de masse de la membrane devrait être aussi basse que
24 possible et la conductivité thermique devrait être suffisamment petite pour réduire la perte de chaleur entre les côtés de la membrane. La conductivité thermique de la membrane est liée à ses caractéristiques physiques et à sa géométrie, ainsi qu'à sa capacité de conduire la chaleur. Une autre limite des membranes proposées dans la littérature est leur coût et leur faible performance, car les membranes doivent être renforcées mécaniquement, ce qui conduit à une faible conductivité de masse.
Afin d'obtenir un système performant, des propriétés membranaires pratiques devraient être disponibles et les défis susmentionnés devraient être surmontés. Dans tous les systèmes existants, ces propriétés sont en contradiction les unes avec les autres. Chaque fois que la membrane est capable de résister à une pression liquide, sa perméabilité à la vapeur d'eau diminue en réduisant sa conductivité de masse. Ces contradictions dans le système, ainsi que le coût élevé de fabrication et la complexité du système dans son ensemble, favorisent le développement d'un nouveau système innovant capable de répondre à tous les besoins et défis susmentionnés.
1.3 Conception nouvelle de l'échangeur de chaleur et de masse à membrane
Une nouvelle technologie brevetée par "Armines" est proposée. Cette technologie fait un usage positif de la présence de la membrane pour résoudre le problème de l’entrainement et les inconvénients des technologies membranaires réelles. La figure 6 représente notre système proposé consistant en un échangeur à flux croisé où la solution dessiccante est projetée verticalement vers le bas entre les membranes, représentées par les couches vertes, et où l'air s’écoule dans un flux perpendiculaire. La solution dessiccante avec une faible concentration est ensuite collectée au bas de l'échangeur et renvoyée à un régénérateur pour être réactivée.
Figure 6: Modèle de conception du système proposé
Afin de réduire l'importance de la résistance à une pression liquide, il est souhaitable de pulvériser le liquide dessiccant uniformément au travers des buses situées en haut du système. La pulvérisation verticale du liquide facilite la configuration de la conception puisqu’'il descend par gravité (fig. 7).
25
Figure 7: Le système proposé avec le dessiccant pulvérisateur
La pulvérisation du liquide non seulement diminue la pression de l'eau sur la membrane, mais elle disperse aussi l'eau en petites gouttelettes augmentant la surface de contact indirect entre l'air et le liquide (Gluesenkamp et Radermacher, 2011). Cela conduit à une plus grande turbulence du côté de l'air près de la membrane, ce qui augmente à son tour le transfert de chaleur et de masse dans cette zone et minimise sa résistance interne. La pulvérisation du liquide induit une pression identique des petites gouttelettes liquides pulvérisées et de l'air par lequel les propriétés mécaniques de la membrane ainsi que son imperméabilité ne seront plus de fortes contraintes. Par conséquent, les contradictions qui ont été présentées dans la section précédente sont maintenant évitées en adoptant cette conception.
En ce qui concerne le coût relativement élevé associé au processus de fabrication des membranes, notre objectif est d'utiliser des matériaux à faible coût qui sont fabriqués à l'origine pour des utilisations autres que l'échange de la chaleur et de masse. Certains de ces matériaux qui semblent être une excellente alternative aux membranes traditionnelles à coût élevé peuvent être des tissus non tissés (NWF) qui sont des toiles ou des structures de toile de fibres liées ensemble de différentes façons. D'autres candidats se trouvent également dans différentes industries comme des membranes de sous toiture. Les propriétés intrinsèques des tissus non tissés sont déterminées par les propriétés individuelles des fibres qui les composent; leur diamètre, leur porosité et leur orientation (Chen et al., 2019). Certains de ces tissus non tissés ont une excellente résistance à l’humidité ou ou une excellente répulsion, ils n’absorbent pas l’eau, mais ils sont perméables à l’air. De plus, ces tissus sont souples, légers, poreux, lavables, jetables, bon marché et faciles à fabriquer. Ainsi, la nouvelle conception d’échangeur proposée peut être réalisée en choisissant des tissus non tissés pour servir de membranes en raison de leurs avantages importants, principalement en ce qui concerne leur perméabilité à la vapeur, leur résistance au liquide et leur faible coût de fabrication. Le choix principal de ces matériaux dépend principalement de la capacité de la membrane à transmettre de la vapeur d'eau de manière à maximiser la chaleur et le transfert de masse.
26
(a) (b)
(c) (d)
(e)
Figure 8: Une collection de différentes membranes a) caisses d'oreillers, b) sac, c) sous-toiture, d) enveloppe de courrier Tyvek, e) nano-fibres électrofilées
Toutefois, l’utilisation de tissus non tissés qui sont initialement fabriqués pour des raisons autres que l’utilisation à des fins de transfert de chaleur et de masse élargit la portée à de nouvelles perspectives ainsi qu’à de nouveaux défis scientifiques et technologiques. Les défis concernant ces matériaux sont le manque de caractéristiques scientifiques et d'informations sur leurs propriétés. Afin de déterminer leur perméabilité à la vapeur d'eau, ces matériaux ont été testés expérimentalement à l'aide d'un essai à la coupe modifiée et la méthodologie utilisée sera discutée dans le prochain chapitre.
27
1.4 La problématique de la thèse
Les systèmes hybrides de compression de vapeur à base de desiccant liquide semblent des candidats fiables qui permettent un contrôle adéquat de l'humidité dans les applications de climatisation et un fonctionnement sans givre dans le cas de la réfrigération, avec un COP potentiellement accrue. Comme le dessiccant solide présente l'inconvénient des températures de régénération élevées et de la complexité de leur intégration dans les systèmes, les dessiccants liquides sont plus attrayants en montrant des températures de régénération basses et des capacités de déshumidification remarquables. D'après les recherches il a été déterminé que la configuration du système hybride et son architecture offrent une grande efficacité dans toute une gamme de conditions d'exploitation avec différents rapports de charge latent à sensible. Cette gamme de conditions d'exploitation varie d'une architecture à l'autre; il est clair que le maintien d'un système hybride à haute performance ne pourrait être réalisé que par une conception flexible fonctionnant tout au long d'une saison de manière efficace sur le plan énergétique. Ceci définit l'objectif final de cette thèse de concevoir des systèmes hybrides de climatisation à haute performance, abordables et flexibles, ainsi qu'une méthodologie de conception et des outils de modélisation. Le déshumidificateur et le régénérateur d'un tel système hybride sont considérés comme les principaux éléments et leur conception propre a une incidence considérable sur le contrôle de la température et de l'humidité. Comme nous l'avons vu, l'un des défis liés à ces échangeurs est leur capacité d'empêcher l’entrainement des gouttelettes de solution dessiccante vers l'air en évitant les problèmes de corrosion tout en les gardant simples à construire et à faible coût. Les échangeurs membranaires à constituent une réponse technologique à ces problèmes, mais les technologies existantes présentent de nombreux inconvénients, comme nous l'avons expliqué. Dans cette thèse, la nouvelle technologie présentée dans la section précédente sera soigneusement étudiée. Elle utilise de nouveaux matériaux membranaires et une nouvelle conception liée à la distribution de liquide. Les défis concernant ces matériaux sont le manque de caractéristiques scientifiques et d'informations concernant leurs propriétés, principalement leur perméabilité de la vapeur d'eau. Pour découvrir cette propriété, ces matériaux sont testés expérimentalement à l'aide d'une méthode modifiée de coupe verticale et la méthodologie utilisée sera discutée dans le prochain chapitre.
Le troisième chapitre de cette thèse vise à comprendre profondément le comportement et la performance de ce nouvel échangeur. La bonne compréhension et la modélisation des transferts couplés de chaleur et de masse au sein de cet échangeur innovante sont des facteurs clés pour les intégrer efficacement dans les processus et pour bénéficier de leurs avantages par rapport aux technologies conventionnelles existantes. Une approche de modélisation des phénomènes de transfert de chaleur et de masse est développée en modélisant les échangeurs conçus et est soutenue par une caractérisation expérimentale.
Ce modèle est utilisé dans le dernier chapitre pour étudier l'intérêt énergétique de l'intégration de ces échangeurs dans les applications de climatisation et pour concevoir une architecture flexible capable de faire face à la variation saisonnière du rapport de charge thermique.
28
Chapter 1 Context, State of the Art and Problem
Statement
1.1 Context
1.1.1 The energy and environmental context
Energy and environment are the most trending worldwide issues that seem to be of a serious concern for societies. Global warming represents the major environmental problem that the world is facing nowadays. The principal cause of global warming is the emission of CO2 in the atmosphere which is caused mainly by the burning of fossil fuels. Burning fossil fuels such as oil, coal and natural gas does not only generate CO2 (the main greenhouse gas) but also generates other pollutant gases like SOx, NOx, CO and fine particles (Bose, 2010). These greenhouse gases (GHG) trap the solar heat in the atmosphere and raise the earth’s temperature causing harmful impacts on the environment. Across the globe, the past five years have been recorded as the hottest years (e.g. year 2018 was considered to have very high unusual temperatures and ranked as the fourth hottest year on record). Further increase in temperature is estimated by the United Nations IPCC (Climate Change 2014 Summary for Policymakers, 2014). As mentioned in their report an increase in the global mean surface temperature is expected by the end of this century under three possible scenarios. The most optimistic one would be through applying stringent mitigation measures whereas the worst one would be through maintaining the same rate of GHG emissions. In the first scenario the increase would be from 0.3°C to 1.7°C, while in the baseline scenario the increase can reach higher values from 2.6°C to 4.8°C.
This increase triggers the usage of more electricity for cooling purposes. Likewise, the climate change in some cold countries such as North America and due to colder-than-average temperature in winters, an additional increment in heating requirements is expected. In 2018, a rise by 4% was recognized in the global energy demand presenting the fastest pace since 2010 after the recovery of the global economy from the financial crisis. Studies indicate that about one fifth of the increase in energy demands was directly related to the change in weather conditions (IEA, 2018, p. 2). In addition to the increase in the heating and cooling demands, some other factors affect the electricity consumption. It is interesting to mention that the United States and China together account for around 70% of the global demand growth reflecting by that the high standards of living in the first country and the rapid growth in the industrial sector in the second. The graph in figure 1.1 shows the continuous growth in the electricity consumption over the past few decades.
29
Figure 1.1: World electricity final consumption by sector
In year 1990 the world electricity consumption was 9699 TWh and in 2016 this value has reached 20864 TWh, 3.2% above that of 2015. The growth in the electricity consumption mainly took place in the building sector that constitutes the residential as well as the commercial and public service buildings as observed in the graph of fig. 1.1. The share of residential combined with the commercial and public service sectors increased from 46% in 1990 to 49.3% in 2016. This makes the building sector the highest electricity consumer surpassing the industrial share. Although the electricity consumed by the industries has incremented throughout the years yet its share has fallen from 46.5% in year 1990 to 41.6% in year 2016, yielding the share mostly towards the commercial and service sector. Thus, It can be clearly noticed that the building sector contributes to around half of the global electricity consumption. This is due to the excessive use of electronic and telecommunication equipment and to the employment of heating and cooling systems that consume lots of electricity.
As the need for electricity grows, fulfilling this demand has been challenging concerning the sources used to generate electricity. As per the report of the International Energy Agency (IEA) in 2018, around 64% of our electricity is produced by fossil fuels of which 38% comes from coal, 23% comes from gas and 3% from oil. 10% of the global electricity demands are generated by nuclear sources and the remaining 26% comes from renewable resources. The following figure (fig. 1.2) summarizes the worldwide change in the shares of the sources used to generate electricity in the past 14 years (“World Energy Outlook,” 2018)
46.5 43.5 42.5 41.3 41.4 42.7 41.6 26 28.1 28.1 27.9 27.8 27 27.2 20.1 21.8 23.5 23.4 23.1 22 22 4.9 4.7 4.2 5.8 6.0 6.7 7.4 2.5 1.9 1.7 1.7 1.6 1.7 1.7 0 5000 10000 15000 20000 25000 0 10 20 30 40 50 60 70 80 90 100 1990 1995 2000 2005 2010 2014 2016 E lectr icity C o n su m p tio n (T W h ) P er ce n tag e (%)
Industry Residential buildings Commercial & public services
30
Figure 1.2: Global electricity generation by source and its evolution throughout the years
Different policies are already established by governments all over the world including the Nationally Determined Contributions achieved in Paris agreement in 2016 to reduce emissions and energy consumption. If these policies are adopted the share of coal will decrease from 38% to 25% in year 2040 according to the IEA. This is in favor for a significant development in the renewable energy shares including solar, wind, hydro and marine sources that could reach 40%. Whilst if more strict approaches are followed under a sustainable development scenario, the coal’s share would decrease to 5% in 2040 and that of renewable energy would reach 66% (“Sustainable Development Scenario,” 2018).
The sources used to generate electricity are moving the world into a significant climate change through the emission of GHG and most critically the CO2. It has been estimated that man-made fossil fuel burning including cement production is responsible for around 91% of atmospheric CO2 generation in 2015 (Griffin, 2017).The combustion of solid fuels (e.g. coal) contributes to the highest percentage (42%) among them, followed by the liquid fuels (e.g. oil) with 33% and then gases (e.g. natural gas) with 18%. These primary sources are mainly used by people in the form of electrical devices, transportation, heating and cooling, industrial production, communication and services, etc. Studies show that around half of the global CO2 emissions is due to electricity and heat production. Other sectors such as oil-based transport and manufacturing industries contribute to about 20% (Ritchie and Roser, 2017). The distribution of CO2 emissions from fuel combustion by sector is shown in the following chart of figure 1.3 along with the evolution of the CO2 atmospheric concentration over 24 years.
31
Figure 1.3: World percentage CO2 emissions by sector with its atmospheric concentration in ppm
Over the course of few decades, the global concentration of CO2 in the atmosphere in particles per million (ppm) was observed and studied by scientists. According to NOAA the particles of CO2 per million molecules of dry air increased significantly (NOAA, 2019). The CO2 atmospheric concentration shown in figure 1.3 is based on data records through the direct measurements of CO2 in the atmosphere at Muana Loa Observatory in Hawaii. The data reveals that the global atmospheric carbon dioxide concentration was 354 ppm in year 1990 and reached around 399 ppm in year 2014.
The curve of the CO2 data is widely recognized to have a possible exponential nature and thus its future behavior could be predictable. By introducing the measured values in a model and applying several corrections related to oil shocks, population increase and other factors that might affect CO2 production, extrapolation would give a future evolution of CO2 concentration in the atmosphere (“Concentrations de CO2 dans l’Atmosphere. Elements de Prospective,” 2015). According to the model prediction of the CO2 levels if the worldwide emissions continue with a similar pace following the same trend the numbers might reach 510 ppm in the year 2050.
The trend of other GHG is similar to that of CO2 and the consequences of the continuous growth in the emissions are undesirable and potentially harmful. If global warming keeps increasing, significant climate change will occur and severe long term effects will take place. These impacts involve higher sea levels due to the melting of the ice mass at the poles threatening coastal cities and low-lying areas. According to the European space agency (ESA)there had been a rise in 20% of the sea levels between 1992 and 2012 (ESA, 2018). Other impacts include severe dryness in tropical climates mainly in Africa and India, extreme weather events like floods and storms, increased acidity of oceans and more polluted air (Wilkinson et al., 2007). These changes are most likely to affect humans’ health through the deterioration in water and food security.
43.3 44.8 47.1 48.2 48.8 49 20 20.9 22 21.1 20 20.5 20 19.1 17.4 18.3 20 20 13.1 12.4 11.4 10.3 9.2 8.5 3.7 2.8 2.2 2.2 2.1 2 330 340 350 360 370 380 390 400 410 0 10 20 30 40 50 60 70 80 90 100 1990 1995 2000 2005 2010 2014 C o n cen tratio n o f C O2 in th e atm o sp h er e (p p m ) P er ce n tag e (%)
Electricity & heat production Transport
Manufacturing industries & construction Residential buildings, commercial & public services
32 Moreover, climate change induces the spread of infectious diseases and higher-than-normal temperatures result in the disruption of our ecosystem reducing the resources needed for a healthy lifestyle (Kovats and Butler, 2012).
Furthermore, climate change induces damaging effects on the global economic development. According to the International Labor Organization (“World Employment and Social Outlook 2018 – Greening with jobs,” 2018), the agricultural crops are expected to decline affected by the global increase in temperature and dryness threatening about 1.2 billion jobs directly dependent on ecosystem services. These might include employments in agriculture, fisheries and forestry especially in developing countries like India and Brazil that are directly affected by global warming. In addition to the unemployment, agricultural deterioration raises the food prices enhancing malnutrition and poverty.
1.1.2 The refrigeration and cooling context
The growth in population and in technological advancements in the past few decades has surged the demand for more energy and thus higher electricity consumption. Cooling has an important share in electricity consumption and one of the things we are certain about is the global increase in the need for space cooling for decades to come. Both the building sector and the industrial sector confront an increase in the electricity consumption mainly related to the space and process heating/cooling purposes. This rise is a result of the economic and population growth leading to a greater thermal comfort desire. The climate change with the global temperature increment tends to additionally increase this rise. The graph of figure 1.4 shows the expansion of electricity used for space cooling throughout the years as well as the share of space cooling in the total electricity use in buildings (Birol, 2018);
Figure 1.4: World energy consumption for space cooling in buildings
This demand will keep developing indeed but there might be an uncertainty on how much exactly the rate of growth would be. According to (IEA) two scenarios are suggested to assess the long-term trend of the electricity demand for space cooling. The first baseline scenario focuses on the causes mentioned above related to the increase in population and in the purchasing power associated to higher standards of living. It doesn’t take into consideration any additional policies
0% 1% 2% 3% 4% 5% 6% 0 400 800 1200 1600 2000 2400 Sh ar e o f to tal fin al en er g y ( %) T W h
33 beyond the ones that have already been announced around the world. The second scenario favors a more optimistic trend considering the adoption of further rigorous policies with more efficient cooling measures in the aim of reducing the amount of energy needed. According to the baseline scenario the electricity consumed by space cooling is expected to increase from 1997 TWh in 2016 to 6200 TWh in 2050 while this value would be 3400 TWh if an efficient cooling scenario is followed (45% lower than the baseline projection) as shown in figure 1.5 (Birol, 2018). Hence employing new energy efficient technologies in space cooling contributes to the global energy savings through reducing electricity consumption.
Figure 1.5: World electricity consumption for space cooling in the baseline and efficient cooling scenarios (Birol, 2018)
In order to perform space cooling, air conditioners (ACs) are the most common used appliances worldwide. Very few of them are powered by natural gas and the rest by electricity. The AC systems include split units that are usually used in houses and residential entities and water chillers that are mainly used in commercial buildings. Relying mostly on electricity for the power generation, space cooling contributes to the growth of the overall energy demand. Unsurprisingly, the number of AC units is also expanding as a result of the global increase in temperature and this can be significant from the global stock of these units. As shown in figure 1.6, in year 2000, the number of stocked units of ACs was 815 million and it doubled in 2016 to reach 1622 million. The projected growth in the AC market shows that the lion’s share of the global AC units will be concentrated in the southern countries which are confronting the highest economic development leading to an increased standard of living. These countries are also being the most affected by the increase in the global earth temperature and thus the need for cooling becomes more crucial. The graph indicates that the expectations are at their highest in India, Indonesia and China with just the three of them contributing to half of the total growth in the number of AC units (Birol, 2018)
34
Figure 1.6: Stock of AC in the baseline scenario by country/region (Birol, 2018)
The majority of ACs is based on a vapor compression cycle technology. Conventional vapor compression air conditioning systems use the basic air source heat pump cycle in order to control the climate of our houses or any place where cooling or heating is required. The heat pump extracts heat from one place and transfers it to another. Most of these equipment operate in two modes that allows year-round climate control by heating in winter, and cooling and dehumidifying in summer (Boles and Cengel, 1998). In winter the air-source heat pumps absorb heat from the outdoor air towards the inside of the room while in summer they reject heat from the inside towards outdoor air. They transfer heat by circulating a refrigerant through a cycle of expansion, evaporation, compression and condensation. Its main components are the expansion valve, the evaporator, the compressor and the condenser.
During the cooling cycle, a high pressure liquid refrigerant passes through the expansion valve where its temperature and pressure are reduced at two phases mixture (liquid/vapor). Then it passes by the indoor coil, which in the cooling case is the evaporator, to be fully evaporated after absorbing heat from the indoor space. The vapor then enters the compressor and leaves it at high pressure and high temperature after being compressed. Finally, the high temperature and pressure vapor passes through the condenser which is the outdoor coil where it releases heat to the outdoor space causing the refrigerant to condense into a liquid state before entering the expansion valve to begin the cycle again (Canada and Office of Energy Efficiency, 2004).
1.1.3 The humidity control issue
During hot and humid seasons conventional vapor compression cycles show some limitations since they are supposed to control both sensible and latent loads. Most of these cooling devices can efficiently control the sensible load but they become inefficient when it comes to the control of humidity. In humid climates, the humidity issue is a major contributor to the energy inefficiency of the conventional vapor compression systems. In order to extract humidity, vapor compression cycles lower the air temperature below its dew point temperature to remove its moisture by the condensation process and then reheat it to reach the desired indoor comfort temperature. This process consumes around 20 to 40% of the total energy and increases peak electricity demands (Zhang et al., 2010). Moisture in the air passing over the indoor coil condenses on the coil’s surface and is collected in a pan at the bottom of the coil. In addition to