© Erdrick Leandro Perez Gonzalez, 2021
Development of an analysis tool to quantify the effect of
superheavy load vehicles on pavements
Thèse
Erdrick Leandro Perez Gonzalez
Doctorat en génie civil
Philosophiæ doctor (Ph. D.)
Development of an analysis tool to quantify the effect of
superheavy load vehicles on pavements
Thesis
Erdrick Leandro Pérez-González
Under the direction of:
Guy Doré, Ph.D.
ii
Résumé
L'objectif principal de ce travail était de définir une méthode d'analyse pour l'évaluation des dommages aux chaussées sous l'action des véhicules à très lourdes charges (SHL). L'indicateur proposé est une expression mathématique permettant de calculer le taux de déformation permanente en fonction des états de contrainte décrits par le passage d'un véhicule SHL, ce qui permet à la fois de définir la charge maximale acceptable sur les matériaux de la chaussée, sur la base d'un critère de service, et de quantifier les dommages et l'impact du véhicule non standard par rapport au trafic lourd classique. La première partie des travaux (chapitres 1 et 2), a consisté à définir la manière dont l'évaluation de la détérioration de la chaussée sera effectuée. A cet effet, un paramètre de quantification de la détérioration a été choisi sur la base de la déformation permanente accumulée pendant le transit d'un véhicule SHL, pour les couches granulaires et de fondation. Ce qui précède est basé sur les informations disponibles dans la littérature, où il est reconnu que la déformation permanente dans la structure de la chaussée est l'une des détériorations les plus probables, en raison de l'ampleur et de la forme de la distribution des contraintes induites par les véhicules SHL. La deuxième partie du travail (chapitres 3 à 5) a consisté à développer, calibrer et valider le modèle proposé, en utilisant des tests en laboratoire, l'analyse de modèles par éléments finis, ainsi que des tests de charge accélérés et des tests sur le terrain avec des véhicules SHL en conditions réelles. A l'issue de cette phase, la procédure de calibrage du modèle en laboratoire et de son application aux conditions de terrain a été obtenue. Cette phase comprend la définition de valeurs seuils (maximales) pour la détérioration par déformation permanente dans des conditions SHL. Dans la dernière phase des travaux (chapitres 6 et 7), une méthodologie complète a été proposée pour l'application du modèle de taux de déformation dans les cas des véhicules SHL, et elle a été comparée aux méthodologies actuelles.
iii
Abstract
This work's main objective was to define an analysis method for evaluating the damage in pavements under the actions of vehicles with super heavy loads (SHL). The proposed indicator is a mathematical expression to calculate the permanent deformation rate as a function of the stress states described by an SHL vehicle's passage. This indicator allows both to define the maximum acceptable load on the pavement materials based on a serviceability criterion and quantify the damage and impact of the non-standard vehicle compared to conventional heavy traffic. The first part of the work (Chapters 1 and 2) defines how the assessment of the pavement's deterioration will be carried out. For this purpose, a damage quantification parameter has been selected based on the permanent deformation accumulated during an SHL vehicle's transit in granular layers and subgrade. The above is based on the information available in the literature. It is recognized that permanent deformation in the pavement structure is one of the most probable deteriorations due to the magnitude and form of distribution of stresses induced by SHL vehicles. The second part of the work (Chapters 3 to 5) has consisted of developing, calibrating and validating the proposed model, using laboratory tests, finite element model analysis, and accelerated load tests and field tests with SHL vehicles under real conditions. As a result of this phase, a procedure for calibrating the laboratory model and its application to field conditions has been obtained. This phase includes the definition of threshold values (maximum) for deterioration by permanent deformation under SHL conditions. In the last phase of the work (Chapters 6 and 7), a complete methodology has been proposed to apply the deformation rate model in SHL vehicles' cases, and it has been compared with the current methodologies.
iv
Table of Contents
Résumé ... ii Abstract ... iii Table of Contents... iv List of tables ... xList of figures ... xii
Acknowledgements ... xvi Foreword ... xvii Introduction ... 1 Objectives ... 2 Methodology ... 2 Instrumentation ... 3
Organization of the thesis ... 5
Chapter 1 : Current practices in the analysis of the effect of superheavy vehicles on flexible pavements ... 7
1.1. Résumé ... 7
1.2. Abstract ... 7
1.3. Introduction ... 8
1.4. Pavement Analysis Considering SHL Vehicles ... 8
1.5. Pavement structural response models ... 11
1.5.1. Soil and materials properties ... 13
1.5.2. Load magnitude and axle configuration ... 19
1.6. Pavement performance models... 23
1.6.1. Fatigue cracking ... 24
1.6.2. Rutting ... 27
1.7. Relative damage in SHL analysis ... 29
1.8. Discussion ... 31
1.9. Conclusions ... 35
1.10. References ... 36
Chapter 2 : Assessment of the Permanent Deformation at the Earth-Core of a Rockfill Dam under Heavy Vehicle Loading ... 40
2.1 Résumé ... 40
2.2 Abstract ... 40
2.3 Introduction ... 41
v
2.5 Case study ... 45
2.5.1 Generalities of dam... 45
2.6 On-site testing ... 47
2.6.1 Instrumentation ... 47
2.6.2 Test protocol outline ... 49
2.6.3 Strain and stress measurements ... 50
2.7 Finite element model development and calibration ... 52
2.8 Multi-stage permanent deformation test ... 54
2.8.1 Permanent deformation model ... 54
2.8.2 Specification of load limit conditions for heavy vehicles over the crest of the dam ... 57
2.9 Application example ... 61
2.10 Conclusions ... 63
2.11 References ... 64
Chapter 3 : Analysis model for permanent deformation in granular materials under the action of superheavy vehicles ... 66
3.1 Résumé ... 66
3.2 Abstract ... 66
3.3 Introduction ... 67
3.4 Background ... 68
3.4.1 Shakedown theory in UGM ... 69
3.5 Proposed Approach ... 71
3.6 Experimental Investigation ... 77
3.6.1 Materials ... 77
3.6.2 Sample preparation ... 78
3.6.3 Laboratory protocol ... 79
3.7 Results and Analysis ... 80
3.7.1 Proposed model fit to laboratory data ... 80
3.7.2 Serviceability limits for SHL vehicles ... 82
3.8 Application Example ... 85
3.8.1 Case study ... 85
3.8.2 Stress state and serviceability limit analysis ... 88
3.8.3 PD in base and sub-base layers ... 89
3.9 Conclusions ... 93
vi
Chapter 4 : Use of the permanent strain rate to analyze the effect of superheavy vehicles on pavements: Field
validation ... 97
4.1 Résumé ... 97
4.2 Abstract ... 97
4.3 Introduction ... 98
4.4 Deformation rate of UGMs in SHL vehicle analysis ... 99
4.4.1 Description of methodology ... 99
4.4.2 Lab-field equivalence ... 103
4.5 Test Section And Field Measurements ... 105
4.5.1 Instrumentation and pavement structure ... 105
4.5.2 Materials ... 107
4.5.3 Vehicles and test conditions ... 110
4.6 Results ... 113
4.6.1 Limit state for SHL conditions ... 113
4.6.2 Plastic strain prediction ... 115
4.6.3 Typical values for adjustment parameters ... 119
4.7 Conclusions ... 122
4.8 References ... 123
Chapter 5 : Revision of the plastic strain rate with respect to the stress history: Granular materials and soils 124 5.1 Résumé ... 124
5.2 Abstract ... 124
5.3 Introduction ... 125
5.4 Methodology ... 126
5.4.1 Plastic strain rate for SHL vehicle analysis ... 127
5.5 Full-scale testing and materials ... 129
5.5.1 HVS test section ... 129
5.5.2 Instrumented dam core ... 133
5.6 Materials ... 135
5.7 Results and analysis ... 137
5.8 Conclusions ... 144
5.9 References ... 145
Chapter 6 : Criterion to quantify the effect of superheavy vehicles on pavements, based on layer deformations ... 147
6.1 Résumé ... 147
vii
6.3 Introduction ... 148
6.4 Analysis of pavements under the action of SHL vehicles ... 149
6.4.1 Materials characterization ... 150 6.4.2 Performance models... 151 6.5 Methodology ... 154 6.5.1 Analysis criteria... 154 6.5.2 Reference truck ... 156 6.5.3 SHL vehicle ... 157
6.5.4 Pavements and materials ... 157
6.6 Results and discussion ... 159
6.6.1 Equivalent damage criteria ... 159
6.6.2 Critical strain criteria ... 160
6.6.3 PBD criteria ... 162
6.7 Discussion ... 164
6.8 Conclusions ... 168
6.9 References ... 168
Chapter 7 : Key considerations in the application of the criteria based on the deformations by layers in the context of the province of Quebec: General discussion ... 171
7.1 Introduction ... 171
7.2 Practical applicability of the criteria ... 171
7.2.1 I3C-SHL software in the analysis of the effect of SHL vehicles ... 173
7.2.2 Criteria applied to cases in the province of Quebec ... 173
7.2.3 Additional information obtained during the research project ... 178
7.3 Discussion ... 182
7.3.1 Contributions to the field ... 182
7.3.2 Limitations of the project ... 183
7.3.3 Future work ... 184
Conclusions ... 186
Bibliography ... 188
Appendix A : Heavy Vehicle Simulator (HVS) Testing ... 194
A.1. Introduction ... 194
A.2. Pavement structures evaluated ... 194
A.3. Sensors information ... 196
A.4. Calibration of sensors ... 200
viii
A.4.2. Transverse and longitudinal strain sensors (AC layer) ... 201
A.4.3. Pressure cells ... 202
A.4.4. Moisture measuring sensors ... 204
A.4.5. Temperature sensors (Thermistors) ... 204
A.5. Calibration of wheel contact area ... 206
A.6. Pavements construction and instrumentation ... 208
A.6.1. Subgrade ... 209
A.6.2. Subbase layer (MG112) ... 212
A.6.3. Base course layer (MG20) ... 215
A.6.4. Asphalt concrete layer (EB) ... 218
A.7. Density and elastic modulus of layers ... 221
A.8. Experimental design for HVS testing ... 226
Appendix A.1: Sensor Calibration Sheets... 227
Appendix A.2: Material characterization tests... 239
Appendix A.3: Permanent deformation in the laboratory ... 265
Appendix A.4: Field measurements ... 275
Appendix B : Measurements in the core of the dam ... 287
B.1 Introduction ... 287
B.2 Sensors used in the study ... 287
B.2.1 Positioning of instruments ... 289
Appendix B.1: Sensor Calibration Sheets... 291
Appendix B.2: Material characterization tests... 295
Appendix B.3: Permanent deformation in the laboratory ... 308
Appendix B.4: Field measurements ... 311
Appendix C : Test section in James Bay Road (Route de la Baie James)... 325
C.1. Introduction ... 325
C.2. Sensors used in the study ... 325
Appendix C.1: Sensor Calibration Sheets ... 330
Appendix C.2: Material characterization tests ... 352
Appendix C.3: Permanent deformation in the laboratory ... 360
Appendix C.4: Field measurements ... 370
Appendix C.4.1: Multi-line truck with 18 axles, platform with eight wheels per axle ... 371
Appendix C.4.1-1: November 21st, 2019 - Speed = 2.1 km/h ... 371
Appendix C.4.1-2: November 21st, 2019 - Speed = 1.6 km/h ... 374
ix
Appendix C.4.2: Truck with 13 axles, platform with four wheels per axle. ... 382
Appendix C.4.2-1: June 20th, 2020 - Speed = 1.7 km/h ... 382
Appendix C.4.2-2: June 20th, 2020 - Speed = 2.2 km/h ... 387
Appendix C.4.2-3: June 20th, 2020 - Speed = 6.1 km/h ... 392
Appendix C.4.2-4: June 20th, 2020 - Speed = 13.2 km/h ... 397
Appendix C.4.2-5: June 20th, 2020 - Speed = 12.9 km/h ... 402
x
List of tables
Table 1-1. Coefficients for fatigue model, Eq. [1-16], after Homsi et al. (2012) ... 26
Table 1-2. Calibration coefficients for performance models. Adapted from Huang(2004) and Université Laval (2019) ... 30
Table 1-3. Considerations taken into account in previous experiences with superheavy loads analysis ... 33
Table 2-1. Loads in tires of tandem axle test truck. ... 50
Table 2-2 Linear fit for 𝑝 − 𝑞 at the till-core. ... 51
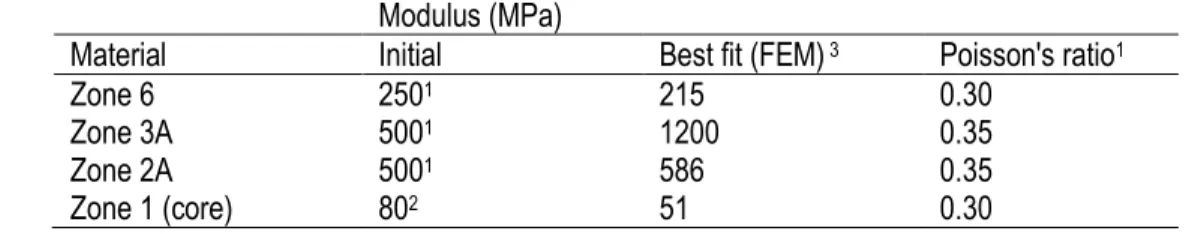
Table 2-3. Material modulus calibrated based on real-scale measurements. ... 54
Table 2-4. Conditions of the till-core sample. ... 55
Table 2-5. Loading sequence for multi-stage permanent deformation test. ... 55
Table 2-6. Permanent strain prediction base on 𝑞/𝑝 parameter. ... 57
Table 2-7. Limit definition for permanent deformation stages. ... 58
Table 2-8. Models for 𝑤𝑚𝑎𝑥 and ℎ𝑒𝑞 ... 60
Table 2-9. Application example ... 61
Table 3-1. Shakedown range boundaries ... 70
Table 3-2. Descriptive statistics ... 75
Table 3-3 𝑁𝑐 fitting parameters ... 76
Table 3-4. Sample properties ... 79
Table 3-5. Parameters for equation [3-9] and [3-10], tested materials ... 81
Table 3-6. Pavement structure ... 86
Table 3-7. 𝑀𝑟 and 𝑁𝑐 to consider at different levels of 𝑆𝑤 ... 86
Table 3-8. Configuration description for SHL truck ... 87
Table 3-9. Estimated permanent strains, for the base and sub-base assembly, in the case of SHL ... 93
Table 4-1. Shakedown range boundaries ... 102
Table 4-2. Location of sensors in the pavement structure ... 106
Table 4-3. Sample properties ... 108
Table 4-4. Parameters for Equations (5) and (6). ... 110
Table 4-5. Evaluation conditions in each case ... 112
Table 4-6. Conditions associated with the adjustment of Equation [1] variables for determining typical values for UGMs. ... 120
Table 4-7. Parameters of the Pérez-Bilodeau-Doré model in different pavement materials ... 121
Table 4-8. Typical parameters for granular materials ... 121
Table 5-1. Conditions to be evaluated in full-scale tests ... 127
Table 5-2. Location of sensors in structures tested with HVS ... 130
xi
Table 5-4. HVS test: Materials modulus ... 131
Table 5-5. Saturation level in materials at the different stages in HVS testing ... 132
Table 5-6. Location of sensors in the dam ... 133
Table 5-7. Dam section: Material modulus and densities (Pérez-González et al., 2020b) ... 134
Table 5-8. Characteristics of the trucks used in the field test ... 135
Table 5-9. Properties and parameters of the Perez-Bilodeau-Doré model of each sample ... 137
Table 5-10. Stress states and predicted plastic strain ranges in HVS testing ... 139
Table 5-11. Stress states measured in Till-Core dam ... 140
Table 5-12. Relationship of proportionality between 𝜀𝑝𝑠𝑠 and 𝜀𝑝𝑝𝑐 ... 144
Table 6-1. Reference truck ... 156
Table 6-2. Load cases evaluated ... 157
Table 6-3. Pavement layer thickness ... 158
Table 6-4. Pavement materials properties ... 158
Table 6-5. Performance model parameters ... 158
Table 6-6. Partial contributions to the total deformation of each pavement layer ... 166
Table 7-1. Characteristics of SHL vehicles analyzed ... 173
Table 7-2. Reference structure for the MTQ procedure ... 174
Table 7-3. Equivalent damage reported by the MTQ in comparison to those obtained with the PBD criterion 175 Table 7-4. Detail of results by layers in case studies ... 177
xii
List of figures
Figure 1-1. Typical instruments in test sections: (a.1) Pressure cell, 200 kPa, (a.1) Pressure cell, 50 kPa, (b) Strain sensors for soil and granular materials, (c.1) LVDTs for MDD, (c.2) MDD head, (d) Displacement
extensometers, (e.1) AC strain sensors, (e.2) Strain sensors installed in AC-cores, (f) Moisture sensors ... 4
Figure 1-1. Typical SHL vehicle: (a) SHL vehicle transporting load, (b) vehicle side view, (c) axles and wheels arrangement. ... 10
Figure 1-2. A simplified summary of the process of analysis of SHLs in pavements ... 11
Figure 1-3. Strains under cyclic loading, based on Huang (2004) ... 14
Figure 1-4. Effect of overlapping stresses on a five-line SHL vehicle (elevation view), based on Mohamed (2016) ... 21
Figure 1-5. (a) Stress level (SL) under SHLs, middle of nucleus, (b) principal stresses under SHL, tire edge, and (c) principal stresses under a standard truck, tire edge. Based on Mohamed (2016) ... 23
Figure 1-6. Parameters of the strain signal: (a) longitudinal and (b) transverse. Based on Homsi et al. (2012) 26 Figure 1-7. Strain conditions considered by Prophète (2014) ... 31
Figure 2-1 Schematic representation of the criteria for classifying shakedown stage based on (a) total permanent strains, and (b) permanent strain rates. ... 44
Figure 2-2. A typical cross-section of the dam. ... 46
Figure 2-3. Grain size distribution in till-core. ... 46
Figure 2-4. Distribution of sensors with the depth. ... 48
Figure 2-5. Instrumentation details within the core of the dam. ... 48
Figure 2-6. Truck weighing and positioning during the test. ... 49
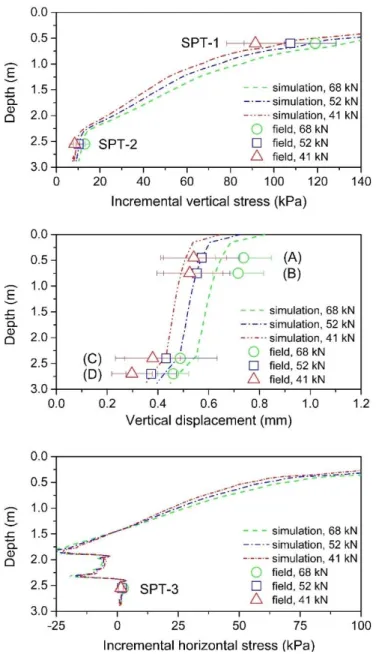
Figure 2-7. Signal registered during Trial 1 (five vehicle passes). (a) Deviator stress (𝒒) measured with SPT-2, and (b) Vertical strains measured with MDD at the top of the core. ... 50
Figure 2-8. 𝑝 − 𝑞 plot at till-core. (a) Field measurements, and (b) laboratory stress levels. ... 51
Figure 2-9. 2D finite element model of the top of the dam. ... 52
Figure 2-10. Simulated stress and displacement profiles with calibrated modulus compared to field measurements ... 53
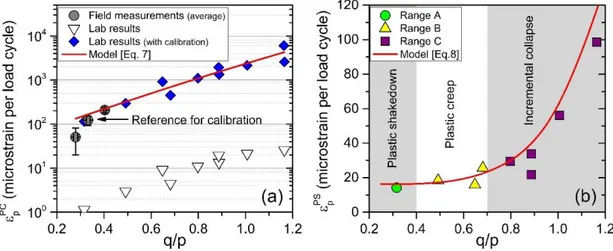
Figure 2-11. Multistage permanent deformation tests: measured values and fitted model. ... 56
Figure 2-12. Permanent deformation stages in till-core of the dam. (a) Post-compaction stage, related to the first load cycles after changing stress state; and (b) Equilibrium stage, related to large number of load cycles. ... 56
Figure 2-13. Shakedown range definition. ... 58
Figure 2-14. Variables that define the acceptability criterion for loads applied on the crest of the dam. ... 59
Figure 2-15. Contour maps of simulation results. ... 59
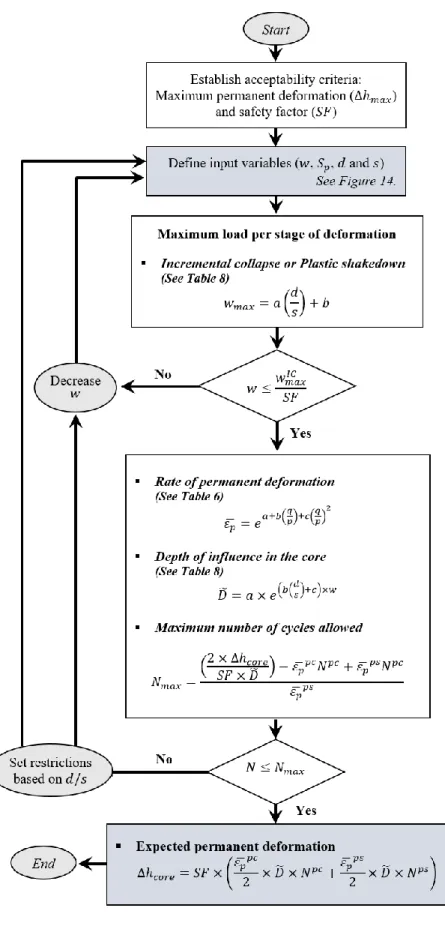
Figure 2-16. Flowchart for the analysis of permanent deformation in the core of the dam caused by heavy vehicles. ... 62
Figure 3-1. Typical trend defined by equation [3-4]... 73
xiii
Figure 3-3. Comparison of predictions for equation [3-6] and Equation [3-7]... 76
Figure 3-4. UGM evaluated in experimental investigation. ... 78
Figure 3-5 Distribution of particle sizes in studied materials ... 78
Figure 3-6. Experimental results, (a) tested stress conditions, (b) accumulated deformation during test ... 80
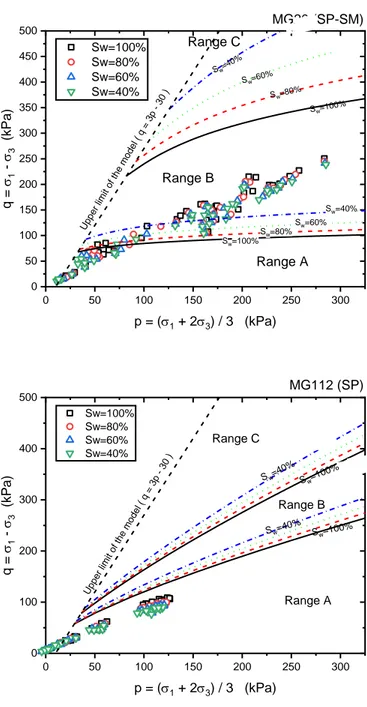
Figure 3-7. Limits between shakedown ranges compared to laboratory measurements. ... 83
Figure 3-8. 𝜀𝑝𝑝𝑐 vs. 𝜀𝑝𝑠𝑠, and boundaries between shakedown ranges. ... 84
Figure 3-9. SHL truck considered in the analysis... 87
Figure 3-10. FEM model ... 87
Figure 3-11. Limit states and stress paths for base and subbase under SHL ... 88
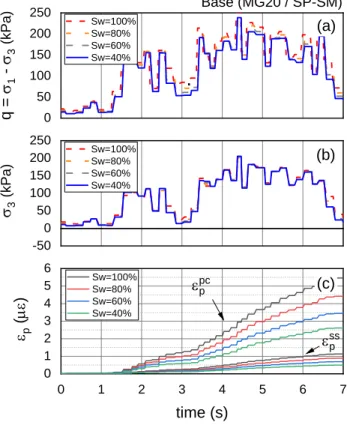
Figure 3-12. Stresses and resulting permanent strain in the base material: (a) deviatoric stress, (b) confining stress, (c) predicted permanent strain ... 90
Figure 3-13. Stresses and resulting permanent strain in subbase material: (a) deviatoric stress, (b) confining stress, (c) predicted permanent strain ... 91
Figure 3-14. Permanent strains analyzed transversely in an SHL vehicle ... 92
Figure 4-1. Deformation rate representation for 𝜀𝑝𝑝𝑐 and 𝜀𝑝𝑠𝑠 (a) natural scale, (b) semi-logarithmic scale. ... 100
Figure 4-2. Calibration process and use of the Pérez-Bilodeau-Doré model for strain rate in SHL analysis .. 103
Figure 4-3. Representation of laboratory and field stress signals. (a) expected stress signal in the laboratory, (b) reference load cycle in the laboratory, (c) expected stress signal in the field, (d) reference load cycle in the field. ... 104
Figure 4-4. Schematic representation of the pavement and the position of the instruments ... 106
Figure 4-5. Installation of instruments on site. Depth 1320mm. ... 107
Figure 4-6 Distribution of particle sizes in UGMs ... 108
Figure 4-7 Multi-stage permanent deformation test results ... 109
Figure 4-8. (a) Truck A: Multi-line truck with 18 axles, platform with eight wheels per axle, (b) Truck B: Truck with 13 axles, platform with four wheels per axle. ... 110
Figure 4-9. Reference points aligned with the centerline of the instrumentation on each truck evaluated ... 111
Figure 4-10. Deviatoric stress at 420mm depth for truck B in regular and critical conditions. ... 112
Figure 4-11. Test conditions: (a) measured modulus of elasticity in summer, (b) temperature profile in winter. ... 113
Figure 4-12. Limit state and stress paths measured in the field. (a) MG20 (GW) at 420mm depth, (b) MG112(SP) at 1320mm depth. ... 114
Figure 4-13. Set of field measurements, stress and strain signals. Truck A at 2.1 km/h (winter)... 116
Figure 4-14. Set of field measurements, stress and strain signals. Truck B at 1.9 km/h (summer) ... 117
Figure 4-15. Predicted range and field measurements: (a) MG20 (GW) at 420mm depth, (b) MG112 (SP) at 1320mm depth, (c) deformation rate index for each case study ... 118
xiv
Figure 5-2. Instrumentation and HVS: a) sensors positioning during pavement construction, b) asphalt concrete
layer surface, c) HVS in position ... 131
Figure 5-3. A typical signal in the HVS test, transversal strain in the AC layer. (a) EB150, (b) EB75 ... 132
Figure 5-4. Dam section: Cross-section and instrumentation layout ... 133
Figure 5-5. Trucks used during field tests: (a) trucks A and B, (b) trucks C, (c) trucks D, (d) line of trucks waiting to go through the test section ... 134
Figure 5-6. Particle sizes distribution in studied materials ... 135
Figure 5-7. Accumulation of plastic strain in real-scale tests: (a) HVS test, (b) dam section ... 138
Figure 5-8. HVS testing: Comparison between the 𝜀𝑝 predicted ranges and 𝜀𝑝 measured ... 139
Figure 5-9.Dam measurements: (a) Deformation rate measured against the estimated range, (b) probability of accurate prediction... 141
Figure 5-10. Variation of 𝐼𝜀𝑝 when increasing the number of load repetitions: (a) base in HVS, (b) subbase in HVS, (c) subgrade in HVS, (d) core in dam section. ... 142
Figure 6-1. SHL truck considered in the analysis... 157
Figure 6-2. Equivalent damage based on AI performance models: (a) Fatigue, (b) Rutting ... 159
Figure 6-3. Critical strain criteria: (a) AC layer, (b) Subgrade ... 161
Figure 6-4. Partial deformations equivalency by layers: (a) AC layer, (b) Granular materials, (c) Subgrade .. 163
Figure 6-5. Equivalent damage criteria vs. Deformations by layers criteria ... 164
Figure 6-6. Transverse deformation resulting predicted using the Pérez-Bilodeau-Doré model. (a) Granular materials in Structure 1, (b) Granular materials in Structure 4, (c) Subgrade in Structure 1, (d) Subgrade in Structure 4. ... 167
Figure 7-1. Flowchart of the criteria developed ... 172
Figure 7-2. Comparison of results between MTQ criteria and the PBD criterion ... 176
Figure 7-3. Sensor installation and arrangement in the AC layer ... 178
Figure 7-4. Strain in AC layer, 13-axle truck, platform with 4 wheels per axle. ... 180
xv
This work is dedicated to my children,
Matías and Helena. You have made me more
fulfilled than I could have ever imagined. I
love you.
xvi
Acknowledgements
This work would not have been possible without the support and encouragement given by many people. I must first thank my wife, Thayra Garcia, who supported me in so many ways to fulfill this dream. Thank you very much for your patience and help.
I want to express my sincere thanks to my research director, Guy Doré, for allowing me to work with his excellent team, for his guidance and suggestions, and for trusting me throughout this project.
Special thanks are due to the i3C-Research Chair/Université Laval, led by Prof. Guy Doré, who sponsored the research and funded me for the study period; as well as to all the team that accompanied me during this time: Jean-Pascal Bilodeau, who supported me too many times for the discussion and exchange of ideas, always pushing the level of this work to the top. Chantal Lemieux and Pauline Segui offered me their support from day one, from a technical-administrative point of view and from a human point of view, which is invaluable; thank you. Sylvain Auger and Christian Juneau gave me their technical and scientific assistance, without which this project would be incomplete. Thank you all.
A warm thank you to my fellow i3C and ARQULUK students. Who, with their friendship and camaraderie, offered me more support than they realize: Bahar Ahoughalandari, Heather Brooks, Xiangbing Kong, Youness Berraha, Vincent Boishardy, Vincent Carrier, Charles-Antoine Bordeleau, Maria Baron, Jesus Cruz, and many others, thank you very much.
xvii
Foreword
This doctoral project was conducted at Laval University as part of the NSERC industrial research chair on the interaction of heavy loads, climate and pavements (i3C chair). The thesis is presented as a collection of articles. Six articles were written as part of this doctoral research project, of which one has already been accepted for publication, and the rest have been summited for review to specialized journals. The place of each article in the thesis structure is detailed in the Introduction of this document.
The articles presented in this thesis have been written as contributions from different authors. In all cases, the author of this thesis appears as the first author, contributing to the analysis of the information, the formulation of methods and criteria and the preliminary and final writing of the different articles. The co-authors collaborated in the conceptual review of the activities, in the definition of protocols and experimental evaluations, and discussed the concepts of the project's results. Likewise, the co-authors have always reviewed the articles' writing and offered recommendations that allowed greater clarity in writing.
In addition to the written articles, analysis software was developed in the framework of this project. The first author of this work developed this software under the supervision of Prof. Guy Doré, director of this research work, and Dr. Jean-Pascal Bilodeau, research professional associated with the i3C chair.
1
Introduction
The NSERC industrial research chair on the interaction of heavy loads, climate, and pavements at Laval University (i3C Chair) has its primary objective to develop knowledge and tools to master pavements' structural and functional performance subjected to heavy vehicle loads in the Canadian climate context. M. Guy Doré, professor in the Department of Civil and Water Engineering, headed the i3C Chair in its first phase running from 2008 to 2013, and its second phase from 2015 to 2020. This research project has been completed between 2017 and 2020 as part of the objectives set by the second phase of the i3C research chair, studying the effect of non-conventional loads on pavements in the contexts of the province of Quebec (Canada). In this project, we worked closely with the i3C Chair's research partners, highlighting the participation of HydroQuebec and the Ministère des Transports du Québec (MTQ).
In this project, the importance of transporting indivisible elements with load magnitudes and dimensions that exceed conventional conditions is considered. The need to transport these elements is essential in Quebec's province for the operation, expansion, and maintenance of various industries fundamentals to the economic, social development and the general functionality of the province (i.e. hydroelectric, mining). The use of the road network allows reducing the time and cost of transport. Given this, the accessibility to the road system by this type of non-conventional vehicles has a decisive importance in the transport chain's planning and efficiency. One of the concerns when authorizing the road network's use to special vehicles is their damage to the pavement's integrity, both functional and structural. Premature or unforeseen damage to the road network can adversely affect land transport capacity and directly influence vehicle operation costs associated with their use. The estimation of damage caused by superheavy load (SHL) vehicles has been studied using different analytical approaches. Currently, the use of mechanistic-empirical approaches offers the most rational alternative for considering the conditions described by this type of vehicle, mainly because of the ability to simulate in a relatively simple way the structural response of the pavement using techniques commonly used in practice. However, this approach is limited by the capabilities of the performance models used, which consider only conventional heavy vehicles' conditions. The predictions of this type of performance models can be very conservative in high strains and omit the stress states' variation during the circulation of a single SHL vehicle. Currently, there is a growing concern to optimize decision making in the area of road infrastructure. Notably, in the SHL vehicle analysis, to base decisions on very conservative methods would cause rejection of competent road sections, thus increasing transportation costs. In general, today's methods have provided satisfactory results; however, these have limited capabilities in effectively considering the stress conditions described by the
2
SHL vehicles. Considering this reality, it is possible to identify the room for improvement in the analysis criteria currently available, which is explored in this work.
Objectives
The thesis's final objective is to develop an analysis tool to quantify the damage caused by SHL vehicles on pavements. To this end, the following partial objectives have been pursued:
a. Review the existing methods and criteria to analyze pavements in non-conventional loading conditions. b. Define a damage quantification parameter that reflects the evolution of the pavement state during the
passage of an SHL vehicle
c. Determine threshold values defining the limit states of pavement materials subjected to non-conventional loading conditions
d. Calibrate and validate the proposed criteria under real-scale load conditions
e. Develop an application procedure of the proposed criteria, and associate this with a practical computer tool.
Methodology
In this research, the analysis of the effect of SHL vehicles will be defined by different phases, as follows: (1) definition of the maximum permissible load, (2) definition of the maximum number of vehicle passes, and (3) quantification of the damage. These phases are intended to support infrastructure owners' and managers' decision-making concerning the movement of non-conventional vehicles on the local or provincial road network. The first step was to lay the foundations for assessing SHL vehicles' impact on pavements (Chapter 1). For this purpose, the techniques usually referred to during the analysis of non-conventional loads on pavements have been examined. Once these bases were established, the parameter taken as a representative indicator of the
3
general damage to the structure, the permanent deformation, was studied. For this purpose, laboratory tests, numerical simulation and full-scale tests were used.
The first approximation to a solution method was defined for a particular case, associated with a dam's core (Chapter 2). The permanent deformation rate was identified as a rational indicator for analysis. In this case, it was also possible to identify the need to characterize the deformation rate in the post-compaction phase and in the shakedown state to mitigate the stress history's uncertainty when applying an increase of load magnitude in pavement materials. Subsequently, a mathematical formulation for deformation rate was established from this point, extending the principles described in Chapter 2 to more comprehensive ranges and stress conditions (Chapter 3).
Next, the application of the model and criteria defined to real-scale conditions was studied (Chapters 4 and 5) and identified the parameters that can be simplified to improve the proposed criterion's practical applicability. To analyze the case studies, detailed information on the characteristics of the pavements was used. Laboratory tests have been carried out on samples taken from the structures, and detailed instrumentation for recording the mechanical response to the load's conditions was set in place.
Finally, taking into account what was found in the previous phases, a criterion was established to calculate SHL vehicles' impact on pavements. It was compared with other available criteria (chapters 6 and 7). Thus, it was necessary to develop an analysis software (i3C-SHL), which allows applying the methodology proposed in this work practically.
Instrumentation
A set of instruments was used in different full-scale test sections to record the stresses, deformations and displacements in the structures under the action of heavy and SHL vehicles. The description of the instruments was provided in the various articles where required; however, to minimize repetition in this document, the description of the instruments used in this project will be listed below and will be omitted in subsequent chapters. Figure 1 shows the various sensors used during field measurements.
a. Pressure cells (Precision ±10-2 kPa). Gauge to measure the stresses in unbounded layers and soils.
4
b. Strain sensors for soil and granular materials (Precision ±10-5 mm). High-precision sensors for
measuring vertical deformation over a length of 150mm used to record elastic and plastic strains. c. Multi-depth deflectometer, MDD (Precision ±10-3 mm). A system characterized by four LVDTs
connected to a series of concentric tubes having platens positioned at specified horizons in the pavement structure. It is used to measure the instantaneous elastic deflection and the permanent deformation on a vertical axis under the wheel load at several depths in the test sections.
d. Displacement extensometers (Precision ±10-5 mm). High precision instruments placed in a longitudinal
and transverse direction to the load movement to measure horizontal strains (elastic and plastic) over a length of 1000mm.
e. Asphalt concrete strain sensors (Precision ±10-5 ). Fiber optic sensors for measuring transverse and
longitudinal deformations in the bottom of the asphalt concrete layer.
f. Moisture sensors (Precision 0.01%): Moisture sensors used to measure water content in granular materials and soil
Figure 1-1. Typical instruments in test sections: (a.1) Pressure cell, 200 kPa, (a.1) Pressure cell, 50 kPa, (b) Strain sensors for soil and granular materials, (c.1) LVDTs for MDD, (c.2) MDD head, (d) Displacement extensometers, (e.1) AC strain sensors, (e.2) Strain sensors installed in AC-cores, (f) Moisture sensors
5
Organization of the thesis
The document has nine chapters, including the introduction and conclusion, which are unnumbered chapters. Six articles, published or submitted for review, written by the main author of this research, are part of the thesis structure. The content of each chapter and the position of each of the articles is presented in the following paragraphs:
Chapter 1 presents a review of the literature; it provides the basis of the current methods and criteria in SHL vehicle analysis, the elements that can be incorporated to improve the analysis approaches, and the gaps in the state of knowledge. This chapter corresponds to an article submitted for review (July 2020) in the framework of this project, with the following reference:
Pérez-González, E., Bilodeau, J.-P., Doré, G., (2021). Current practices in the analysis of the effect of superheavy vehicles on flexible pavements. Canadian Journal of Civil Engineering (Under review)
Chapter 2 presents a methodology developed in this research to analyze plastic deformations in the core of dams. This chapter presents the fundamental criteria for subsequent chapters, such as the characterization of the permanent deformation behavior through the deformation rates in the post-compaction phases and the shakedown state. This chapter corresponds to an article accepted for publication (April 2020), with the following reference:
Pérez-González, E., Bilodeau, J.-P., Doré, G., Doré-Richard, S., (2020). Assessment of the permanent deformation at the earth-core of a rockfill dam under heavy vehicle loading. Canadian Geotechnical
Journal. DOI: 10.1139/cgj-2019-0449
Chapter 3 presents an extension of the approach described in chapter 2. A predictive model with a broader application is presented. Limit states based on the deformation rate and the applicability of the model in the case of SHL vehicles are included in this article. This chapter corresponds to an article submitted for review as part of this project, with the following reference:
6
Pérez-González, E., Bilodeau, J.-P., Doré, G., (2021). Analysis model for permanent deformation in granular materials under the action of superheavy vehicles. Transportation Geotechnics (Under review)
Chapters 4 and 5 show the validation of the models and criteria described in chapter 3. Chapter 4 focuses on studying the consistency of model predictions with field measurements made to SHL vehicles in winter and summer conditions. Chapter 5 discusses the model's ability to predict ranges of deformation rates at different times in the materials' stress history. These chapters correspond to articles sent for review as part of this project, with the following reference:
Pérez-González, E., Bilodeau, J.-P., Doré, G., (2021). Use of the permanent strain rate to analyze the effect of superheavy vehicles on pavements: Field validation. Transportation Geotechnics (Under review) Pérez-González, E., Bilodeau, J.-P., Doré, G., (2021). Variation of plastic strain rate with stress history: Granular
materials and soils. International Journal of Pavement Engineering (Under review)
Chapter 6 presents the application of the models and criteria described in the previous chapters. It describes quantifying the damage caused by SHL vehicles using the deformation rate model and compares its results with those of other criteria commonly used in practice. This chapter corresponds to an article submitted for review with the following reference:
Pérez-González, E., Bilodeau, J.-P., Doré, G., (2021). A criterion to quantify the effect of superheavy vehicles on pavements based on layers deformation. International Journal of Pavement Engineering. (Under review)
Chapter 7 presents the general discussion on the method resulting from this research project, including comparing results obtained with the method currently applied in Quebec and recommendations for future research. Finally, the last chapter presents the main conclusions of this project.
7
Chapter 1 : Current practices in the analysis of the
effect of superheavy vehicles on flexible
pavements
E. Pérez- González; J-P. Bilodeau; G. Doré
1.1. Résumé
L'analyse de l'effet des véhicules présentant des charges et des conditions d'essieux hors normes sur les chaussées est une tâche difficile pour les ingénieurs. Les résultats de cette analyse permettront de déterminer si l'utilisation du réseau routier par ce type de véhicule sera autorisée ou non. Par conséquent, il s'agit d'une partie fondamentale de la planification et de l'estimation finale des coûts associés au transport de charges spécifiques. Dans la littérature disponible, différentes approches sont présentées pour résoudre ce problème. Dans le présent document, le contexte commun de ces approches est présenté, et leurs avantages et limites sont examinés. Une compilation de différents critères peut être utilisée pour couvrir plus largement les aspects pertinents pour ce type d'analyse. Toutefois, certaines faiblesses conceptuelles peuvent être identifiées dans certaines méthodes utilisées actuellement, ce qui laisse de la place pour des recherches futures visant à améliorer la manière dont l'effet des véhicules super-lourds (hors normes) est analysé.
1.2. Abstract
The analysis of vehicles with atypical load magnitudes and axle conditions on flexible pavements is challenging for engineers. The results of this analysis will determine whether the use of the road network by this type of vehicle will be authorized or denied. Consequently, it is a fundamental part of the planning and final cost estimation associated with transporting specific loads. In the literature available, different approaches are presented to address this problem. In this paper, the common background in these approaches are presented, and their advantages and limitations are discussed. A compilation of different criteria can cover more broadly the aspects relevant to this type of analysis. However, some conceptual weaknesses can be identified in some standards currently available, leaving room for future research to improve how the effect of superheavy vehicles is analyzed.
8
1.3. Introduction
The transport of super heavy loads (SHL) is a fundamental practice for developing and maintaining the economic sectors, such as those associated with hydroelectric plants, oil refineries, and the mining industry. Conditions defined by this type of load on the pavement are usually associated with: (1) high load rate, (2) low traffic speed, (3) limited rest period between consecutive axles, and (4) three-dimensional variation in the stress states in the pavement. Combining the above generates particular stress and strain conditions that can make it challenging to study with the models used in regular pavement engineering practice.
It is recognized that computed pavement responses are generally sensitive to wheel locations and the interaction between the various wheels on a given axle (ARA Inc, 2004). Given this, SHL analysis has been based on mechanistic-empirical methods, as this offers a more rational way of studying the response of the pavement to loads. Different practical considerations have been made over time to use the methods and criteria available in the standard mechanistic-empirical methods in the analysis of SHL. However, few efforts have been reported concerning the reliability associated with the use of these criteria for the conditions defined by this type of load. Two fundamental elements must be considered in the analysis of SHL vehicle conditions using the mechanistic-empirical approach: (1) adequate simulation of the load configuration and (2) consistency and reliability of the performance models in predicting the expected behaviour. Although it is acknowledged that the simulation of load conditions as expected in the field is the most accurate way to perform SHL analysis, the time required for this task has led to the fact that a large part of the studies has been devoted to defining simplified ways to simulate the effect of the load adequately. On the other hand, a limited amount of studies have been done to develop performance models to consider stress and strain conditions induced by an SHL vehicle.
This work aims to present a state of the practice for the criteria and techniques used to analyze pavements subjected to SHL conditions. This will complement some methods described in the literature that could influence or improve the conclusions drawn in the analysis. Their validity and applicability in practice will be discussed afterward, identifying the limitations of current approaches, which should be considered by practicing engineers and research opportunities that would allow mitigating these limitations.
9
The pavement is a multilayered linear structure whose purpose is to allow vehicles' operation in a comfortable, economical and safe way while adequately protecting the subgrade and the layers of different materials that constitute the structure and interact together as part of the system. The pavements act as an interface between the traffic/climate and the underlying soil, and have a dual purpose: from top to bottom, distribute the load and, from below upwards, attenuate various geotechnical effects (Doré and Zubeck, 2009). The typical flexible pavement layered system consists of a surface layer of asphalt concrete (AC), a base layer of untreated aggregates, and a subbase layer generally conformed to the untreated local materials. This system of layers is supported on a moderately compacted natural soil (subgrade). The thicknesses required for each layer of the structure vary widely depending on variables such as the materials properties, number and configuration of the vehicle loads, environmental conditions, and the structure's expected service life (Doré and Zubeck, 2009; Huang, 2004).
Stresses acting on the pavement structures are related to vehicles' passage (traffic effect) and the environmental effects, mainly due to temperature variations (thermal effects). These two stresses are considered the most important over other types of stresses, such as degradation related to moisture or ageing of materials (Richard Kim, 2009). In the pavement system, the embankment defines performance through the level of confinement. Structural layers with low confinement are likely to expect significant deformations under load applications (Doré and Zubeck, 2009).
The pavements are designed to support vehicle traffic, traditionally referred to as an 80 kN axle (AASHTO, 1993). The transport of SHL elements on the pavements can generate conditions, depending on the pavement geometry and material properties, that exceed the design hypothesis. In addition to the aforementioned, the pavement performance under these atypical loading conditions must be evaluated to avoid damage to the structure, both immediately and over the long term. SHL vehicles not only transmit a higher level of loads to the pavement but also generate stress states different from the traditional ones due to the use of a higher number of axles and wheels, as shown in Figure 1-1
10
Figure 1-1. Typical SHL vehicle: (a) SHL vehicle transporting load, (b) vehicle side view, (c) axles and wheels arrangement.
Pavement design and analysis has traditionally been done using empirical or semi-empirical methods. The AASHTO-93 method (AASHTO, 1993) is the most widespread and used. However, as this is a predominantly empirical method, consideration of new materials or loading conditions requires calibrations, usually complicated and expensive. More recently, mechanistic-empirical (M-E) approaches are increasingly adopted for pavement analysis (Islam et al., 2019). In the M-E methods, structural response models are used to compute stresses, strains, and displacements due to traffic loading and climatic factors (temperature and moisture). These responses are then utilized in performance models (also called empirical transfer functions or damage laws) to calculate damage accumulation at any time for specific distresses, such as fatigue cracking or rutting (ARA Inc, 2004). The calculation of the accumulated damage considering the critical factors in different conditions (i.e. climatic seasons) is estimated following Miner's hypothesis, where the total damage results from the sum of the ratio between the number of load repetitions applied and the permissible number of repetitions in each condition under study (AASHTO, 2020).
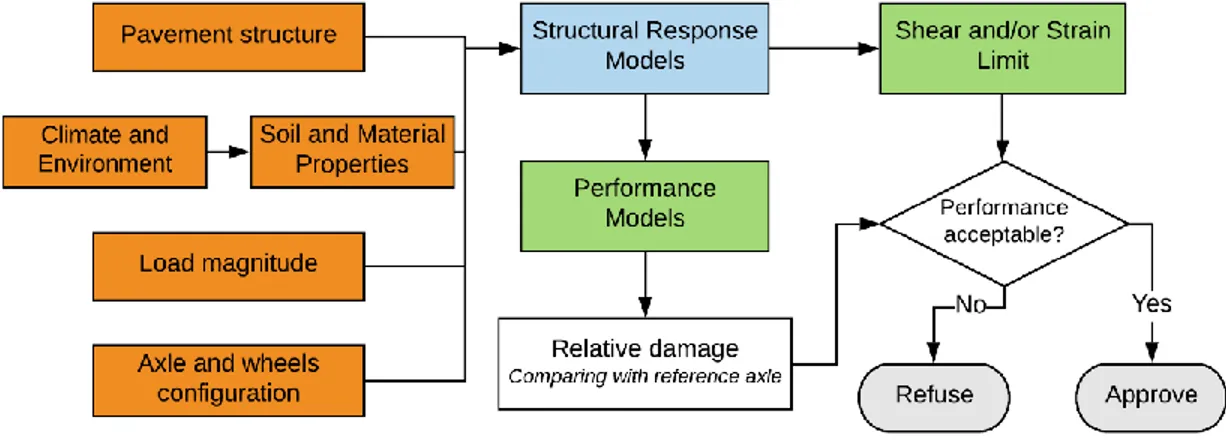
In a simplified manner, the SHL analysis using an M-E approach can be summarized, as shown in Figure 1-2. The structural response model, which calculates the pavement's mechanical response, is one of the fundamental aspects of this analysis. The correct simulation of the expected field conditions, including the pavement structure and loading conditions, must be carefully analyzed. Similarly, interpreting the mechanical response results through performance models or shear criteria is the second part that must be addressed when analyzing SHLs. Subsequent sections will present the concepts of M-E analysis and their application to SHL vehicles. The
11
following sections will introduce the concepts of M-E analysis, and its application to SHL analysis, expanding on the elements presented in Figure 1-2.
Figure 1-2. A simplified summary of the process of analysis of SHLs in pavements
1.5. Pavement structural response models
Pavement response models are used to calculate the pavement's mechanical response, typically considering the solid mechanic principles. The multilayer elastic theory (MLET) is the most widely used pavement response model, defined under the following hypothesis (Huang, 2004):
a. Layers are homogeneous, isotropic and linearly elastic with a characteristic Young modulus (E), Poisson ratio (ν) and finite thickness (z), except for the lower layer having an infinite thickness; b. It is assumed that the material is weightless and infinite in surface extension;
c. The load is applied to a circular area with uniform contact pressure; and
d. Continuity conditions are satisfied at each layer's interfaces, with the same vertical tension, shear stress, vertical displacement, and radial displacement.
The MLET is an axisymmetric single wheel analysis that can be extended to multiple wheel loads using the principle of overlapping or combined influence of several loads. Computer programs for pavement analysis based on MLET, such as BISAR, CHEVRON, and ELSA are popular in practice. Several organizations have
12
also developed software's based on MLET, including the ability to analyze complex axle configurations or particular climatic conditions, such as AASHTOWare (ARA Inc, 2019), WESLEA (Auburn University, 2006), 3D-Move Analysis (University of Nevada, 2010), Chaussee2 (St-Laurent, 2006) and i3C-ME (Université Laval, 2019).
On the other hand, the finite element method (FEM) is also frequently used. It is an advanced response model for problems that require determining the spatial distribution of one or more dependent variables that are mathematically described by differential equations or by an integral expression (Cook et al., 2002). FEM has advantages over other numerical methods (i.e. MLET); the most relevant are listed below:
a. It applies to any field problem: stress analysis, heat transfer, etc. b. There is not a geometric restriction
c. Boundary conditions and loading are not restricted
d. Materials properties are not restricted to isotropy and may change from one element to another e. The finite element structure closely resembles the actual body or region to be analyzed f. The approximation is easily improved by grading the mesh (more resolution)
Some FEM software adapted to pavement analysis, such as Illi-Pave (Raad and Figuroa, 1980) and Mich-Pave (Harichandran et al., 1989), which are axisymmetrical programs with the disadvantage of not allowing for simulations of more than one load. There are also specific codes for pavements, such as Diana (Correia, 1996) and Cesar (LCPC, 1996). In addition to this, there are some other very advanced generic programs, such as SV-Office (Bentley, 2018), Abaqus (Simulia, 2016), Plaxis (Plaxis, 2001), and Ansys (Ansys Multiphisics, 2009), which allow a great variety of fundamental laws and types of analysis, thus offering full flexibility to elaborate the model. Despite the complexity of their use, the tridimensional FEM models are considered the most accurate and suitable models for any detailed study.
Recently, some attempts have been made to apply the discrete element method (DEM) for pavement materials simulation. DEM seeks to numerically calculate the motion and effect of large numbers of particles interacting on a small scale (less than 10-4m). It is widely accepted as an effective method of addressing engineering
problems in granular and discontinuous materials, especially in granular flows, dust mechanics, and rock mechanics (Matuttis and Chen, 2014). Recent developments give new and relatively simple tools to simulate
13
continuous materials and to move from microscopic interactions to classical macroscopic properties, such as stress and strain, thermal conductivity, cracks, and damage (Jebani et al., 2015).
DEM has the limitation of being computationally demanding, constraining either the length of a simulation or the number of particles considered. Also, it handles material properties different from those generally used in engineering practice, which restricts its applicability in the field. For these reasons, DEM will not be discussed further in this review since it is not aligned with the paper's objective. However, it is recognized that the DEM will develop proportionally to the increase of the computational power and the capacity to associate discrete material properties with the properties of continuous materials normally used in the engineering field, making it likely that in the near future, it will be a practical alternative as a structural model for pavements.
In the pavement structural response models, the materials properties and loading conditions are predominantly essential variables to define for SHLs analysis. Considerations used regularly in the study of the effect of SHL, as well as some elements of the literature that could improve current practices, will be presented
1.5.1. Soil and materials properties
1.5.1.1. Characterization of granular materials and soils
Materials properties are defined by the material rheology considered. Linear elasticity is the oldest and most often used way to model pavement materials behaviour. It assumes that the stress state at any point of the structure is uniquely related to the strain state through his Youngs modulus and assumes that the material returns to its initial state once the load is removed (fully-recovered).
In pavement engineering, the linear elastic response of granular materials and soils is defined by the resilient modulus (𝑀𝑟), which is a particular parameter describing the elastic component of the stress-strain behaviour of materials under cyclic loading, as follows:
[1-1] 𝑀
𝑟 = 𝑞 𝜀𝑟
Where, 𝑀𝑟 is the resilient modulus, 𝑞 the deviatoric stress and 𝜀𝑟 the recoverable strain, as indicated in Figure 1-3. Proportionally, the permanent strain (𝜀𝑝) will be greater than the resilient one (𝜀𝑟) in the first cycles of load, when increasing the number of loads applied in the material, the deformations will reach an elastic equilibrium (𝜀 ≈ 𝜀𝑟), range in which the 𝑀𝑟 is calculated.
14 Figure 1-3. Strains under cyclic loading, based on Huang (2004)
As indicated previously, linear elasticity is widely used in pavement analysis. The hypothesis that the loads acting on the pavement structure will only cause elastic strains, which simplifies practical purposes. Linear elasticity has also been used for several SHL analysis, this under the assumption that the linear elastic behaviour is well understood and that its prediction has an acceptable precision (Jooste and Fernando, 1995; Sekhon, 2002; Chen et al., 2013; Khanal et al., 2016).
Granular materials exhibit a non-linear behaviour within the elastic range. Given this, non-linear constitutive models for the 𝑀𝑟 has been proposed. The general constitutive model recommended in current practice is the Uzan model (ARA Inc, 2019; Doré and Zubeck, 2009):
[1-2] 𝑀𝑟 = 𝑘1𝑝𝑎( 𝐼1 𝑝𝑎 ) 𝑘2 (𝜏𝑜𝑐𝑡 𝑝𝑎 + 1) 𝑘3 With, [1-3] 𝐼1= 𝜎1+ 𝜎2+ 𝜎3 [1-4] 𝜏𝑜𝑐𝑡 = 1 3√(𝜎1− 𝜎2)2+ (𝜎1− 𝜎3)2+ (𝜎2− 𝜎3)2
Where, 𝑀𝑟 is the resilient modulus, 𝐼1 the bulk stress, 𝜏𝑜𝑐𝑡 the octahedral shear stress, 𝑝𝑎 the reference pressure (100 kPa), 𝑘1 , 𝑘2 and 𝑘3 are experimentally determined constants specific to materials and conditions.
15
The model presented in equation [1-2] describes the relationship between the resilient modulus and the stress state acting in the material. This consideration is essential, given that the materials' stress conditions can change drastically with the depth and geometry of the pavement. This stress-dependent condition highlights the importance of using non-linear models, such as equation [1-2], in the analysis of SHL, as the stress conditions described by the load can make the mechanical response of the pavement complex to analyze using a constant 𝑀𝑟 per material.
Although linear-elastic models are used to calculate the pavement's mechanical response, it should be complemented to offer a full spectrum of the pavement's behaviour to SHL vehicles. Elastic-plastic models are usually used to study the behaviour of granular materials and soils to SHLs, being referenced mainly to ensure the validity of the hypotheses adopted by the linear-elastic models.
In elastic-plastic models, it is assumed that the material will behave as linear-elastic. However, when the material is loaded beyond a certain level of stress, defined as a stress threshold, irrecoverable deformation will take place. Thus, beyond this point of loading, not all strains are elastic. For an elastoplastic material, the total strain increment develops during the loading is assumed to be the sum of the elastic and plastic strain:
[1-5] 𝑑𝜀𝑖𝑗 = 𝑑𝜀𝑖𝑗𝑒 + 𝑑𝜀𝑖𝑗
𝑝
Where, 𝑑𝜀𝑖𝑗𝑒 is the elastic portion of the strain increment, and 𝑑𝜀 𝑖𝑗
𝑝 is the plastic part of the total strain increment (𝑑𝜀𝑖𝑗). To separate the zone where purely elastic behaviour occurs from the zone where the elastoplastic, or perfectly plastic, behaviour takes place, yield criteria are used. A yield criterion allows deciding whether or not the material will yield under a stress state, being this a mathematical expression of the stress states that will cause yielding or plastic flow (Hosford, 2010). A yield surface is defined by:
[1-6] 𝜙(𝜎, 𝜁) = 0
Where 𝜎 are stresses and 𝜁 are the plastic internal variables at the current material state (Anandarajah, 2010). Considering equation [1-6] as the failure surface, results below 0 indicate that the stress state remains within the limit defined by the surface (elastic behaviour), and results equal to or greater than 0 will indicate plastic elastoplastic behaviour, depending on the criteria used.
FEM can consider elastoplastic materials implicitly in the pavement response model, this being the most appropriate way to describe the behaviour of granular materials and soils. However, for SHL-analysis, the common practice is to analyze the plastic behaviour of the material, represented by the plastic strain or
16
permanent deformation (PD), independently of the response model, correlating variables such as the stress state or elastic strain with a plastic component (ARA Inc, 2004; Doré and Zubeck, 2009).
In granular materials and soils, plastic strains are used as a fundamental performance criterion, so their interpretation serves two purposes: (1) the definition of a load limit and (2) the PD's prediction in the pavement. The definition of a load limit based on the plastic characteristics of the material will be presented below. At the same time, the prediction of PD in the pavement will be discussed in later sections.
To set the load limit for SHLs, the Mohr-Coulomb yield criterion has been widely used (Jooste and Fernando, 1995; Chen et al., 2013; Papagiannakis et al., 2015; Hajj et al., 2018). This criterion describes an elastic - perfectly plastic material, implying that while the material remains within the failure surface (𝜙(𝜎, 𝜁) < 0), it will behave elastically, but when conditions reach beyond the failure surface, its behaviour will be completely plastic, with a plastic deformation tending to infinity. In a three-dimensional stress space, this criterion is given by the following equation (Jooste and Fernando, 1994):
[1-7] 1 3𝐼1sin 𝜙 + √𝐽2sin (θ + 𝜋 3) + √𝐽2 √3cos (θ + 𝜋 3) sin 𝜙 − 𝑐 ∙ cos 𝜙 = 0 With, [1-8] 𝐽2= 3 2(𝜏𝑜𝑐𝑡) 2
Where, 𝐼1 is the bulk stress, 𝐽2 is the second invariant of the deviatoric stress tensor, 𝑐 is the cohesion and 𝜙 the friction angle of the material. The angle of similarity,Θ, is given by the following expression:
[1-9]
cos 3θ = √2𝐽3 (𝜏𝑜𝑐𝑡)3 With,
[1-10] 𝐽3= (𝜎1− 𝜎𝑚)(𝜎2− 𝜎𝑚)(𝜎3− 𝜎𝑚)
Where 𝐽3 is the third invariant of deviatoric stress tensor, 𝜏𝑜𝑐𝑡 the octahedral shear stress, and 𝜎𝑚 the is the average of the principal stresses.
A common practice in SHL analysis is to perform an analysis with an elastic response model, such as MLET, and then use yield criteria, such as equation [1-7], to verify the resulting behaviour (elastic or plastic) of the material (Jooste and Fernando, 1994; Papagiannakis et al., 2015; Khanal et al., 2016). Considering that if the
17
material reaches a plastic behaviour (𝜙(𝜎, 𝜁) ≥ 0), the pavement will reach an abrupt collapse, and therefore, the passage of the SHL vehicle cannot be authorized. This approach is widely used as a criterion for maximum allowable load, studying the creep criterion at the top of the subgrade, considered to be the weakest element of the pavement assembly (Jooste and Fernando, 1994; Papagiannakis et al., 2015; Hajj et al., 2018)
A significant advantage of yield criteria, such as Mohr-Coulomb, is their relative simplicity. Engineers are familiar with the cohesion and friction angle of materials and the tests required to determine these two parameters. However, among its disadvantages is the consideration of elastic-perfectly plastic material, assuming that the structure will reach collapse upon reaching a stress state where plastic deformations develop. The above omits that under cyclic load conditions, such as those defined by the passage of a vehicle, permanent deformation will likely not generate an abrupt failure but will develop gradually with each load cycle or the passing of the vehicle's axle.
Chen et al. (2013) analyzed the response of the Mohr-Coulomb yield criterion under typical stress states generated by SHLs, concluding that for the stress levels typically induced in pavements, failure occurs due to excessive shear in the low-stress range, where cohesion is a critical component of the overall shear strength. This indicates that, for pavements, the likelihood of failure due to excessive volumetric stresses is minimal. SHL vehicles travel at a slower speed than regular traffic, adding to this the high magnitudes of the load may indicate that it is necessary to analyze the results as a function of the time of application of the loads, described by the viscous component of the materials. Subgrade soils also exhibit viscoelastic behaviours, most notably in cohesive soils. Coulombe (2002) developed an empirical model to correct vehicle speed's effects in a mechanistic-empirical method. The correction factors were applied directly to the deformations calculated at the base of the pavement and the top of the soil infrastructure before its use in empirical transfer functions. On the other hand, Quijano (2010) used field and laboratory data to determine the Burger model's parameters, identifying the sensitivity of fine soils to loading time in their behaviour. These investigations showed that considering the subgrade as viscoelastic, in cases where speed is a relevant parameter, it was beneficial for the analysis's accuracy. However, suitable parameters for the viscoelastic models must be determined for this purpose.
1.5.1.2. Characterization of asphalt concrete layer
Asphalt concrete is considered a viscoelastic material (Di Benedetto and Corté, 2005), and therefore, the modulus depends on temperature and loading frequency. The complex modulus (𝐸∗) is one of the most
18
commonly used properties of asphalt mixtures for conducting pavement analysis considering linear viscoelastic behaviour. The complex modulus is defined as a complex number that links stress to strain for a linear viscoelastic material subjected to a sinusoidal loading (Carter and Perraton, 2002). The norm of the complex modulus is commonly referred to as the "dynamic" modulus |𝐸∗| (Yoder and Witzak, 1975). In a viscoelastic material, the phase angle 𝜑 characterizes the time lag between stress and strain. The |𝐸∗| approximates the elastic modulus of a viscoelastic material, which can be used for pavement analysis using the laws of elasticity (i.e. MLET)
The temperature and loading-rate effects of asphalt mixtures are characterized by the |𝐸∗| master curve (ARA Inc, 2004). This consists of a model describing a single sigmoidal shaped curve of the |𝐸∗| value for a reference temperature with respect to the loading-frequency axis. To define this curve, a graph of |𝐸∗| versus frequency is plotted for all test temperatures. Next, the |𝐸∗| data at all temperatures other than the reference temperature are shifted horizontally concerning the frequency axis. The material's temperature dependency is indicated by the amount of shifting (shift factor) needed at each temperature, and the master curve itself shows the loading-rate dependency.
The dynamic modulus master curve can be represented by the sigmoidal function described in the following equation (ARA Inc, 2004):
[1-11] log|𝐸∗| = 𝛿 + 𝛼
1 + 𝑒𝛽+𝛾(log 𝑡𝑟)
Where|𝐸∗| is the dynamic modulus, 𝑡
𝑟 is the time of loading at the reference temperature, 𝛿 and 𝛼 are fitting parameters for a given set of data, and 𝛽 and 𝛾 are parameters describing the shape of the sigmoidal function. The equation [1.12] provides the general form of the shift factors.
[1-12]
𝑡𝑟 = 𝑡 𝑎(𝑇)
Where, 𝑡𝑟 is the time loading at a given temperature of interest, 𝑎(𝑇) is the shift factor as a function of temperature, and 𝑇 is the temperature of interest.
Analogous to the previous one, the Huet-Sayegh constitutive law has been successfully used to characterize asphalt concrete's viscoelasticity. This constitutive law has the following form (Xu and Solaimanian, 2009):
[1-13]
𝐸∗= 𝐸0+
𝐸∞− 𝐸0
19 With,
[1-14] log 𝜍 = 𝑎 + 𝑏 ∙ 𝑇 + 𝑐 ∙ 𝑇2
Where, 𝐸0 is the long-term elastic modulus, 𝐸∞ is the instant elastic modulus, 𝜍 represents the retardation time regarding the effect of the temperature, 𝜔 is the angular frequency (𝜔 = 2𝜋𝑓), 𝑖 is an imaginary unit (𝑖2= −1), and 𝛿, 𝑟, ℎ are constants of the model, with 0 < 𝑟 < ℎ < 1.
Different studies have reported the use of different material models, predominantly in the theory of elasticity for granular and unbound materials (Jooste and Fernando, 1995; Sekhon, 2002; Khanal et al., 2016; Hajj et al., 2018), while elasticity to non-linearity has been explored for the asphalt concrete layer (Khanal et al., 2016; Hajj et al., 2018).
Given that SHL vehicles travel slower than regular traffic, a response associated with the material viscosity is a relevant parameter to be included in the analysis. However, viscoelastic models have not been used to analyzed SHLs; only the master curve of the asphalt mixtures has been previously used to estimate the modulus at a reference speed and temperature (Khanal et al., 2016, 2019). The use of viscoelastic pavement modelling software, such as Viscoroute (Chabot et al., 2009), can offer a viable means for the more detailed study of the viscoelastic behaviour under the action of SHLs.
1.5.2. Load magnitude and axle configuration
The two main characteristics that differentiate SHL vehicles from typical heavy traffic are the unconventional load magnitude and multiple axles and wheels to distribute this load. In routine pavement design, a standard 80 kN axle with dual wheels usually is modelled, with only one side of the axle being included in the modelling process. It is recognized that computed pavement responses are generally sensitive to wheel locations and the interaction between the various wheels on a given axle (ARA Inc, 2004); however, this condition is omitted in pavements designing, considering at this point that the interaction between axles is negligible.
Although special axle configurations, as defined by SHL vehicles, have been studied in a limited way, the effect of overloads has been explored extensively. Overloading refers to a violation of the legal axle load limits for typical vehicles that regularly use the road network. The damage caused by overloaded vehicles is higher than that induced by vehicles loaded within legal load limits or standard axle load limits. Overloading is recognized as one of the most important causes of the deterioration of flexible pavements (Assogba et al., 2019).