Open Archive TOULOUSE Archive Ouverte (OATAO)
OATAO is an open access repository that collects the work of Toulouse researchers and
makes it freely available over the web where possible.
This is an author-deposited version published in :
http://oatao.univ-toulouse.fr/
Eprints ID : 14342
To link to this article : DOI : 10.1016/j.polymer.2015.09.062
URL :
http://dx.doi.org/10.1016/j.polymer.2015.09.062
To cite this version : Audoit, Jérémie and Laffont-Dantras, Lydia and
Lonjon, Antoine and Dantras, Eric and Lacabanne, Colette
Percolative
silver nanoplates/PVDF nanocomposites: Bulk and surface electrical
conduction
. (2015) Polymer, vol. 78. pp. 104-110. ISSN 0032-3861
Any correspondance concerning this service should be sent to the repository
administrator:
[email protected]
Percolative silver nanoplates/PVDF nanocomposites: Bulk and surface
electrical conduction
J!
er!
emie Audoit
a, Lydia Laffont
b, Antoine Lonjon
a,*, Eric Dantras
a, Colette Lacabanne
aaPhysique des Polym"eres, Institut Carnot CIRIMAT, Universit!e Toulouse III e Paul Sabatier, Toulouse, 31062, France bCIRIMAT/Institut Carnot, ENSIACET, 118 route de Narbonne, 31077 Toulouse cedex 4, France
Keywords:
Silver microplates Polymer matrix
Conductive nanocomposites Electrical bulk percolation Electrical surface percolation 2D/3D percolation
a b s t r a c t
Electrically conductive polymer composites have been elaborated by dispersing silver microplates into a polyvinylidene fluoride (PVDF) matrix. Silver microplates have been successfully synthesized. Their mean lateral length is about 1.15mm, presenting a moderate aspect ratio (12e25). Synthesis is easily controlled and can produce 1e500 mg depending on the volume and the concentration of the solutions used. Electrical bulk and surface conductivity of the composites containing different filler fractions (4e20 vol.%) have been determined for each sample. Electrical percolation has been observed for each situation and was determined at 5.9 vol.% for bulk conductivity (through the thickness), while the value is shifted to 6.9 vol.% when surface conductivity is considered. The gap between the two values of percolation threshold is attributed to the orientation of fillers. Bulk conductivity and surface resistivity reaches 12.9 S m!1and 0.123U/☐ respectively at filler fraction of 15 vol.%.
1. Introduction
The improvement of electrical conductivity of polymer-based composites is one of the actual challenges. Extensive work has been done on the introduction of conductive fillers into insulating polymer matrices. Firstly, carbon fillers such as carbon black[1], carbon nanotubes[2]and, graphene[3e5]have been widely used. The carbon fillers present good electrical conductivity (∿104S m!1) but once they are dispersed into a homogeneous matrix, electrical conductivity of the composites is generally limited to 10!2e10!1 S m!1 [6]. To obtain highly conductive composites, metallic fillers such as silver[7,8], gold[9], nickel[10]or copper
[8,11]have been introduced into various polymer matrices. Metallic nanowires with high aspect ratio enable the conductivity to reach 101e102S m!1with a low percolation threshold[7,10]and a little impact on the initial mechanical properties of the composites.
Surface conductivity enhancement has been extensively studied particularly for transparent electrodes applications[12e16]. The use of high aspect ratio conductive fillers such as carbon nanotubes and silver nanowires made the increase of surface conductivity of multi-layer composites possible. Both graphene and silver flakes
(i.e. silver sheets with no regular morphology) were used as 2D conductive fillers. Graphene nanocomposites[17]have an electrical conductivity from 10!2
e101 S m!1 while multilayer composites could reach 104 S m!1[4,18]. Nanocomposites containing silver flakes could reach 103e105 S.m!1at high loading values (up to 20 vol.%)[19]. Metallic nanoparticles, especially silver nanoplates (i.e. well-defined morphology) have multi-potential applications such as plasmon resonance[20e22], optics[23], biological sensing[24], and antibacterial activity[25,26]. To our knowledge, regular hex-agonal and triangular silver nanoplates have not yet been used as conductive fillers.
Silver nanoplates were first obtained by Mirkin et al.[27]. Since this starting point, two major processing ways have been explored: seed-mediated process (or multiple steps)[28e32]and one-step process[33e35]. Each includes several methods such as photoin-duction conversion[36,37], solvothermal reduction[38]etc. Seed-mediated process requires the production of a reaction interme-diate which is used in a subsequent step. On the contrary, a one-step process implies that the synthesis directly generates the sil-ver nanoplates, where an in-situ generation of silsil-ver seeds may occurs. The improvement of the quality of the products for each method was possible by a better understanding on the involved mechanisms[39e41]. To produce high aspect ratio silver nano-plates, a seed-mediated process is more suitable than the one-step
* Corresponding author.
E-mail address:[email protected](A. Lonjon).
process. Many reasons led us to choose seed-mediated process. The reduction rate of new Agþions, which influences the morphology
and the size distribution, is better controlled by seed-mediated process. It is also the most adapted process to produce large quantities of silver nano/microplates. The efficiency of seed-mediated growth method has already been demonstrated to pro-duce microplates from nanoplate by iteration growth[29,30,42]. Two important parameters are the injection of specific amount of seeds[23,31,43]and the time reaction[44]. It is well known that carboxyl capping agents, especially citrate ions, promote the growth of lateral dimensions [30,31,40] during all steps of the elaboration. Citrate ions binds preferentially to {111} surface of Ag crystal which drastically slows the reduction of Agþions on the {111} surface, promoting reduction of Agþions on the {100} surface
[39]. The addition of hydrogen peroxide (H2O2) at early stages is
known to act as an etching agent by re-dissolving non-capped sil-ver seeds. It improves the yield efficiency of nanoplates. This allows us to achieve a high number of silver plates[28]. It is important to mention that Liu et al.[35]have recently reported an efficient one-step method to obtain a tunable length of silver nanoplates or microplates at large scales.
In this paper, we present the elaboration of nanocomposites with a moderate filler content. A comparative study of both bulk and surface conductivity has been done. Seed-mediated growth method was adopted to produce the required quantity of micro-plates to be used as a conductive filler in a polymer matrix. 2. Experimental section
2.1. Materials and chemicals
Silver nitrate (AgNO3, 99.9999%), sodium borohydride (NaBH4,
99%), sodium citrate tribasic (TSC, >98%), hydrogen peroxide (H2O2,
30 wt.%),L-ascorbic acid, sodium hydroxide (NaOH, #98%) were purchased from Sigma Aldrich. All chemicals or products were used as received. Polyvinylidene difluoride powder (PVDF, Kynar 500) was purchased from Arkema, colloidal silver paint was purchased from Electron Microscopy Sciences.
2.2. Elaboration of silver microplates
Micrometre sized silver nanoplates were obtained by a seed-mediated protocol which involves three phases. The first phase consists of the synthesis of silver spherical seeds. A definite amount of the prepared spherical seeds is used in the second phase devoted to the conversion into nanoplates. In this article, we identify the second phase as “the morphological selection phase” because the plate-like structure is formed during this phase. As a matter of fact, a large number of morphologies are available from silver seeds (cubes, tetrahedrons, plates, wires…) depending on capping agent and experimental conditions[39,45]. Finally, the silver nanoplates prepared during the second phase were used as new seeds during the growth phase. The lateral dimension of each nanoplate grows continuously until it reaches the desired value of 1
m
m. The syn-thesis schema is represented inFig. 1. All the solutions were pre-pared with distilled water.2.2.1. Spherical seeds synthesis
The synthesis of spherical silver seeds was inspired by a modi-fied protocol originally established by Li et al.[28]. The solution volume was fixed at 25.00 mL. A solution of sodium citrate (24.00 mL, 0.2 mM) was mixed with 0.06 mL of silver nitrate (25 mM), 0.06 mL of an iced solution of H2O2(2.418 M) and 0.08 mL
of water (to complete 24.20 mL). A freshly made aqueous solution of NaBH4(0.80 mL, 50 mM) was added drop by drop under vigorous
stirring. The colour becomes immediately pale yellow revealing the formation of silver nanoparticles. Stirring was stopped after 3 min. Small bubbles appeared after several minutes and became bigger, indicating the decomposition of silver by hydrogen peroxide (re-action 1). H2O2plays two roles during silver nanoparticles
elabo-ration: 1) it re-dissolves non-capped silver seeds; 2) it can act as a weak reducing agent on capped silver seeds. In some cases the solution becomes brownish after 1e12 h of the addition of NaBH4,
indicating that silver nanoparticles formed aggregates[40].
H2O2þ 2Agþ/2Hþþ O2ðgÞþ 2Ag (1)
2.2.2. Morphological formation phase: conversion of spherical seeds in nanoplates
During this phase, silver seeds are converted to nanoplates. Typically, 2.0 mL of the previously prepared spherical silver seed solution was added to 8.0 mL of water. Then, 0.5 mL of TSC (75 mM) and 1.0 mL of ascorbic acid (AA, 100 mM) was added to the solution under moderate stirring. After homogenization, 0.3 mL of AgNO3
(10 mM) was added at a rate of 3.0 mL h!1with a syringe pump. The colour of the solution changes from pale yellow to orange, red, purple and finally blue when the entire volume of AgNO3 has been added. The prepared solution is designated as AgNpt0.
2.2.3. Growth from nanoplates to microplates
The growth phase was inspired by Zeng et al.[30]. The AgNpt0 solution is used as a nanoplates-seed solution during the growth phase. The growth phase involves three very similar steps. Each step increases the lateral dimension of the nanoplates; new silver ions are reduced specifically on the {100} surfaces. Their growth is continuous and is controlled by the number of growth iterations and the quantity of Ag þ added. Typically, 1.0 mL of AgNpt0solution
was dispersed in water to obtain a 10 mL solution. Then, 10 mL of a solution containing AA (8.0 mM) and TSC (2.67 mM) (noted AA/TSC (8.0/2.67 mM)) was added under moderate stirring. Then 10 mL of AgNO3(4.0 mM) was injected with a syringe pump at the rate of
5.5 mL h!1. The obtained solution is designated as AgNpt1. One
third of the AgNpt1 solution was taken out and used as new seeds for the next growth step (without any purification or treatment). The second growth step was conducted in the same way as the first one: 10 mL of the AgNpt1solution was added to 10 mL of AA/TSC
(8.0/2.67 mM) in a new beaker. Then 10 mL of AgNO3(4.0 mM) was
injected at the rate of 6.7 mL h!1. The third step was achieved by the
same method as described previously. The injection rate is fixed at 10 mL h!1. At the end of the growth phase, 3.0 mL of NaOH (500 mM) was added to balance the excess of AA and to equilibrate the pH at 7. To remove the excess of TSC and other products of the reaction, the microplates were washed. The solution was stored during 1e2 days, giving time to Ag particles to settle at the bottom of the flask. A volume of 25 mL of the upper solution was removed and replaced by 25 mL of clean distilled water. This washing
Fig. 1. Schematic illustration of the three phases involved in the synthesis of silver microplates and reactants used for each phase: ascorbic acid (AA), trisodium citrate (TSC), hydrogen peroxide (H2O2).
process was repeated 3 times. Silver microplates were stored in distilled water and are stable for months.
A scaled-up synthesis was successfully performed where all volumes used are multiplied by 10. Concentrations of all solutions were kept the same as described. The rate of the injection steps were 55, 67 and 100 mL.h!1for the first, second and third steps
respectively. The washing process was the same as described pre-viously. This large batch produces approximately 0.5 g of silver microplates.
2.3. Preparation of nanocomposites
A known amount of silver microplates was dispersed in acetone. The corresponding quantity of PVDF was added to the dispersed solution and then heated at 65&C under sonication to facilitate the
dissolution of the PVDF. When the dispersion was homogeneous, it was transferred into a large volume of water to precipitate the PVDF. This technique ensures that the fillers are immobilized in a random orientation. The formed nanocomposite was first dried in an oven at 100&C for 2 h, then hot-pressed at 200 &C with an
applied pressure of ~15 MPa. The obtained thin film was cut and hot-pressed again for four times. The range of filler fraction is be-tween 4 and 20 vol.%. Sample thickness varies from 39 to 78
m
m.2.4. UVevisible spectroscopy
At morphological selection phase, twelve aliquots were peri-odically withdrawn from the solution during AgNO3 injection. The total volume of the added AgNO3 solution is 0.5 mL. UVevisible absorbance spectra were performed at room temperature using a PerkineElmer Lambda 19, with incident radiation ranging from 300 nm to 1350 nm. A 3 mL capacity quartz cuvette was used.
2.5. Electron microscopy
The structure and texture of Ag microplates were determined by high-resolution transmission electron microscopy (HRTEM). A drop of the Ag suspension was deposited on a copper grid coated with Lacey carbon films to obtain transparent samples for electron irradiation. TEM and HRTEM images were obtained by using a JEOL 2100F. The diffraction patterns were obtained using the selected area electron diffraction (SAED) mode.
Morphology of silver microplates, size distribution and cryo-fractured nanocomposites were observed using a Jeol 6700 FEG scanning electron microscope (SEM) equipped with a field emission gun by using a backscattered electrons detector. Acceleration voltage was 8 kV.
2.6. Electrical conductivity
All measurements were performed at room temperature. Elec-trical conductivity of nanocomposites was measured by a four-point probe configuration using a Keithley 2000 multimeter for high conductivity level nanocomposites. Lower electrical conduc-tivity values were measured by dynamic dielectric spectroscopy (DDS) on a Novocontrol broadband spectrometer. The real part
s
0(u
) of the complex conductivitys
*(u
) at low frequency (10!2Hz)was assimilated to DC conductivity of the nanocomposites. For practical reasons surface conductivity
s
s will be used in this article: It is considered as the reciprocal of the surface resistivityr
s (equivalent value of surface resistivityr
s will be given for each experimental value). Surface resistivity was determined using the following equation, after deposition of two electrodes of silver paint on the surface of the nanocomposites[46]:ss¼ 1 rs¼ 1 R ) d w
Were R is the measured resistance of the sample, w the width of the electrodes, d the separating distance of the two electrodes. 3. Results and discussion
3.1. Characterization of silver nanoplates
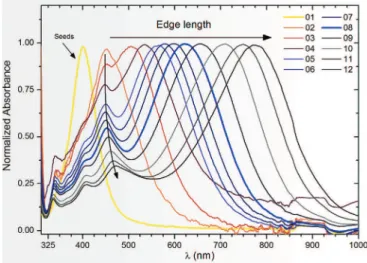
Colloidal silver particles and nanoplates (cf 2.2.b) are subject to plasmon resonance; the bright colouration of the solution varies from pale yellow to deep blue according to the morphology and size. Seed-mediated prepared silver nanoplates were characterized by UVevisible spectrometry. Normalized absorbance is shown on
Fig. 2as a function of incident wavelength
l
. Sample 1 (curve 1) only contains silver spherical seeds. Spherical silver nanoparticles dispersed in water produce a yellow coloured solution. The observed unique plasmon band located at 400.8 nm is in agreement with literature[27,32,47e49]. When AgNO3is injected in presenceof AA, TSC and H2O2, the growth of particles is oriented according to
lateral length rather than vertical thickness. Xia group[30,31]and Yin group[28,29]have demonstrated the efficiency of sodium cit-rate or other carboxyl compounds[40]to produce nanoplates from spherical seeds. Carboxyl compounds develop a better affinity with (111) Ag crystal surface. This promotes growth by reduction of Agþ
atoms on the (100) Ag crystal surface[29,39]. The aspect ratio of the particles increases with silver salt injection because the thickness increase is negligible when compared to the lateral length increase. OnFig. 2, the plasmon band associated with the particle dimension is redshifted, from values of 400 nme733 nm (curve 1 to curve 12 respectively). This plasmon band is attributed to the in-plane dipole of resonance, which depends on the edge length of nanoplates[21]. The increase of lateral length is monitored by the magnitude of the in-plane dipole plasmon band redshift. On curves 3 to 12, two supplementary plasmon bands can be indexed: they are located at 335e340 nm and 450e470 nm. They are attributed to the out-of-plane quadrupole and the in-out-of-plane quadrupole respectively, proving the existence of plate-like morphology[21,37,48]. The out-of-plane quadrupole does not present significant changes. It is thought that the slight redshift of the in-plane quadrupole band
Fig. 2. Normalized UVeVis absorbance spectra taken from morphological selection phase. Each curve corresponds to an injected volume of Agþranging between 0 (seed
solution, curve 1) and 0.5 mL (curve 12). The in-plane dipole plasmon band is redshifted with the increase of addition of silver salt.
from 448 nm to 472 nm (respectively curve 3 and 12) is due to a small increase of the thickness of the nanoplates during the process.
The evolution of the intensity of plasmon band attributed to the (non-converted) spherical silver particles (400 nm) has been monitored. Qualitatively, the relative intensity of the 400 nm plasmon decreases (from curves 2 to 8) attesting the conversion from nanospheres to nanoplates. More precisely, a shoulder band is observed at 400 nm attesting that the relative quantity of silver spherical particles is decreasing (curves 2 to 8). They cannot totally be eliminated during the morphological selection phase because of experimental conditions, but the majority of the products present a plate-like morphology, attested by the large redshifted in-dipole plasmon band. On curves 9 to 12, the 400 nm plasmon band is well-defined again, which indicates the presence of newly-generated spherical silver particles in response to an excess of sil-ver salt. It is believed that when the quantity of injected AgNO3 becomes too high, the reduction on existing plates requires more energy. In this case, the formation of new spherical particles is favoured and the plate growth is limited. It is better to stop reaction before the quantity of nanospheres reach such a high value. Curve 8 (Fig. 2, bold curve) presents a maximum absorbance at 621.2 nm, which is attributed to the nanoplates lateral length around 40e60 nm[31,37]. It also presents the most interesting compro-mise between the lateral size and the relatively low quantity of new generated spherical particles.
3.2. SEM and TEM observations 3.2.1. Silver microplates
Silver microplates structure was observed by HRTEM. The bright field image (Fig. 3A) shows the triangular morphology of the Ag microplates combined with a very low thickness (the carbon membrane layer is visible through the plates). The SAED pattern is composed of punctual spots and the spacings are in good agree-ment with the spacings of the monoclinic AgO (space group P21/c e
a ¼ 5.8592 Å, b ¼ 3.4842 Å, c ¼ 5.4995 Å -
b
¼ 107.51&). The punctualdiffraction and the high resolution image (Fig. 3B) of some part of the plates are characteristic of a mono-crystallized sample.
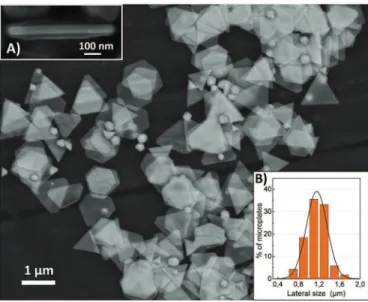
Silver microplates morphology was observed by SEM. Fig. 4
shows microplates obtained after three steps of growth. The ma-jority of the produced structures is composed of microplates of various morphologies: triangular, truncated triangular and hexag-onal. The mean lateral size has been determined from SEM images to be 1.15
m
m, with a standard deviation of 0.25m
m from one batchto another. (Fig. 4 inset B) shows a typical dispersion of lateral length (L). The size distribution is monodispersed and quite nar-row: 90% of the produced microplates have sizes ranging from 0.75 to 1.57
m
m. Statistics on size distribution show that 68% of the microplates have sizes ranging between 1.15 ± 0.20m
m demon-strating a narrow distribution of silver microplate size. Some microplates were observed vertically, enabling the measurement of their thickness (T): it ranges from 49 to 110 nm. The Aspect ratio x¼ L=Tmay be determined. In our case, the experimental aspect ratio of the as-produced silver plates is ranges from 12 to 25. Microplates present a moderate aspect ratio compared to low aspect ratio particles, such as, spheres (x
¼ 1) and high aspect ratio objects such as metallic wires (x
>200)[10]and carbon nanotubes (x
>1000)[50].A minor quantity of by-products with low aspect ratio has been observed. Their presence can be explained by self-nucleation occurring during all three phases of silver injection. It is admitted that a small amount of unconverted silver spherical seeds remains during the morphological selection phase. These seeds grow
Fig. 3. (A) TEM image of a silver microplate. Inset: SEAD of the corresponding microplate showing the microplates are monocrystalline, (B) HRTEM of a microplate surface. Fig. 4. SEM image of typical silver plates obtained after three growth steps. Micro-plates are very thin, it is possible to see through them. Inset (A) observation of the thickness of a single microplate; (B) size distribution of the microplates, bar plot shows statistical size dispersion extracted from SEM image analysis, the line is the corre-sponding fitted gauss curve.
simultaneously with regular plates during the process. Self-nucleation can be avoided by using a lower AgNO3 injection rate but this lengthens the reaction time[29]. This explains the slower injection rate on thefirst growth step (5.5 mL h!1). It is supposed that decahedrons and icosahedrons are formed because of a local excess of TSC on spherical silver seeds. Whether in a normal batch or a large quantity batch, the number of plates is about~76% of the
total produced silver material, rendering further purification of silver microplates unnecessary.
3.2.2. PVDF/Ag nanocomposites
SEM images show the lateral surface of a cryo-fractured PVDF/ Ag 4 vol.% nanocomposite (Fig. 5). The nanocomposite was frac-tured using liquid nitrogen. Bright domains correspond to the dispersed silver microplates. They are uniformly distributed throughout the matrix and the formation of aggregates is limited. SEM images indicate that the repeated hot-pressing process aligns the microplates perpendicularly to the applied force.
3.3. Electrical conductivity of nanocomposites 3.3.1. Bulk conductivity
Bulk conductivity was measured for each volume fraction of silver microplates and reported inFig. 6. Electrical conductivity of neat PVDF is 10!12S m!1. Nanocomposites with filler fraction below
6 vol.% present a very low conductivity level (Fig. 6) close to neat PVDF. When filler fraction is above 6 vol.% nanocomposites are electrically conductive with
s
¼ 0.1e22.9 S m!1. Electrical bulk conductivity has been increased by 13 decades after the percolation threshold. As shown on the cartoon (inset Fig. 6), the electrical behaviour of conductive nanocomposites is described by the following power law model proposed by Stauffer[51].s¼ s0ðp ! pcÞt
Where
s
0 is a constant, p the filler volume fraction, pc is the fillerfraction at percolation threshold and t is the critical exponent related to the dimensionality d of the system. For d ¼ 2, t varies from 1.1 to 1.3, and for d ¼ 3, t is about 1.6e2[7].
The experimental values obtained for the percolation threshold and the critical exponent are respectively pc ¼ 5.9 vol.% and t ¼ 1.58 ± 0.18.
This experimental t value is in adequacy with literature, Lonjon
et al.[10]obtained a similar value of critical exponent of t ¼ 1.57 by hot-pressing metallic wires in a copolymer matrix. Cortes Q. et al.
[7]obtained a higher value of t ¼ 2.06 using the same process. Other processing methods lead to a higher values: Carponcin et al.
[52] obtained t ¼ 2.48 by an extrusion process; Wu et al. [18]
reached t ¼ 3.77 by dispersion and hot-pressing; both of them using carbon nanotubes as conductive fillers. These upper values of t 3D-dimensional exponent could be explained by the presence of aggregates.
The dimensional exponent obtained in this work with micro-plates is on the lower limit for a three dimensional system. It is thought that hot-pressing forces a fraction of microplates to be oriented perpendicularly to the applied force. The value of the critical exponent t highlights the preferred orientation of micro-plates, but film thickness remains relatively higher than the di-mensions of microplates e thickness or lateral length e explaining a non-negligible 3D contribution on t exponent. The low value of t could be also explained by an aggregation phenomenon[53] of microplates, although SEM images only showed limited aggrega-tion. It is believed, rather, that the conductive pathway is formed by a non-negligible number of “dead arms” that represent branches that do not contribute to the percolative pathway through the sample volume. These dead arms are formed preferentially during hot-pressing and are the result of the orientation of microplates in the matrix[6].
A lot of work has been devoted to the analysis of the relationship between percolation threshold and aspect ratio. According to Bal-berg et al., the value of the percolation threshold varies as the reciprocal of
x
[54]. This analysis is valid whenx
is much higher than 50 which is not true for our microplates. A theoretical model based on excluded volume was proposed for hard platelets[55]; using those data, a non-monotonic variation of the percolation threshold versus the aspect ratio was predicted by Mathew et al.[56]. The percolation threshold pc is given by the following relation:pcf1 ! e!
1 x
According to this model, the corresponding percolation threshold pc for the prepared microplates (12 <
x
<25) should be comprised between 11.3 vol% and 6.4 vol% respectively.Fig. 5. Liquid nitrogen cryo-fractured surface of a PVDF/Ag nanocomposite containing 4 vol.% of Ag microplates. Bright domains correspond to silver microplates while darker continuous domain corresponds to the polymer matrix.
Fig. 6. Electrical bulk (left scale) conductivity of the nanocomposites as a function of filler fraction. (7) Low bulk conductivity nanocomposites, was measured by DDS and (
▵
) bulk conductivity of nanocomposite measured with the four-probe technique, (∎) surface conductivity of the nanocomposites (right scale). Dotted line and solid line correspond respectively to the experimental fit of bulk and surface conductivity. Inset: (▵
) log(sbulk) plotted as a function of log(p-pc bulk), (∎) log(ssurf) versus log(p-pc surf). Dotted line and solid line are respectively the linear fit for bulk and surface conductivity.The measured value of the percolation threshold is lower than the predicted value. The calculated corresponding aspect ratio is
x
¼ 28 using Mathew et al. model [56], which is close to the experimental value determined from SEM images (x
¼ 25). Un-derestimation of the experimental aspect ratio could be explained by the lack of information about the thickness of microplates. The model proposed by Mathew allows a good estimation of the experimental percolation threshold when microplates are dispersed in a polymer matrix.3.3.2. Surface conductivity
Surface conductivity presents a similar behaviour as bulk elec-trical conductivity. Nanocomposites with a filler fraction below 7 vol% present an insulating surface. When filler fraction is above 7 vol.% nanocomposites are electrically conductive with
s
s ¼ 0.074e36.9 S.☐ (r
s ¼ 0.027e13.4U
/☐). The data of surface conductive nanocomposites have been fitted with a power law model (Fig. 6). A linear regression (insetFig. 6) allowed to extract parameters such as pc (surf) ¼ 6.9 vol.% of filler and tsurf ¼ 1.34 ± 0.32. Percolation threshold occurs at higher filler fraction compared to bulk conductivity. It is thought that the orientation in the plane (2D) is reduced compared to a random 3D-orientation which is correlated to the reduction of the degree of freedom (3D to 2D orientation); eg. the sample containing 6.2 vol.% of filler is bulk conductive but insulative on the surface. The shift of the curve to a higher filler fraction is in accordance with the sim-ulations made by Favier et al. [57]. The value of dimensional exponent is consistent with those of a 2D-dimensionality (theo-retical values ranging between 1.1 and 1.3). The value of critical exponent tsurf depends on the geometry of the measurement and the state of dispersion of fillers and it is in accordance with litera-ture for 2D-systems[13,58]. The gap between bulk and surface percolation threshold is relatively low (~1%), a larger shift should be expected for percolation threshold from 3D-bulk to 2D-surface. It is important to mention that theoretical surface conductivity is sup-posed to be a perfect 2D plane where thickness limit is 0. In reality, even if the thickness of the nanocomposites is very thin (~50m
m) compared to their large diameter (Ø ~3 cm), the surface percolative network may not be represented by a monolayer at the extreme surface and conductive network may be distributed at least in the few micrometres below the surface. It is thought that the small shift of percolation threshold observed could be explained by the for-mation of a thin layer of conductive network. The difference be-tween the two percolation threshold values is attributed to the non-negligible experimental thickness of the conductive network. 4. ConclusionsSilver microplates were successfully obtained by a seed-mediated synthesis. During morphological selection phase, the conversion from spheres to nanoplates was controlled by UVeVi-sible spectroscopy. Microplates were obtained from nanoplates by 3 growth iterations, with sufficient quantities to disperse micro-plates in a polymer matrix. Their Lateral length is 1.15 ± 0.25
m
m and thickness is between 49 and 110 nm. The experimental aspect ratio was determined between 12 and 25. PVDF/AgMicroplatesnanocomposites at different loadings (4e20 vol.%) were elaborated by dispersing silver microplates into a PVDF solution. Homoge-neous dispersion of metallic filler was observed.
An original study of electrical properties was conducted to determinate both bulk and surface conductivity on the same samples. The characteristic step of an electrical percolation mech-anism is observed for both bulk and surface conductivity: The threshold occurs at 5.9 vol.% and 6.9 vol.% respectively for bulk conductivity and surface conductivity. A theoretical model allows
the determination of the aspect ratio of silver microplates as a function of the percolation threshold. Bulk percolation takes place in a 3D environment while surface percolation occurs in a quasi 2D environment thus explaining the shift of the percolation step. The fitting of data by the percolation law gives critical exponents of 1.58 ± 0.02 for bulk conductivity, and 1.34 ± 0.02 for surface con-ductivity. The decrease of t value from 3D to 2D systems is explained by the reduction of the dimensionality of the environ-ment. After the percolation threshold, bulk conductivity reaches 0.1e20 S m!1 and a surface conductivity
s
s ¼ 0.074e36.9 S.☐ (r
s¼ 0.027e13.4U
/☐). These levels of conductivity are more thanone decade over the conductivities reached with carbon nanofillers.
References
[1] M. Connor, S. Roy, T. Ezquerra, F. Balt!a Calleja, Broadband ac conductivity of conductor-polymer composites, Phys. Rev. B 57 (1998) 2286e2294. [2] J. Li, P.C. Ma, W.S. Chow, C.K. To, B.Z. Tang, J.-K. Kim, Correlations between
percolation threshold, dispersion state, and aspect ratio of carbon nanotubes, Adv. Funct. Mater. 17 (2007) 3207e3215.
[3] V.G. Shevchenko, S.V. Polschikov, P.M. Nedorezova, A.N. Klyamkina, A.N. Shchegolikhin, A.M. Aladyshev, et al., In situ polymerized poly(-propylene)/graphene nanoplatelets nanocomposites: dielectric and micro-wave properties, Polymer 53 (2012) 5330e5335.
[4] A. No€el, J. Faucheu, J.-M. Chenal, J.-P. Viricelle, E. Bourgeat-Lami, Electrical and mechanical percolation in graphene-latex nanocomposites, Polymer 55 (2014) 5140e5145.
[5] K.H. Liao, Y. Qian, C.W. MacOsko, Ultralow percolation graphene/polyurethane acrylate nanocomposites, Polymer 53 (2012) 3756e3761.
[6] S. Barrau, P. Demont, A. Peigney, C. Laurent, C. Lacabanne, Dc and ac con-ductivity of carbon nanotubes-polyepoxy composites, Macromolecules 36 (2003) 5187e5194.
[7] L.Q. Cortes, A. Lonjon, E. Dantras, C. Lacabanne, High-performance thermo-plastic composites poly(ether ketone ketone)/silver nanowires: morpholog-ical, mechanical and electrical properties, J. Non. Cryst. Solids 391 (2014) 106e111.
[8] D. Untereker, S. Lyu, J. Schley, G. Martinez, L. Lohstreter, Maximum conduc-tivity of packed nanoparticles and their polymer composites, ACS Appl. Mater. Interfaces 1 (2009) 97e101.
[9] A. Lonjon, L. Laffont, P. Demont, E. Dantras, C. Lacabanne, Structural and electrical properties of gold nanowires/P(VDF-TrFE) nanocomposites, J. Phys. D. Appl. Phys. 43 (2010) 345401.
[10] A. Lonjon, L. Laffont, P. Demont, E. Dantras, C. Lacabanne, New highly conductive nickel nanowire-filled P(VDF-TrFE) copolymer nanocomposites: Elaboration and Structural Study, J. Phys. Chem. C 113 (2009) 12002e12006. [11] S. Wang, Y. Cheng, R. Wang, J. Sun, L. Gao, Highly thermal conductive copper nanowire composites with ultralow loading: toward applications as thermal interface materials, ACS Appl. Mater. Interfaces 6 (2014) 6481e6486. [12] a.B.V.K. Kumar, J. Jiang, C.W. Bae, D.M. Seo, L. Piao, S.H. Kim, Silver nanowire/
polyaniline composite transparent electrode with improved surface proper-ties, Mater. Res. Bull. 57 (2014) 52e57.
[13] V. Bocharova, A. Kiriy, U. Oertel, M. Stamm, F. Stoffelbach, R. J!er^ome, et al., Ultrathin transparent conductive films of polymer-modified multiwalled carbon nanotubes, J. Phys. Chem. B 110 (2006) 14640e14644.
[14] J. Li, J. Liang, X. Jian, W. Hu, J. Li, Q. Pei, A flexible and transparent thin film heater based on a silver nanowire/heat-resistant polymer composite, Mac-romol. Mater. Eng. 299 (2014) 1403e1409.
[15] Y. Il Song, C.-M. Yang, D.Y. Kim, H. Kanoh, K. Kaneko, Flexible transparent conducting single-wall carbon nanotube film with network bridging method, J. Coll. Interface Sci. 318 (2008) 365e371.
[16] X. He, R. He, A. Liu, X. Chen, Z. Zhao, S. Feng, et al., A highly conductive, flexible, transparent composite electrode based on the lamination of silver nanowires and polyvinyl alcohol, J. Mater. Chem. C 2 (2014) 9737e9745. [17] J.R. Potts, D.R. Dreyer, C.W. Bielawski, R.S. Ruoff, Graphene-based polymer
nanocomposites, Polymer 52 (2011) 5e25.
[18] C. Wu, X. Huang, G. Wang, L. Lv, G. Chen, G. Li, et al., Highly conductive nanocomposites with three-dimensional, compactly interconnected graphene networks via a self-assembly process, Adv. Funct. Mater. 23 (2013) 506e513. [19] X. Peng, F. Tan, W. Wang, X. Qiu, F. Sun, X. Qiao, et al., Conductivity improvement of silver flakes filled electrical conductive adhesives via intro-ducing silver-graphene nanocomposites, J. Mater. Sci. Mater. Electron 25 (2014) 1149e1155.
[20] J.J. Mock, M. Barbic, D.R. Smith, D.a. Schultz, S. Schultz, Shape effects in plasmon resonance of individual colloidal silver nanoparticles, J. Chem. Phys. 116 (2002) 6755.
[21] K.L. Kelly, E. Coronado, L.L. Zhao, G.C. Schatz, The optical properties of metal nanoparticles: the influence of size, shape, and dielectric environment, J. Phys. Chem. B 107 (2003) 668e677.
[22] M. Rycenga, C.M. Cobley, J. Zeng, W. Li, C.H. Moran, Q. Zhang, et al., Controlling the synthesis and assembly of silver nanostructures for plasmonic
applications, Chem. Rev. 111 (2011) 3669e3712.
[23] J. Zeng, S. Roberts, Y. Xia, Nanocrystal-based time-temperature indicators, Chem. - A Eur. J. 16 (2010) 12559e12563.
[24] C. Gao, Z. Lu, Y. Liu, Q. Zhang, M. Chi, Q. Cheng, et al., Highly stable silver nanoplates for surface plasmon resonance biosensing, Angew. Chem. Int. Ed. Engl. 51 (2012) 5629e5633.
[25] I. Vukoje, V. Lazi!c, V. Vodnik, M. Mitri!c, B. Joki!c, S. Phillip Ahrenkiel, et al., The influence of triangular silver nanoplates on antimicrobial activity and color of cotton fabrics pretreated with chitosan, J. Mater. Sci. 49 (2014) 4453e4460. [26] M. Rai, A. Yadav, A. Gade, Silver nanoparticles as a new generation of
anti-microbials, Biotechnol. Adv. 27 (2009) 76e83.
[27] R. Jin, Y. Cao, C.A. Mirkin, K.L. Kelly, G.C. Schatz, J.G. Zheng, Photoinduced conversion of silver nanospheres to nanoprisms, Science 294 (2001) 1901e1903.
[28] N. Li, Q. Zhang, S. Quinlivan, J. Goebl, Y. Gan, Y. Yin, H2O2-aided seed-mediated
synthesis of silver nanoplates with improved yield and efficiency, Chem-physchem 13 (2012) 2526e2530.
[29] Q. Zhang, Y. Hu, S. Guo, J. Goebl, Y. Yin, Seeded growth of uniform Ag nano-plates with high aspect ratio and widely tunable surface plasmon bands, Nano Lett. (2010) 5037e5042.
[30] J. Zeng, X. Xia, M. Rycenga, P. Henneghan, Q. Li, Y. Xia, Successive deposition of silver on silver nanoplates: lateral versus vertical growth, Angew. Chem. Int. Ed. Engl. 50 (2011) 244e249.
[31] J. Zeng, J. Tao, W. Li, J. Grant, P. Wang, Y. Zhu, et al., A mechanistic study on the formation of silver nanoplates in the presence of silver seeds and citric acid or citrate ions, Chem. Asian J. 6 (2011) 376e379.
[32] A. Le Beulze, E. Duguet, S. Mornet, J. Majimel, M. Tr!eguer-Delapierre, S. Ravaine, et al., New insights into the side-face structure, growth aspects, and reactivity of agn nanoprisms, Langmuir 30 (2014) 1424e1434. [33] J. Song, Y. Chu, Y. Liu, L. Li, W. Sun, Room-temperature controllable fabrication
of silver nanoplates reduced by aniline, Chem. Commun. (2008) 1223e1225. [34] H. Murayama, N. Hashimoto, H. Tanaka, Ag triangular nanoplates synthesized by photo-induced reduction: structure analysis and stability, Chem. Phys. Lett. 482 (2009) 291e295.
[35] X. Liu, L. Li, Y. Yang, Y. Yin, C. Gao, One-step growth of triangular silver nanoplates with predictable sizes on a large scale, Nanoscale 6 (2014) 4513e4516.
[36] G.S. M!etraux, C.a. Mirkin, Rapid thermal synthesis of silver nanoprisms with chemically tailorable thickness, Adv. Mater. 17 (2005) 412e415.
[37] B. Tang, S. Xu, X. Hou, J. Li, L. Sun, W. Xu, et al., Shape evolution of silver nanoplates through heating and photoinduction, ACS Appl. Mater. Interfaces 5 (2013) 646e653.
[38] I. Washio, Y. Xiong, Y. Yin, Y. Xia, Reduction by the end groups of poly(vinyl pyrrolidone): a new and versatile route to the kinetically controlled synthesis of Ag triangular nanoplates, Adv. Mater. 18 (2006) 1745e1749.
[39] X. Xia, J. Zeng, Q. Zhang, C.H. Moran, Y. Xia, Recent Developments in Shape-Controlled Synthesis of Silver Nanocrystals, J. Phys. Chem. C. Nanomater. In-terfaces 116 (2012) 21647e21656.
[40] Q. Zhang, N. Li, J. Goebl, Z. Lu, Y. Yin, A systematic study of the synthesis of silver nanoplates: is citrate a “magic” reagent? J. Am. Chem. Soc. 133 (2011) 18931e18939.
[41] M. Tsuji, A. Yajima, M. Hamasaki, M. Hattori, M. Mitarai, H. Kawazumi, Syn-thesis and growth mechanism of triangular Ag-rich AgAu alloy prisms in an aqueous solution in the presence of PVP, citrate and H2O2, CrystEngComm 15
(2013) 7688.
[42] X. Zou, E. Ying, H. Chen, S. Dong, An approach for synthesizing nanometer- to micrometer-sized silver nanoplates, Coll. Surf. A Physicochem. Eng. Asp. 303 (2007) 226e234.
[43] D.M. Ledwith, A.M. Whelan, J.M. Kelly, A rapid, straight-forward method for controlling the morphology of stable silver nanoparticles, J. Mater. Chem. 17 (2007) 2459.
[44] Z. Yi, J. Zhang, H. He, X. Xu, B. Luo, X. Li, et al., Convenient synthesis of silver nanoplates with adjustable size through seed mediated growth approach, Trans. Nonferrous Met. Soc. China 22 (2012) 865e872.
[45] Y. Xia, Y. Xiong, B. Lim, S.E. Skrabalak, Shape-controlled synthesis of metal nanocrystals: simple chemistry meets complex physics? Angew. Chem. Int. Ed. Engl. 48 (2009) 60e103.
[46] W.A. Maryniak, T. Uehara, M.A. Noras, Surface Resistivity and Surface Resis-tance Measurements Using a Concentric Ring Probe Technique, Trek Inc, 2003, pp. 798e801.
[47] Q. Lu, K.-J. Lee, K.-B. Lee, H.-T. Kim, J. Lee, N.V. Myung, et al., Investigation of shape controlled silver nanoplates by a solvothermal process, J. Coll. Interface Sci. 342 (2010) 8e17.
[48] J.E. Millstone, S.J. Hurst, G.S. M!etraux, J.I. Cutler, C.a Mirkin, Colloidal gold and silver triangular nanoprisms, Small 5 (2009) 646e664.
[49] R. Jin, Y.C. Cao, E. Hao, G.S. M!etraux, G.C. Schatz, C.A. Mirkin, Controlling anisotropic nanoparticle growth through plasmon excitation, Nature 425 (2003) 487e490.
[50] A. Lonjon, P. Demont, E. Dantras, C. Lacabanne, Electrical conductivity improvement of aeronautical carbon fiber reinforced polyepoxy composites by insertion of carbon nanotubes, J. Non. Cryst. Solids 358 (2012) 1859e1862. [51] D. Stauffer, Introduction to Percolation Theory, Taylor & Francis Ltd, London
and Philadelphia, 1985.
[52] D. Carponcin, E. Dantras, G. Aridon, F. Levallois, L. Cadiergues, C. Lacabanne, Evolution of dispersion of carbon nanotubes in polyamide 11 matrix com-posites as determined by DC conductivity, Compos. Sci. Technol. 72 (2012) 515e520.
[53] J.K.W. Sandler, J.E. Kirk, I.a. Kinloch, M.S.P. Shaffer, a.H. Windle, Ultra-low electrical percolation threshold in carbon-nanotube-epoxy composites, Poly-mer 44 (2003) 5893e5899.
[54] I. Balberg, C. Anderson, S. Alexander, N. Wagner, Excluded volume and its relation to the onset of percolation, Phys. Rev. B 30 (1984) 3933e3943. [55] D. Frenkel, Invited Lecture. Columnar ordering as an excluded-volume effect,
Liq. Cryst. 5 (1989) 929e940.
[56] M. Mathew, T. Schilling, M. Oettel, Connectivity percolation in suspensions of hard platelets, Phys. Rev. E 85 (2012) 061407.
[57] V. Favier, R. Dendievel, G. Canova, J.Y. Cavaille, P. Gilormini, Simulation and modeling of three-dimensional percolating structures: case of a latex matrix reinforced by a network of cellulose fibers, Acta Mater. 45 (1997) 1557e1565. [58] J.P. Clerc, G. Giraud, S. Alexander, E. Guyon, Conductivity of a mixture of conducting and insulating grains: dimensionality effects, Phys. Rev. B 22 (1980) 2489e2494.