To link to this article:
DOI:10.1016/j.polymertesting.2016.08.025URL:
http://dx.doi.org/10.1016/j.polymertesting.2016.08.025
This is an author-deposited version published in:
http://oatao.univ-toulouse.fr/
Eprints ID:
18481
To cite this version:
Ge, Yangyang and Gong, Xiaojing and Hurez, Anita and De Luycker,
Emmanuel Test methods for measuring pure mode III delamination
toughness of composite. (2016) Polymer Testing, vol. 55. pp. 261-268.
ISSN 0142-9418
O
pen
A
rchive
T
oulouse
A
rchive
O
uverte (
OATAO
)
OATAO is an open access repository that collects the work of Toulouse researchers and
makes it freely available over the web where possible.
Any correspondence concerning this service should be sent to the repository
administrator:
[email protected]
Test method
Test methods for measuring pure mode III delamination toughness of
composite
Yangyang Ge
a, Xiaojing Gong
a,*, Anita Hurez
b, Emmanuel De Luycker
aaUniversit!e de Toulouse, Institut Cl!ement Ader UMR CNRS 5312, INSA/UPS/ISAE/Mines Albi, France bDRIVE EA1859, Univ. Bourgogne Franche Comte, F58000, Nevers, France
Keywords:
Mode III delamination Testing method
Edge Ring Crack Torsion test (ERCT)
a b s t r a c t
This paper focuses on the characterization of pure mode III delamination behavior of composite mate-rials. The development for pure mode III delamination testing methods is reviewed. Two testing methods for mode III experiments were evaluated: a novel test proposed in our previous study, termed Edge Ring Crack Torsion (ERCT) test, and the widely used Edge Crack Torsion (ECT) test. The two methods were compared by experiment and finite element analysis. The results demonstrate the advantage of ERCT. The limitations of the ECT test are discussed.
1. Introduction
Delamination is one of the common damage modes in a lami-nated composite. In order to establish a general criterion capable of representing the delamination resistance of a composite, one must know how to measure correctly the delamination toughness for each pure mode in terms of critical strain energy release rate. Currently, the characterization methods for delamination under pure mode I, pure mode II, as well as a mixed mode of I þ II[1,2]
have been widely studied. On the contrary, the work regarding the participation of mode III is quite limited because a pure mode III delamination is not easy to achieve in experiment. As a result, the mode III is usually considered as a shear mode the same as mode II, and the same critical strain energy release rate is assumed such that
GIIC¼ GIIIC. However, this assumption is not satisfactory because the
two shear modes are physically distinctive and the values of GIIC
and GIIICcan be quite different for some composite materials.
Generally, a pure mode III delamination test should meet the following conditions:
(1) the participation of mode I and mode II must be small enough to be negligible;
(2) the variation of the strain energy release rate in mode III, GIII,
along the crack front should be as small as possible so that its
average value at the crack onset can be regarded as the fracture toughness.
In literature, a number of test methods have been proposed for the evaluation of the mode III critical strain energy release rate,
GIIIC. The first tests introduced were the Crack Rail Shear test (CRS)
(Becht and Gillespie, 1988)[3]and the Split Cantilever Beam test (SCB) (Donaldson, 1988)[4]. The main drawback of these tests is the participation of mode I and mode II in the area around the edges of the crack front[3e5].
The closed-form expression to determine GIIICfrom a SCB test is
based on the beam theory, and the classical unidirectional speci-mens can be used in this test. Its configuration has been modified by different authors in order to cancel mode I and mode II, as well as to obtain a more uniform GIIIalong the crack front. In general,
most modified SCB tests can eliminate the mode I component and reduce the mode II component. Robinson and Song[6]tried to limit the bending moment by introducing additional constraints, but they concluded that the experimental Compliance Calibration (CC) method could no longer be applied in the data reduction schema. Another modified version of SCB configuration (MSCB) was then realized by Sharif et al.[7], whose specimen was loaded by special grips and the mode II component was significantly reduced. The data reduction method based on an improved beam theory was found to be more reliable than the CC method[8]. However, the measurement of GIIIC was disturbed because the specimen was
strongly constrained at its edges near the crack front, so the vari-ation of GIIIalong the crack front became more significant. As a * Corresponding author.
result, it was not easy to define the crack onset at the loadedisplacement curves [9,10]. Later, a small free edge crack along the length of the specimens in the MSCB specimen test was introduced by Davidson and Sediles[11]in order to obtain a more uniform GIIIalong the crack front. The results highlighted the fact
that the distribution of GIIIalong the crack front was fairly small.
Moreover, the delamination onset was defined by a load drop even although a high level of non-linearity before the critical load was observed. However, the width of the edge crack along the specimen length had to be in several millimeters. It is difficult to guarantee such accuracy[11].
The Edge Crack Torsion (ECT) test was proposed by Lee (1993)
[12]. A tensile machine was used to load the specimen under tor-sion up to delamination growth from an edge crack. The closed-form expression to determine GIIICwas based on the plate theory.
Different from SCB, the specimens have to be multidirectional laminates whose in-plane twisting stiffness and strength must be strong enough to assure the crack propagation. Actually, the loading conditions in the first ECT tests [12e17] were not sym-metrical to the specimen axis, which induced a significant variation of GIIIat one side of the crack front. Recent studies[18e24]adopted
a configuration with more symmetric loading conditions. This modification allows decreasing the likelihood of geometric nonlinearity and improving the uniformity of GIIIalong the crack
front. Another ECT configuration using a torsion machine, called ECT-a thereafter, was proposed by H. Suemasu [25] aiming at obtaining uniform distribution of GIII along the crack front. Both
ends of specimens in the ECT-a test were loosely fixed so that an axial sliding was permitted during the application of an axial tor-que. In all ECT tests, pure mode III component proved to be in the mid-region of crack front, while mode II component appears near the edges. Mode II component can be reduced to a reasonable level with an appropriate choice of the specimen geometry[18e20,22]. It is not satisfactory to apply the data reduction schema based on experimental CC method for determining GIIIC because a large
number of specimens with different initial crack lengths had to be used, and the value of GIIIC was found to increase with the crack
length[22]. Moreover, small initial crack lengths for ECT specimens should be preferable for measuring GIIIC[26], but too small initial
crack lengths would decrease the accuracy because of the uncer-tainty in the real crack length measurement. Furthermore, it is not easy to identify the crack onset in most ECT tests because there is a significant non-linearity on the load/displacement curve before the critical load is reached, which can be associated with a R-curve effect [18e22,27e29]. Recently, a Six-Point Edge Crack Torsion (6ECT) test was proposed by Pereira et al.[30], who contribute to a relatively clear identification of the critical load and evaluation of the mode III R-curve effect.
Unfortunately it can be seen that the participation of mode II in all these tests can never be totally eliminated. In most cases, the variation of GIII along the crack front is too big to be negligible.
Generally, this variation is smaller in the central region of the crack front, but much more significant at the edges. GIIIvalues can go to
almost zero at the two edges of the crack front. To reduce the in-fluence of this edge effect it is better to use specimens with a longer crack front. Compared to SCB test, the crack front length of the ECT specimen is less limited.
In summary, a test method for the characterization of pure mode III delamination is yet to be developed. Recently, an original pure mode III test has been proposed, termed Edge Ring Crack Torsion (ERCT) test[31]. This is a torsion test on a composite plate containing an edge ring crack between two layers. The loading mode obtained is pure mode III, and the crack front is circular, i.e. it is closed without edges. The edge effect in ECT specimens mentioned above is, therefore, eliminated. Moreover, the variation
of GIIIalong the crack front can be reduced by optimizing different
parameters of the specimen and the testing device.
In order to further validate the ERCT method, this paper com-pares the ERCT with the ECT-a test method. The mode III experi-ments were conducted with a carbon/epoxy composite. Finite element analysis (FEA) for the two testing methods was performed. 2. Experimental
2.1. Materials and specimens
All specimens for ERCT and ECT tests were obtained from a woven carbon/epoxy taffeta fabric prepreg (ref: IMP503Z).Table 1
lists the properties of the unidirectional composite, i.e. a laminate with yarns oriented in 0#in all fabric plies.
The composite laminate was manufactured by hand lay-up and a 13
m
m thick polyester film was inserted in the mid-thickness ofthe laminate in order to create a pre-crack. 32 plies were used for the whole laminate and the stacking sequence was [0/45/45/0/45/ 0/0/45/45/0/0/45/0/45/45/0]//crack//[0/45/45/0/45/0/0/45/45/0/0/ 45/0/45/45/0], where 0 represents a taffeta balanced fabric ply with yarns oriented in 0#and 90#, while 45 represents the same fabric
oriented at ±45#. The pre-crack symmetrically separates the
lami-nate into two sub-lamilami-nates, which are also symmetrical lamilami-nates relative to their midplanes.
The stacking sequence of each sub-laminate was optimized in order to obtain particular laminate characteristics:
$ quasi-homogeneous, i.e. the same elastic stiffness properties in tension and in bending;
$ quasi-isotropic, i.e. the same elastic stiffness properties in ten-sion and in bending in all direction;
$ the elimination of all possible coupling terms: Bij¼ A16¼ A26¼ D16¼ D26¼ 0
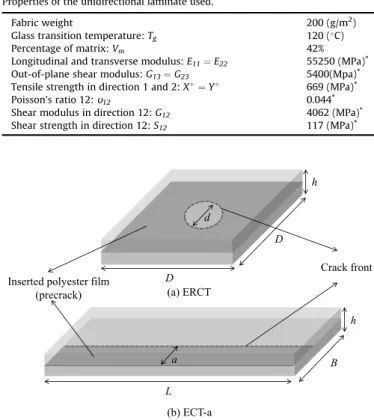
The crack front of ERCT specimen is circular (Fig. 1(a)) whereas that of ECT-a is rectilinear (Fig. 1(b)). For the former, a disc was cut out in the center of the inserted polyesterfilm with the help of a circle cutter. The circular hole of diameter d forms a non-delaminated area (Fig. 1(a)). In order to locate the center of the circular hole on the rotation axis of the machine, the center of the hole is identified on the outer skins of the sample. The precise location of the hole has been verified by Ultrasonic C-scan.
2.2. Test methods
All the tests were carried out at ambient temperature. An axial rotation speed of 0.5#/min was imposed.
Concerning the ERCT tests, two diameters d of the central circle (non-delaminated area) were used while the outer diameter of the ring crack was kept the same. In ECT tests, specimens with 4 different initial crack lengths were tested for the application of CC method. The dimensions of all specimens tested are listed in
Table 2.
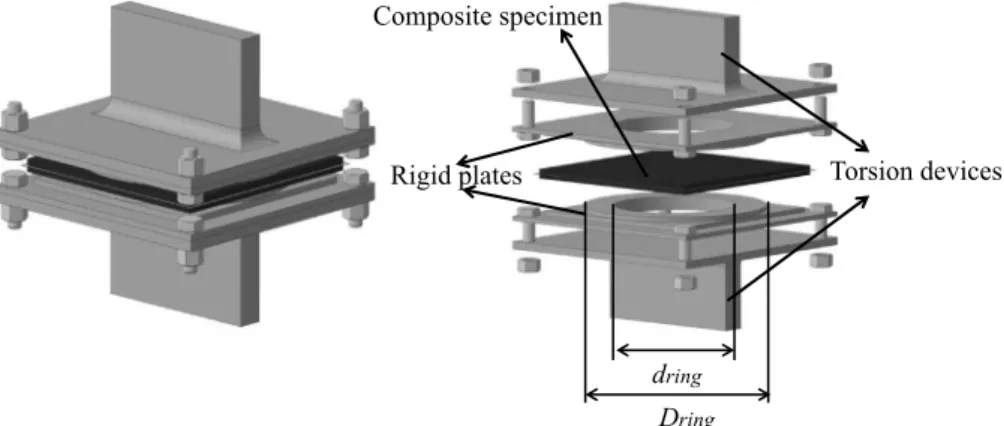
2.2.1. Edge Ring Crack Torsion test (ERCT)
ERCT (Fig. 2) was proposed in order to obtain pure mode III delamination. Firstly, the composite specimen was pasted to the ring protruding from two rigid plates. The inner and outer di-ameters of the ring; dring and Dring, were 80 mm and 120 mm
respectively. Great care was taken in order to locate the center of the circular non-delaminated area on the axis of the rigid plates during the pasting process. Secondly, the rigid plates were screwed to the torsion device. Finally, the torsion device was submitted to an imposed rotation up to the crack propagation. As a result of the
holes in the rigid plates, it was also possible to observe the crack propagation by Ultrasonic C-scan.
2.2.2. Edge Crack Torsion test (ECT-a)
In ECT-a test, both ends of the test specimens were blocked in jaws and an axial sliding was permitted by the machine during the application of a torque, shown inFig. 3. Note that no extra device is required.
3. Finite element analysis
FEA was performed using Ls-Dyna, a commercial FE package. The devices and the specimens were modeled with 3D solid ele-ments. MAT 22, a material model based on the Chang-Chang frac-ture criterion, was chosen to simulate the composite laminates. Spring elements were arranged at the crack tip along the crack front in order to obtain local loads and relative displacements, which are necessary to determine the value of GI, GII, and GIIIby the virtual
crack closure technique (VCCT) [32; 33]. The surface to surface contact was applied on the two delamination surfaces to prevent interpenetration during the analysis. The relative sliding between the points within the delamination plane was assumed to be frictionless.
In the FE model, each ply was modeled with one layer of sold element with its orientation defined according to the stacking sequence. The principal properties of material were set according to
Table 1, where all values with “*” were measured on unidirectional laminate used while others were referred to the literature.
The FE mesh close to the crack front was locally refined (Fig. 4) to guarantee good accuracy of the results. The mesh refinement has been studied. It demonstrated that the difference on Gi(i ¼ I, II, III)
calculated by VCCT between the model with the current mesh and that with twice numbers of elements in the plate plane (r,Ɵ) near the crack front is about 1%. Concerning the thickness direction z, a model with two elements in the thickness of each ply of the plate has been tested on a simplified model loaded in torsion, and leads to 2.7% of variation. However, the quality of the finite element is degraded by refining the mesh in the z direction, because its aspect ratio, i.e. the dimension in z is too small compared to those in r and
Ɵdirections.
As an example, the FE model used for ERCT is shown inFig. 5, whereƟis defined in a polar coordinate. ECT-a test model is shown
inFig. 6. Note that the position of the ECT-a specimen relative to the torsional axis influences the distribution of GIII. The FEA of ECT-a
test also allows optimizing the position of the specimen in the jaws in order to obtain the crack onset from the pre-crack, but not from the opposite edge. Actually, it would be better to place the crack front close to the rotation axis.
4. Results and discussion
4.1. Edge Ring Crack Torsion test (ERCT)
In the ERCT test, the edge ring crack grows towards the center of the non delaminated area and always in an unstable manner. The test reproducibility is fairly good.Fig. 7 shows a typical experi-mental torque-rotation curve, where a sudden drop in the torque is observed after a small nonlinear part. In this study, the peak torque is considered as the critical load, TC, corresponding to the crack
growth onset. Actually, we could not stop the test in the nonlinear area to know whether the crack has propagated. The test was stopped right after the load drop, and then the specimen was scanned by Ultrasonic C-scan in order to verify the crack propagation.
Fig. 8shows the images obtained by Ultrasonic C-scan on the three tested specimens with d ¼ 30 mm before and after crack growth, where the white zone presents the non-delaminated area. It demonstrates that the crack indeed propagated. Moreover, it seems that the crack propagated much more along an angle ƟC
close to (±45#). One explanation may be that the crack resistance
varies as a function of the adjacent fiber directions, and the resis-tance of the crack tips atƟCis smaller under shear mode. We can
also imagine that the penetration of air and/or water into the delaminated areas after the test depends on their fracture mode and damage level. To verify these assumptions, the interpretation of the images obtained from Ultrasonic C-scan requires further study. The curves inFig. 9andFig. 10illustrate the evolution of GI, GII
and GIIIalong the crack front obtained by finite element method at
the critical torque TC. It is interesting to note that the contributions
of mode I and mode II are almost zero, which demonstrates that the crack is indeed loaded in pure mode III. The values of GIIIshow a
periodic variation instead of being constant which, however, can be minimized by optimization,. In fact, the evolution of GIIIalong the
crack front is the result of different influences. It depends, not only on the geometry of the device used for applying the torque, which is not strictly axisymmetrical, but also on the composite specimens, especially on the adjacent fiber orientation relative to the local crack front. The ratio of d/Dringis also a parameter that determines
the importance of the effects mentioned above. If we define a relative variation parameter as follows:
D
¼ jGIII-max-GIII-avj)/GIII-av,and
D
is about 7.5% for the specimens with d ¼ 30 mm and 17.4% forTable 1
Properties of the unidirectional laminate used.
Fabric weight 200 (g/m2)
Glass transition temperature: Tg 120 (#C)
Percentage of matrix: Vm 42%
Longitudinal and transverse modulus: E11¼ E22 55250 (MPa)*
Out-of-plane shear modulus: G13¼ G23 5400(Mpa)*
Tensile strength in direction 1 and 2: Xþ¼ Yþ 669 (MPa)* Poisson's ratio 12: ʋ12 0.044*
Shear modulus in direction 12: G12 4062 (MPa)*
Shear strength in direction 12: S12 117 (MPa)*
L B a D D d (a) ERCT (b) ECT-a Inserted polyester film
(precrack)
Crack front
h
h
Fig. 1. Schematics of the specimens with inserted polyester film for (a) ERCT and (b) ECT-a.
Table 2
Geometries of the specimens of ERCT and ECT-a.
ERCT (mm) h ¼ 7 dring¼ 80 Dring¼ 120 d ¼ 30,50
those with d ¼ 50 mm. Moreover, the maximum GIIIis localized at
Ɵ¼ 0#and 180#, so the propagation of the crack should initiate at
these crack tips if the toughness in pure mode III was independent of adjacent fiber orientation. A simply and practical approach was then considered. In the case of an infinite cylinder of diameter D including an edge ring crack at a cross section submitted to an axial torque T, where the crack front is circular of diameter d, the stress
intensity factor KIIIis given by a semi-analytical Equation(1)from
the Tada Handbook[34].
KIII¼ 16T
p
d3 ffiffiffiffiffiffiffiffiffiffiffiffiffiffiffiffiffiffiffiffip
ðD ' dÞ 2 r :f #d D $ (1) with f # d D $ ¼3 8 ffiffiffi d D q : " 1 þ1 2Ddþ38 # d D $2 þ5 16 # d D $3 þ35 128 # d D $4 þ 0;208 # d D $5#In fracture mechanics, KIIIis related to strain energy release rate
GIIIby Equation(2)for isotropic materials if the crack grows in a
self-similar manner, where G is the shear modulus of the isotropic material. GIII¼ 1 2GK 2 III (2)
Torsion devices
Composite specimen
Rigid plates
d
ringD
ring Fig. 2. Edge Ring Crack Torsion test device (ERCT).Fig. 3. Configuration of Edge Crack Torsion-2 test (ECT-a).
Fig. 4. Finite element mesh of the ERCT specimen.
Fig. 5. Finite element model of the ERCT test.
Actually, the FE model was also validated by comparison of the calculated GIIIusing VCCT and Tada formula, which are obtained
from an isotropic cylinder model. The difference is less than 2%. Herein, the isotropic cylinder is in steel with length of 2 ) 50 mm and diameter of 120 mm. An edge ring crack is located at mid-length, whose non cracked area has a diameter of 30 mm. It is interesting to note that, although the cylinder simulated here is not really an infinite cylinder, the Tada's formula seems to be a good approach for an isotropic material.
Even although the crack in ERCT specimens is embedded in two plates in laminated composite instead of an isotropic cylinder, we want to know whether this closed-form formula can be applied for determining GIIIin the case of the ERCT test. Note that G calculated
by Equation(2)should be GzƟfor a laminate, which generally varies
as a function of Ɵ. However, the tested laminates are quasi-isotropic. So GzƟis constant and GzƟ¼ G13according to the
anal-ysis by J.M. Berthelot[35]. By introducing the critical torque into the Equations(1) and (2), the toughness in pure mode III can be ob-tained.Table 3gives the results for the specimens with d ¼ 30 mm and d ¼ 50 mm. The difference of GIIICis small, so no significant
influence of the crack diameter on GIIICwas observed.
As a result, the average value of GIIICwill be considered, named
GIIIC-Tada. It is presented in the same table and also compared to the
numerical results inFigs. 9 and 10. It is shown that, for the spec-imen with d ¼ 30 mm, the GIIIC-Tadavalue agrees well with the
average value calculated at the critical load by VCCT, named G IIIC-FEM. The difference between GIIIC-Tadaand GIIIC-FEMmeasured on the
specimens with d ¼ 30 mm is only approximately 2.2%; this dif-ference is more significant measured on those with d ¼ 50 mm, which is approximately 20.5%. It seems that if the variation of GIII
along the crack front is large, the closed-form proposed by Tada would no longer be applicable.
4.2. Edge Crack Torsion test (ECT-a)
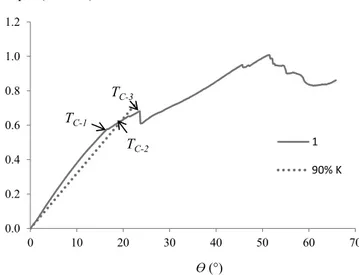
Fig. 11(a) gives a typical experimental curve of the ECT-a test. Herein, the critical load corresponding to the onset of crack growth is not easy to define. We try to define an appropriate critical torque
TCin different ways. Three values of GIIICwere calculated according
to different definitions of TC: TC-1is the torque at the end of the
linear domain; TC-2the torque at the intersection of the curve and a
line at 90% of initial slope of the linear domain; TC-3the torque at
first visible drop in the torque value.
Firstly, one of the three tests was stopped and scanned right after the first drop in torque (TC-3), shown inFig. 11(b). Not only the
propagation at the pre-crack was observed, but also a little prop-agation at the opposite edge, where the expression proposed for determination of GIIIC is no longer available. We believe that the
onset of crack occurs before reaching TC-3. The critical torque is
believed to be between TC-1 and TC-2. Similar conclusions were
reached in the work of Marat-Mendes R[21].
The evolution of GI, GIIand GIIIalong the crack front computed at
TC-2 for ECT-a specimen with initial crack length of 20 mm is
illustrated inFig. 12. It is seen that the uniformity of GIIIin ECT-a test
is better in the central domain along the crack front, but the values of GIIIdrop dramatically at the edges (x/L ¼ 0 and 1). However, the
value of
D
is about 14.0%, close to that from ERCT specimens with d ¼ 50 mm. Moreover, the loading condition is a mixed mode IIIþD
II at the crack edges. For the specimens with other initial crack length, the distribution of GI, GII and GIIIalong the crack front issimilar.
Aiming at finding a simple and practical approach, the critical strain energy release rate was then calculated using CC method (Equation. (4)) modified from Equation (3) [21], where C is the
Fig. 7. A typical experimental torque-rotation curve of ERCT test with d ¼ 30 mm.
measured compliance and m is obtained by the compliance calibration. GIIIC¼ mCP2 c 2BL(1 ' m(a B )) (3) GIIIC¼ mCT2 2BL(1 ' m(a B )) (4)
The results are compared in theFig. 13. It is seen that the values of GIIIC measured on the specimens with different initial crack
lengths (10 mm, 15 mm, 20 mm, 25 mm) are very close to each other if TC-1or TC-2are considered as the critical load while the
difference becomes too large if TC-3is used. Actually, the GIIICusing
TC-3corresponds to the first unstable crack propagation instead of
the onset of crack growth, and the definition of the value of TC-2is
more meaningful experimentally. Therefore, only TC-2 is used to
determine GIIICfor discussion in next section.
Finally, the average value of GIIICfrom all the tests with specimen
a ¼ 20 mm obtained by Equation(4), named GIIIC-CC, are also
pre-sented inFig. 12. It shows that GIIIC-CCis 16.2% smaller than GIIIC-FEM. Fig. 9. Evolution of GI, GIIand GIIIalong the circular crack front of ERCT specimen with
d ¼ 30 mm.
Fig. 10. Evolution of GI, GIIand GIIIalong the circular crack front of ERCT specimen with
d ¼ 50 mm.
Table 3
GIIICobtained from Tada's formula for ERCT tests.
d (mm) TC-av(N.m) G (MPa) KIII(MPa.m1/2) GIIIC-Tada(N/m)
30 204 ± 4 5400 3.13 ± 0.06 910 ± 34 50 742 ± 3 5400 3.17 ± 0.02 932 ± 11
Fig. 11. A typical experimental torque-rotation curve and the Omniscan image of ECT-a test (a) Definitions of critical load (b) Omniscan image for one specimen.
Fig. 12. Evolution of GI, GIIand GIIIalong the crack front of ECT-a specimen.
5. Conclusion
After the review of the development of pure mode III testing methods, it is found that most of the tests proposed in the literature cannot completely eliminate the contribution of mode II. Further-more, the distribution of GIIIalong the crack front is far from
uni-form. As a result, the test method for the determination of GIIIC
should be improved.
In this study, the novel test ERCT and the ECT-a test were per-formed on a woven carbon/epoxy taffeta composite. These tests were also simulated using FEA to investigate the evolution of GI, GII
and GIII along the crack front. The values of GIIIC obtained by
different methods for the two tests are listed inTable 4. For both tests, the results of FEA show that the data reduction methods based on average value may not be good enough to determine the toughness if the variation of GIIIalong the crack front is significant
because the value of GIIIC-FEMcan be much higher than that from the
other simplified approaches. It is interesting to note that the rela-tive variation parameter
D
and the maximum value of GIII-maxforERCT test with d ¼ 50 mm is close to that from ECT-a test. The most significant advantages of ERCT test are:
$ the fracture mode is pure mode III without contributions of mode I or mode II components;
$ the variation of GIIIalong the crack front is much smaller than
ECT tests;
D
can be less than 7.6% by optimizing the geometry of the specimen. Hence, it is acceptable to consider the average value as the material toughness;$ the critical load corresponding to the crack onset is easy to define;
$ the agreement between GIIIC-Tadaand GIIIC-FEMis good for a small
diameter d.
Some limitations of ERCT test must be mentioned:
$ the crack resistance may vary as a function of the adjacentfiber orientations. If that is the case, the crack resistance is not a constant in ERCT test because the angle between fiber orienta-tion and crack front varies regularly. In this case, the delami-nation toughness evaluated by Tada formula presents the smallest value, which is also meaningful
$ the crack propagation is unstable, which prevents R-curve measurements
The limitation of the ECT-a test are:
$ there is a participation of mode II component at the edges of the crack front;
$ the variation of GIIIalong the crack front is significant when the
whole crack front is taken into consideration because the values of GIIIdrop dramatically at the edges;
$ the critical load corresponding to the crack onset is not easy to define;
$ GIIIC-CCis 16.2% smaller than GIIIC-FEM.
In conclusion, the ERCT test is a promising pure mode III test
method for measuring GIIIC. It presents the best result so far in
terms of eliminating mode I and II components and reducing the GIII
variation along the crack front. However, further improvement of the ERCT test is still possible by investigating the factors affecting the evolution of GIIIalong the crack front, conducting a sensitivity
study to experimental defaults, developing a more adequate closed-form expression for determining GIIICand improvement of
the testing device. Acknowledgements
This work is supported in part by the scholarship from China Scholarship Council (CSC) (2011623019).
References
[1] X.J. Gong, Rupture interlaminaire en mode mixte IþII de composites stratifies unidirectionnels et multidirectionnels Verre/Epoxy, Th"ese de doctorat, Uni-versit!e de Technologie de Compi"egne, 1992.
[2] X.J. Gong, M.L. Benzeggagh, in: R.H. Martin (Ed.), Mixed Mode Interlaminar Fracture Toughness of Unidirectional Glass/Epoxy Composite. Composite Materials: Fatigue and Fracture vol. 5, American Society for Testing and Ma-terials, Philadelphia, 1995, pp. 100e123. ASTM STP 1230.
[3] G. Becht, J.W. Gillespie Jr., Design and analysis of the crack rail shear specimen for mode III interlaminar fracture, Compos Sci. Technol. 31 (1988) 143e157. [4] S.L. Donaldson, Mode III intelaminar fracture characterization of composite
materials, Composs Sci. Technol. 32 (1988) 225e249.
[5] R.H. Martin, Evaluation of the split cantilever beam for mode III interlaminar delamination testing, in: T.K. O'Brien (Ed.), Composite Materials: Fatigue and Fracture vol. 3, ASTM STP 1110, Philadelphia, PA, 1991, pp. 243e266. [6] P. Robinson, D.Q. Song, The development of an improved mode III
delami-nation test for composites, Compos Sci. Technol. 52 (1994) 217e233. [7] F. Sharif, M.T. Kortschot, R.H. Martin, Mode III delamination using a split
cantilever beam, in: R.H. Martin (Ed.), Composite Materials: Fatigue and Fracture vol. 5, ASTM STP 1230, ASTM, Philadelphia, 1995, pp. 85e99. [8] A. Szekr!enyes, Delamination fracture analysis in the GII-GIII plane using
prestressed transparent composite beams, Int. J. Solids Struct. 44 (2007) 3359e3378.
[9] A. Szekr!enyes, Interlaminar fracture analysis in the GIeGIII plane using pre-stressed composite beams, Compos Part A 40 (2009) 1621e1631.
[10] A. Szekr!enyes, Improved analysis of the modified split-cantilever beam for mode-III fracture, Int. J. Mech. Sci. 51 (2009) 682e693.
[11] B.D. Davidson, F.O. Sediles, Mixed-mode IeIIeIII delamination toughness determination via a shearetorsionebending test, Compos Part A 42 (2011) 589e603.
[12] S.M. Lee, An edge crack torsion method for mode III delamination fracture testing, J. Compos Technol. Res. 15 (3) (1993) 193e201.
[13] J. Li, T.K. !OBrien, Simplified data reduction methods for the ECT test for mode III interlaminar fracture toughness, J. Compos Technol. Res. 18 (1996) 96e101. [14] W.C. Liao, C.T. Sun, The determination of mode III fracture toughness in thick
composite laminates, Compos Sci. Technol. 56 (1996) 489e499.
[15] J. Li, S.M. Lee, E.W. Lee, T.K. O'Brien, Evaluation of the edge crack torsion (ECT) test for mode III interlaminar fracture toughness of laminated composites, J. Compos Technol. Res. 19 (1997) 174e183.
[16] D. Zhao, Y. Wang, Mode III fracture behaviour of laminated composite with edge crack in torsion, Theor. Appl. Fract. Mech. 29 (1998) 109e123. [17] X. Li, L.A. Carlsson, P. Davies, Influence of fiber volume fraction on mode III
interlaminar fracture toughness of glass/epoxy composites, Compos Sci. Technol. 64 (2004) 1279e1286.
[18] J.G. Ratcliffe. Characterization of the edge crack torsion (ECT) test for mode III fracture toughness measurement of laminated composites. NASA/TM-2004e213269.
[19] D. Pennas, W.J. Cantwell, P. Compston, The influence of strain rate on the mode III interlaminar fracture of composite materials, J. Compos Mater 41 (2007) 2595e2614.
[20] D. Pennas, W.J. Cantwell, P. Compston, The influence of loading rate on the mode III fracture properties of adhesively bonded composites, J. Reinf. Plast. Compos 28 (2009) 1999e2012.
Table 4
Comparison of GIIICobtained from two mode III tests.
Type of test GIIIC-FEM(N/m) GIIIC-Tadaor GIIIC-CC(N/m) (GIIIC-Tadae GIIIC-FEM)/GIIIC-FEMor (GIIIC-CCe GIIIC-FEM)/GIIIC-FEM
ERCT (d ¼ 30 mm) 890 ± 32 910 ± 34 2.2%
ERCT (d ¼ 50 mm) 1173 ± 110 932 ± 11 20.5%
[21] R. Marat-Mendes, M. de Freitas, Characterisation of the edge crack torsion (ECT) test for the measurement of the mode III interlaminar fracture tough-ness, Eng. Fract. Mech. 76 (2009) 2799e2809.
[22] A.B. de Morais, A.B. Pereira, M.F.S.F. de Moura, A.G. Magalh~aes, Mode III interlaminar fracture of carbon/epoxy laminates using the edge crack torsion (ECT) test, Compos Sci. Technol. 69 (2009) 670e676.
[23] F.A. Mehrabadi, Analysis of pure mode III and mixed mode (III þ II) inter-laminar crack growth in polymeric woven fabrics, Mater Des. 44 (2013) 429e437.
[24] A.L. Horner a, M.W. Czabaj, B.D. Davidson, J.G. Ratcliffe, Three-dimensional crack surface evolution in mode III delamination toughness tests, Eng. Fract. Mech. 149 (2015) 313e325.
[25] H. Suemasu, An experimental method to measure the mode III interlaminar fracture toughness of composite laminates, Compos Sci. Technol. 59 (1999) 1015e1021.
[26] G. Browning, L.A. Carlsson, J.G. Ratcliffe, Redesign of the ECT test for mode III delamination testing. Part I:finite element analysis, J. Compos Mater 44 (2010) 1867e1881.
[27] A.B. de Morais, A.B. Pereira, Mixed mode II þ III interlaminar fracture of carbon/epoxy laminates, Compos Sci. Technol. 68 (2008) 2022e2027.
[28] A.B. Pereira, A.B. de Morais, Mixed mode I þ III interlaminar fracture of car-bon/epoxy laminates, Compos Part A 40 (2009) 518e523.
[29] A.B. de Morais, A.B. Pereira, Mode III interlaminar fracture of carbon/epoxy laminates using a four-point bending plate test, Compos Part A 40 (2009) 1741e1746.
[30] A.B. Pereira, A.B. de Morais, M.F.S.F. de Moura, Design and analysis of a new sixpoint edge crack torsion (6ECT) specimen for mode III interlaminar fracture characterisation, Compos Part A 42 (2011) 131e139.
[31] X.J. Gong, A. Hurez, Y.Y. Ge, L.L. Peng, E. De Luycker, Edge Ring Crack Torsion (ERCT) test for pure mode III toughness, in: Proceedings of the 19th Journ!ees Nationales sur les Composites (JNC/19), Villeurbanne, France, 29 Junee1, July 2015.
[32] E.F. Rybicki, M.F. Kanninen, A finite element calculation of stress intensity factors by a modified crack closure integral, Eng. Fract. Mech. 9 (1977) 931e938.
[33] R. Krueger. The virtual crack closure technique: history, approach and appli-cations. NASA/CR-2002e211628.
[34] H. Tada, P.C. Paris, G.R. Irwin, The stress analysis of cracks handbook, 1973. [35] J.M. Berthelot, Mat!eriaux composites: comportement m!ecanique et analyse