OATAO is an open access repository that collects the work of Toulouse
researchers and makes it freely available over the web where possible
Any correspondence concerning this service should be sent
to the repository administrator:
[email protected]
This is an author’s version published in:
https://oatao.univ-toulouse.fr/2
7146
To cite this version:
Carrère, Pierre and Prat, Marc Optimisation of gas access through a thin porous layer with a partially occluded inlet surface. (2020) Transport in Porous Media, 133. 49-69. ISSN 0169-3913 .
Official URL:
https://doi.org/10.1007/s11242-020-01413-0
channels. This direct contact area corresponds to the rib in Fig. 1. In Fig. 1, the width of the rib Lr is on the order of a few millimetres, whereas the thicknesses δCL and δGDL of the CL and the GDL are on the order of a few tens of microns and a few hundreds of microns, respectively. Thus, there is about one order of magnitude difference between the two thick-nesses. The length of the diffusion path to reach the region below the rib is ~ Lr/2, whereas the length of the diffusion path to reach the CL from the channel in the absence of GDL can be roughly estimated as δCL/2. In the presence of the GDL, the diffusion path length in direction of the rib centre is about the same, whereas the direct diffusion path from the channel to the CL is now δGDL. As a result, the ratio between the lateral (from channel to rib centre) diffusion path length and the direct (straight from channel to CL) diffusion path length is about 100 in the absence of GDL and 10 in the presence of the GDL. This is a quite significant difference. Based on these estimates, it is clear from Fig. 1 that the presence of the GDL must improve the gas access to the CL in the region below the rib compared to the situation without GDL where the CL would be in direct contact with the bipolar plate. In the latter situation, since the CL thickness is about two orders of magni-tude smaller than the rib width, one suspects that the region of the CL right below the rib is likely to be a dead region because of the much longer diffusion path from the channels to reach the reactive sites in the CL. Nevertheless, since the GDL thickness is about one order of magnitude smaller that the rib width, the gas access to the CL is clearly easier for the region of the CL below the channel than for the region below the rib. In other words, even in the presence of the GDL, the diffusion paths are still significantly longer for the region of the CL located below the rib.
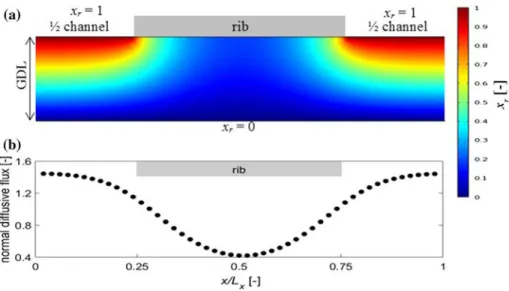
This is illustrated in Fig. 2 from the solution of the stationary two-dimensional diffu-sion problem over the domain depicted in Fig. 2. To this end, we have solved the follow-ing problem over the GDL domain usfollow-ing the commercial simulation software COMSOL Multiphysics
where Deff is the GDL effective diffusion coefficient and xr is the reactant gas molar frac-tion with the following boundary condifrac-tions: (1) the molar fracfrac-tion of the reactant gas is xr= 1 at the GDL–channel interface, (2) the molar fraction is xr= 0 at the GDL–CL inter-face, (3) a zero flux condition is imposed at the GDL–rib interinter-face, (4) spatially periodic boundary conditions are imposed on the right and left sides in Fig. 2. The molar fraction field obtained for a spatially uniform effective diffusion coefficient is shown in Fig. 2a, whereas the normal diffusive flux along the GDL–CL interface is plotted in Fig. 2b. As can be seen, the diffusive flux distribution is not uniform with a minimum right below the centre of the rib and a maximum below the centre of the channel.
(1) ∇ ⋅(Deff∇xr
) = 0
Fig. 1 Illustration of the bipolar plate—gas diffusion layer—cata-lyst layer assembly
On the basis of this illustrative result, the question arises as to whether it is possible to design the GDL so to obtain a more uniform flux along the GDL–CL interface. Due to the CL fabrication process, e.g. (Santangelo et al. 2019), the costly catalyst particles are dis-tributed all over the CL. The idea is thus to define a design where the reactive sites in the CL would be more uniformly fed in reactant gas so as to optimise the use of the catalyst particles. Naturally, making the flux more uniform should not reduce the overall flux. This additional constraint is taken into account in the optimisation process leading to a more uniform flux. Actually, one can argue that optimising the overall flux should lead to better overall PEMFC performances than simply making the flux more spatially uniform. The study does not provide an answer to this question. However, we believe that the method presented in the study to optimise the flux spatial distribution can be useful to optimise the design of porous structures in general. The question of the GDL optimisation is further discussed in the discussion section.
This problem, i.e. the search of a GDL design improving the gas access, is studied in what follows from numerical simulations combining an optimisation method based on a genetic algorithm (Eshelman and Schaffer 1993; Kramer 2017; Spears et al. 1993; Unsal et al. 2005) and pore network models (PNM), a somewhat popular technique for the model-ling of transfers in GDL, e.g. (Carrere and Prat 2019a; Ceballos and Prat 2010; Fazeli et al.
2015, 2016; Gostick 2013; Gostick et al. 2007; Hinebaugh and Bazylak 2010; Hinebaugh et al. 2010; Kuttanikkad et al. 2011; Lee et al. 2009, 2010, 2014; Luo et al. 2010; Medici and Allen 2010; Médici and Allen 2013; Qin 2015; Qin et al. 2016; Rebai and Prat 2009; Sinha et al. 2007; Straubhaar et al. 2016; Wu et al. 2010a, b, c, 2013). We begin with a dry GDL. In terms of PEMFC operating regimes (Carrere and Prat 2019a, b), this case corre-sponds to a regime of sufficiently low current density and channel relative humidity for the water produced in the CL to be transferred through the GDL in vapour phase without con-densation. However, when these conditions are not met, liquid water is present in the GDL and one can wonder whether the optimal design for a dry GDL is still a good design in the presence of liquid water. This point is also studied in the paper.
Fig. 2 a Reactant gas molar fraction field in an isotropic GDL, b outward normal diffusive flux along the
The paper is organised as follows: the PNM is briefly described in Sect. 2 with the opti-misation method. Results for a dry GDL are presented in Sect. 3. The impact of the optimi-sation on gas access in wet GDLs is discussed in Sect. 4. A short discussion is presented in Sect. 5. Conclusions are drawn in Sect. 6.
2 Optimisation of a Dry GDL
The idea is to modify the GDL microstructure, i.e. actually the throat size spatial distribu-tion, in order to improve the reactant gas access in the region located below the rib. The objective of the optimisation is to distribute the reactant gas outward diffusive flux as uni-formly as possible over the GDL–CL interface while maintaining the overall mass flow rate crossing the entire interface.
2.1 Problem Formulation
Computations are performed over the GDL domain illustrated in Fig. 1 limited on top by a central rib of width Lr= 1 mm surrounded by two half channels of width Lc= 0.5Lr . The GDL thickness 𝛿 is equal to 200 μm . These values are representative of GDLs (Park et al.
2012). As mentioned in introduction, we consider a stationary diffusion problem with the same boundary conditions (molar fraction equal to xr= 1 at the GDL–channel interface, molar fraction equal to xr= 0 at the GDL–CL interface, zero flux boundary condition at the GDL–rib interface, spatially periodic boundary conditions along the lateral sides of the domain).
The simulation of the diffusive transport is performed using a 3D cubic pore network model (PNM). The pores are cubes evenly spaced. The lattice spacing, i.e. the distance between two neighbour pores, is a = 40 μm in each direction. The throats between adjacent pores are channels of square cross section. The size of the throat is randomly distributed in the range [dmin, dmax] according to a uniform p.d.f. (probability density function). The size of a pore is the maximum throat size among the throats adjacent to the pore. There are Nx pores in the main in-plane direction, i.e. along the channel and rib (x direction in Fig. 1), Nz pores in the through-plane direction and Ny pores in the remaining in-plane direction parallel to the channels. Unless otherwise mentioned, Nx= 50 , Ny= 3, Nz = 5. Within the framework of the PNM approach, the solution of the diffusion transport is obtained from the following mass balance at each node (pore) i of the network:
where xri and xrj are the molar fraction in pores i and j and gi,j is the diffusive conductance
between pores i and j defined as
where di,j is the throat width, c is the gas mixture molar density and D is the diffusion
molecular coefficient.
It can be argued that the pore and throat size distributions in GDLs are not uniform but rather Weibull or log-normal distributions, e.g. (Gostick et al. 2007; Gostick 2013).We (2) n ∑ i=1 gi,j ( xri− xrj ) = 0 (3) gi,j= cDd2 i,j a
have used an uniform distribution simply because we have used the same PNM as in (Car-rere and Prat 2019a) where such a distribution was used. In another work (unpublished) combining PNM and an optimisation procedure similar to the one used in the present work, different types of distributions have been considered. The conclusion was that the type of the distribution has little impact, if any, on the efficiency of the optimisation procedure. 2.2 Optimisation Method
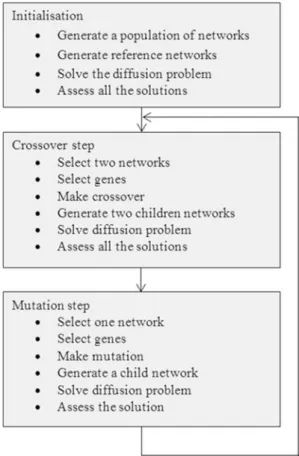
A genetic algorithm is used to optimise the GDL, that is, to spatialise the throat size dis-tribution in the network so as to best satisfy two criteria as explained in what follows. The main steps of the algorithm are summarised in the flowchart shown in Fig. 3 and described below.
Initialisation A population of Nn networks is generated. We took Nn= 10 . Each
net-work is different from each other, i.e. corresponds actually to a realisation of the random process consisting in distributing randomly the throat sizes according to a given prob-ability density function (p.d.f.). A network is defined by its throat size distribution in each direction. Thus, each network is defined by 3 × Nx× Ny× Nz parameters. Within
the framework of genetic algorithms (Kramer 2017; Unsal et al. 2005), these parameters correspond to genes. The networks are generated respecting the parameters of a refer-ence geometry. The latter is the one used in (Carrere and Prat 2019a). It corresponds to
Fig. 3 Flowchart of the genetic algorithm for the optimisation of the dry GDL
a moderately anisotropic GDL with compression effect below the rib. The throat sizes are randomly chosen following uniform distribution laws between d⊥,min and d⊥,max
for the throats in the through-plane direction (z) and d∕∕,min and d∕∕,max for the throats in the in-plane directions (x and y). The used values are indicated in Table 1. Also Nref reference networks are generated. In our computations, Nref = 20.
Select networks For the crossover step, two networks among the population of networks are randomly selected. They are called parent networks #1 and #2. For the mutation step, one network among the population of networks is randomly selected. It is called parent network. Note that the mutation step occurs after the crossover step (Fig. 3).
Select genes A number of crossover genes Nc or to be mutated Nm are randomly
cho-sen. Nc and Nm could vary from 1 to 3 ∗ Nx∗ Ny∗ Nz which is the number of genes of
each network (3 throats at each of the Nx∗ Ny∗ Nz nodes of the network). Numerical
tests have shown that the procedure was computationally much faster when a low num-ber of crossover genes were considered. In the simulations, no more than 2% of the genes are exchanged or mutated at the same time.
Make crossover The crossover step consists in creating two child networks (#1 and #2) from the two parent networks (#1 and #2) by exchanging the genes selected in previ-ous steps. The genes of child network #1 are the genes of parent network #1 that have not been chosen to be exchanged combined with the genes of parent network #2 that have been chosen to be exchanged. In a similar way, child network #2 is generated.
Make mutation The mutation step consists in creating a child network which will be a mutation of the parent network. For every gene that has been chosen to be mutated, a new value of throat diameter is randomly chosen in the range [ dmin , dmax ]. Unless oth-erwise mentioned, dmin = 10 μm and dmax = 30 μm (knowing that the lattice spacing is a= 40 μm).
Assess the solutions (optimisation criteria) The goal of the optimisation is to homog-enise the flux in reactant gas over the GDL–CL interface. In the optimisation procedure, this amounts to minimising the standard deviation of the outward mass flow rate distri-bution over the GDL–CL interface, which is expressed as
where q(i, j) is the mass flow rate through the (i,j) interfacial throat, i.e. a throat connecting the network to the GDL–CL interface, and the bar indicates the average over the Nx × Ny
throats connected to the GDL–CL interface. The aim of the genetic algorithm is to merge solutions with lower and lower standard deviations.
While homogenising the mass flow rates over the GDL–CL interface, it is of course desirable that the overall flow mass rate qtot=∑ ∑q(i, j) crossing the GDL–CL inter-face be equal or greater than the reference value qtot,ref computed for the reference net-works during the initialisation step.qtot,ref is the average value over the Nref reference networks.
Therefore, the two criteria for selecting a new solution are:
(4) 𝜎(q) =
√ ̄ q2− ( ̄q)2
Table 1 Throat size distribution (TSD) lower and upper bounds (μm) of the reference networks
d⊥,min d⊥,max d∕∕,min d∕∕,max
• the standard deviation is lower than the higher one among the current networks of the population: 𝜎(q) ≤ max(𝜎p(q)|p ∈
[ 1, Nn]).
• the overall mass flow rate of the assessed network is higher or equal to the reference value: qtot≥qtot,ref.
If a child network respects these two criteria, the child network is selected and replaces the network in the population with the highest standard deviation.
End: The procedure is stopped when the standard deviation has decreased enough and reaches for a sufficient long time a plateau.
3 Results (Dry GDL)
3.1 Calibration of the Genetic Algorithm
Several choices are possible as regards the genetic algorithm. We briefly discuss the impact of some of them in this subsection. First, we have tested whether using the standard devia-tion alone, i.e. σ, or the standard deviadevia-tion normalised by the average, i.e. 𝜎(q)
̄
q , had an
impact on the computational time and the results. No noticeable impact has been found. Therefore, we have used the standard deviation and not the normalised standard deviation to characterise the mass flow rate homogenisation in the computations. Then, we have compared the results of the optimisation procedure when the two optimisation criteria (homogenisation of the mass flow rate and overall mass flow rate greater or equal to the reference overall mass flow rate qtot,ref ) were enforced and when only the first one (minimi-sation of the standard deviation, no constraint on the overall mass flow rate) was enforced.
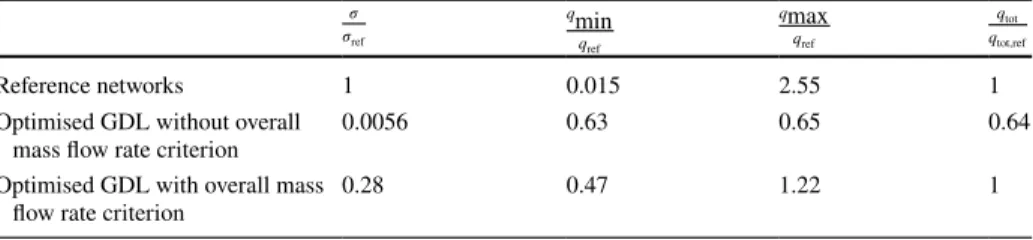
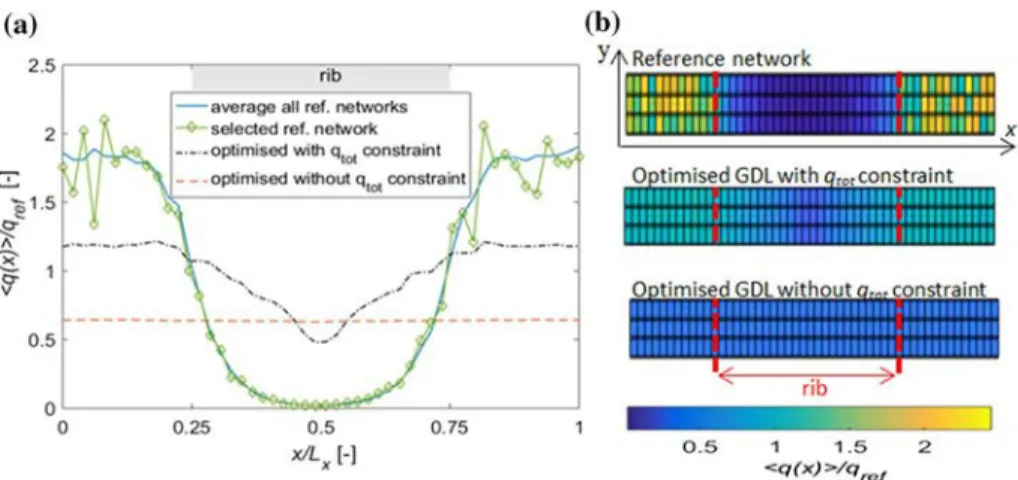
The values of the standard deviation, the minimum and the maximum flow rates and the overall mass flow rates are given in Table 2 for the reference networks, the optimised GDL without constraint on the overall mass flow rate and the optimised GDL with both criteria. The outward mass flow rate distribution over the GDL–CL interface is plotted for each GDL in Fig. 4. The results for the reference network in Fig. 4 correspond to one network among the Nref reference networks. Figure 4 highlights the significant impact of the central rib on the mass flow rate distribution over the GDL–CL interface for the non-optimised reference GDL. This impact is significantly reduced when the GDL is optimised with both
Table 2 Standard deviation, minimum and maximum mass flow rates and overall mass flow rate for the ref-erence networks, the optimised GDL obtained without constraint on the overall mass flow rate and the opti-mised GDL obtained with both optimisation criteria; qtot,ref = 2.95 × 10⁻⁹ mol/s is the overall mass flow rate for the reference networks (average value over the Nref reference networks), qref = qtot ref
NxNy = 1.96 × 10
−11 mol/s is the average mass flow rate per interfacial throats, 𝜎ref = 1.60 × 10⁻¹¹ mol/s is the average standard deviation of the local mass flow rate distribution over the Nref reference networks. For the reference networks, qmin and qmax are averages over the Nref reference networks
𝜎 𝜎ref q min qref qmax qref qtot qtot,ref Reference networks 1 0.015 2.55 1
Optimised GDL without overall
mass flow rate criterion 0.0056 0.63 0.65 0.64
Optimised GDL with overall mass
optimisation criteria and almost disappears when the optimisation is performed without the constraint on the overall mass flow rate. When the latter is not enforced, significantly lower standard deviation values are obtained. The standard deviation is about 3,5 times smaller than that for the reference GDLs when both criteria are enforced, whereas σ is about 178 times smaller than that for the reference GDL when the constraint on the overall mass flow rate is not enforced. However, not imposing the constraint on the overall mass flow rate leads to a solution where the overall mass flow rate is about 35% smaller than the refer-ence value. Nevertheless, in the application, it is important that all the regions of the CL be sufficiently feed in reactant gas so that as much catalyst particles as possible are active. In other words, a more homogeneous distribution of the mass flow rate even with a (slightly) lower overall mass flow rate could be an efficient trade-off. This will be further illustrated later in the article.
Figure 4 also illustrates a compensation mechanism. In the non-optimised GDL, the greater mass flow rate over the region of the GDL–CL interface below the channel com-pensates the lower mass flow rate below the rib compared to the optimised GDL so that the overall mass flow rate is similar in both GDLs.
3.2 Dry GDL Optimal Design
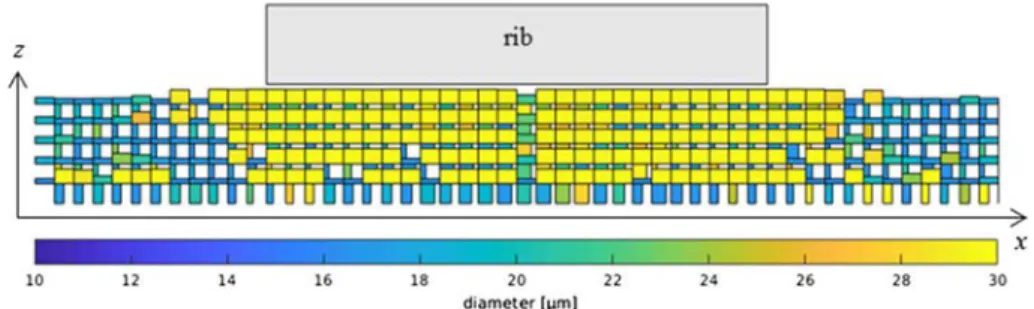
Based on the results presented in Sect. 3.1, the GDL microstructure has been optimised using both criteria, i.e. the minimisation of the standard deviation σ and the constraint on the overall mass flow rate. Figure 5 shows the x-throat and z-throat size distribution for the optimised GDL in the network central layer in the y-direction. Most of the x-throats are big and close to dmax below the rib while they are quite significantly smaller below the channel. A somewhat unexpected result is that the x-throats located below the centre of the rib are quite small compared to the other x-throats below the rib. This creates a kind of
Fig. 4 a Reactant gas mass flow rate (average in the y-direction, i.e. over the vertical direction in the colour
maps shown on the right) distribution along the GDL–CL interface for a non-optimised reference network, the optimised GDL with the two optimisation criteria both applied and the optimised GDL without enforce-ment of the constraint on the overall mass flow rate. The distribution averaged over the Nref reference net-works is also shown and indicates that the selected reference network is representative; b colour maps showing the local mass flow rate distribution over the GDL–CL interface for different cases; the mass flow rate is normalised by qref = qNtot,refxNy
barrier below the centre of the rib. This is a consequence of the geometry central symme-try. The flow rates are optimised on each side of the symmetry, and a barrier in the axis of symmetry is generated. In terms of design, this can be considered as an artefact. Imposing in this row of x-throats, the average size of the two adjacent x-throats would be more con-sistent. Also, it is clear from Fig. 5 that it would be sufficient to perform the optimisation only over half of the domain illustrated in Fig. 5 because of the symmetry. The z-throats are smaller below the channel. This makes the through-plane transport more difficult and consequently favours the redirection of the mass fluxes in the x-direction especially below the rib where the x-throats are bigger. The z-throats become bigger and bigger from the channels to the centre of the rib so that the through-plane transport is favoured below the rib compared to the regions below the channels. Finally, it can be noticed that the z-throats located in the first layer, i.e. at the GDL–CL interface, are bigger than the z-throats in the upper layers. This is a consequence of the definition of the mass flow rate at the GDL–CL interface which depends on the z-throat sizes at the GDL–CL interface (it is proportional to the square of the considered z-throat size).
The optimal network so obtained leads to the porosity distribution illustrated in Fig. 6. This porosity is a local porosity computed over cubes of size a (a is the lattice spacing, i.e. the distance between two adjacent pores) centred on the pores. This porosity is of course not a converged porosity in the sense of the continuum approach to porous media since the averaging volume is here much smaller than a traditional representative elementary volume (REV). The porosity varies from 0.46 to 0.94. The porosity is minimum in the upper layers below the centre of the channels, whereas it is maximum in the central region
Fig. 5 Optimal distributions of x-throat and z-throat sizes in the central layer in the y-direction. The pores are not represented
below the rib. The mean porosity of current commercial GDLs can vary from 0.64 to 0.88, e.g. (Zenyuk et al. 2016). Variations in GDL porosity with compression are presented in (Zenyuk et al. 2016). The porosity decreases when the GDL is compressed. In assembled fuel cells, this means that the porosity should be smaller below the rib region than below the channel region as the compression is mainly applied by the rib. As a consequence, the porosity below the channel is higher than below the rib for a current commercial GDL in a fuel cell. Strikingly, this is the opposite of the optimal porosity field illustrated in Fig. 6. 3.3 Discussion
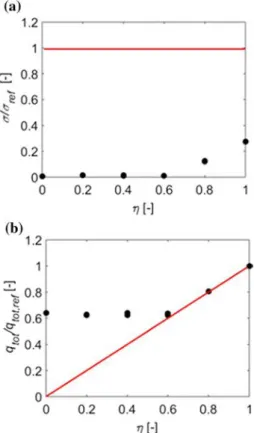
As briefly discussed in Sect. 3.1, it might be interesting to use a less strict criterion for the overall mass flow rate so as to improve the uniformity of the mass flow rate distribu-tion over the GDL–CL interface without affecting too much the overall mass flow rate. To explore this point, computations were performed with the criterion: qtot > 𝜂qtot,ref with 𝜂∈ [0, 0.2, 0.4, 0.6, 0.8, 1] . The mass flow rate standard deviation σ obtained for each value of η is plotted in Fig. 7a. The value is normalised by the reference value 𝜎ref obtained for the reference networks (average standard deviation for the Nref reference networks). The corresponding overall mass flow rates are plotted in Fig. 7b. The red line in Fig. 7b cor-responds to 𝜂qtot,ref.
As can be seen, σ is significantly reduced compared to its initial reference value for the lower values of η up to η = 0.6, whereas the mass flux rate homogenisation is less effective
Fig. 7 a Normalised mass
flow rate standard deviation obtained for the optimised GDL for various values of η (the red line corresponds to the average standard deviation for the non-optimised reference networks), b normalised outward overall mass flow rate crossing the GDL–CL interface for the optimised solution for various values of η (the red line corresponds to the minimum overall mass flow rate imposed for each computation, i.e. η qtot,ref)
for η = 0.8 and η = 1. However, it can be seen that the overall mass flow rate of the opti-mised solution qtot is significantly higher than the imposed criterion 𝜂qtot,ref for the lower values of η up to η = 0.4. This indicates that it is not necessary to decrease too much the required minimum overall mass flow rate 𝜂qtot,ref to obtain a good homogenisation of the mass flow rate over the GDL–CL interface.
4 Impact of Microstructure Optimisation on Gas Access in Wet GDLs
As mentioned in introduction, the cathode GDL is dry only for sufficiently low current densities and relative humidities in the channel. Actually the fuel cell often operates under conditions leading to the occurrence of liquid water (Carrere and Prat 2019a, b). Therefore, the question arises as to whether the optimal design for a dry GDL is still a good design for a wet GDL. To this end, comparisons are performed between the optimised GDL and a non-optimised GDL, i.e. a reference GDL arbitrarily selected among the Nref reference networks, as regards the liquid water distribution and the reactant gas access. Note that the optimised GDL is the one obtained with both optimisation criteria enforced and η = 1.
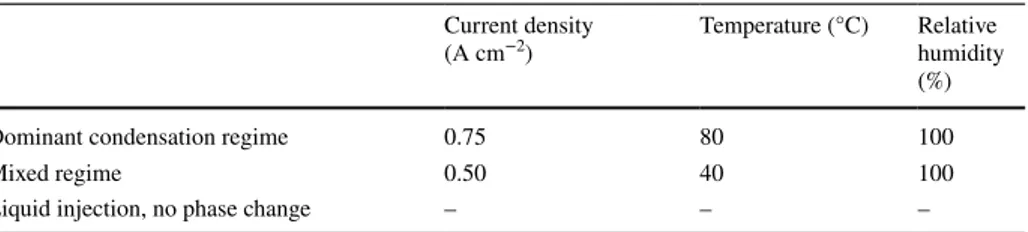
This comparison implies to consider different wet regimes. Two main regimes of liquid water formation in GDL are distinguished (Carrere and Prat 2019b), namely the dominant condensation regime and the mixed regime. In the dominant condensation regime, water enters in vapour form through the GDL–CL interface and condenses in the GDL colder regions, i.e. below the rib. The mixed regime refers to the situation where both condensa-tion and liquid water intrusion through the GDL–CL interface contribute to the presence of liquid water in the GDL. Both regimes can be simulated using the mixed injection pore network model (MIPNM) presented in (Carrere and Prat 2019a) considering various oper-ating conditions. The operoper-ating conditions considered for the present study leading to the two regimes are given in Table 3. In addition, simulations of pure liquid injection with no phase change have been performed. As pointed out in (Carrere and Prat 2019a), this type of simulations is by far the one considered in the majority of previous works using PNM to simulate the water intrusion in GDL. For this reason, this “regime” has also been simulated. Based on the works presented in (Carrere and Prat 2019b), it can be considered as a fair approximation for some operating conditions but is also a very poor model for other conditions, especially those corresponding to the dominant condensation regime. The use of the MIPNM is recommended since it is actually difficult to anticipate the condi-tions for which the simpler pure liquid invasion PNM leads to not too bad results. When water enters in liquid form into the GDL at the GDL–CL interface, a certain fraction α of the throats connecting the GDL to the CL are invaded by liquid water. This fraction is actually a parameter in the PNMs, i.e. the MIPNM or the simpler PNM used to simulate the pure liquid injection case. As discussed in (Carrere and Prat 2019a, b), α = 20% is a
Table 3 Various operating conditions for the wet GDL simulations Current density
(A cm−2) Temperature (°C) Relative humidity
(%)
Dominant condensation regime 0.75 80 100
Mixed regime 0.50 40 100
reasonable value based on comparisons between simulations and experimental water distri-butions. For this reason, α is set to 20%. This means that 20% of the throats in the layer of interfacial throats connecting the GDL to the CL are possible liquid injection points at the beginning of the simulation. In the mixed regime, the effective number of liquid injection points when the steady state is reached can be actually less than this value (in the iterative procedure leading to the steady-state solution, some of the initially liquid injection throats can become vapour injection throats). Thus, in this case, 20% is the maximum fraction of liquid injection throats. In the pure liquid injection regime, there is no possible change in the status of the injection points, i.e. the fraction of injection throats at the GDL–CL inter-face is 20%. One can refer to (Carrere and Prat 2019a) for more details. It should be noted that modifying the microstructure should have an impact of the heat transfer since the local porosity distribution is different in the optimised GDL and the non-optimised GDL. This impact has been neglected in what follows on the ground that this should not change the main features of the liquid water distribution corresponding to each regime.
4.1 Liquid Water Distribution in Optimised and Non‑optimised GDLs
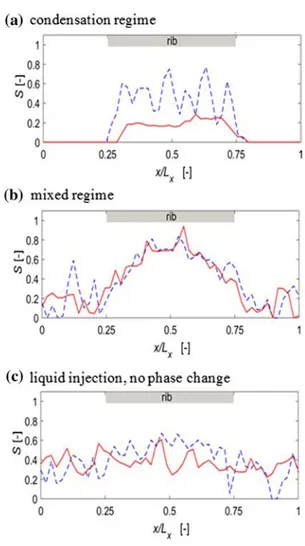
The liquid water distributions for various cases indicated in Table 3 and the two GDLs are depicted in Fig. 8. The corresponding saturation profiles are shown in Fig. 9.
In the dominant condensation regime, condensation first happens in the layer of pores located right under the rib. Then, the transport in liquid water below the rib in the non-optimised GDL is favoured in the through-plane direction (this is because in the hydropho-bic GDL, invasion preferentially occurs in the larger throats). As depicted in Fig. 8a1, this leads to invasion in all the pore layers below the rib until the condensation–evaporation
Fig. 8 Liquid water (in blue) distributions for various wet regimes in the non-optimised reference GDL and the optimised GDL
equilibrium is reached. By contrast, invasion of elements in the in-plane direction is favoured in the optimised GDL (Fig. 8a2) as the z-throats are smaller than the x-throats and y-throats. The condensation–evaporation equilibrium is rapidly reached after the first nucleation step, and only a few elements of the networks are invaded. Consequently, the saturation in the optimised GDL is significantly lower than that in the non-optimised GDL. This is also well illustrated by the saturation profiles depicted in Fig. 9a (see also Table 4 in the next section).
For the mixed regime, the liquid water presence results from both liquid water intrusion at the GDL–CL interface and condensation in the colder regions of the GDL, i.e. below the rib. In contrast to the condensation regime, this regime is characterised by the pres-ence of liquid water both in the regions below the rib and below the channels (Fig. 8). As can be seen from Figs. 8b1, 2, there are some differences in the liquid water distributions between the two GDLs. The more favourable liquid water invasion along the through-plane direction in the non-optimised GDL results in the merging of the liquid clusters resulting from the liquid injection with the main condensation cluster forming below the rib. As shown in Fig. 8b1, this leads to the presence of liquid water in all the layers of the GDL
Fig. 9 Saturation profiles for various wet regimes for the non-optimised reference GDL (dashed blue line) and the opti-mised GDL (solid red line)
both below the rib and below the channels. By contrast, the more favourable liquid water invasion along the in-plane direction below the rib results in comparatively less invasion in the pores next to the GDL–CL interface in the region below the rib in the optimised GDL. Below the channel, this leads to the presence of liquid clusters in the first two pore layers of the GDL only. However, as shown in Fig. 9, this difference does not lead to significant dif-ference in the saturation profiles. This is also confirmed by the saturation values reported in Table 4.
As depicted in Fig. 8c, the distributions obtained with the pure liquid injection with no phase change PNM are closer to those of the mixed regime but with noticeable differences. First, it can be seen that the non-optimised GDL is more flooded than the optimised GDL in the region below the rib. In particular, the top pore layers in this region contain much less liquid water than in the non-optimised GDL. Again, this is due to the fact that the opti-mised geometry favours in-plane invasion while the non-optiopti-mised geometry favours inva-sion in the through-plane direction. This is also illustrated by the saturation profiles plotted in Fig. 9c. As can be seen from Table 4, the saturation in this regime is greater below the rib in the non-optimised GDL, whereas this is opposite as regards the saturation below the channel.
In summary, there is less liquid water in the optimised GDL compared to the non-optimised GDL only for the condensation regime, whereas the saturation is comparable between the two GDLs for the two other regimes. This impact of the liquid water presence on the reactant gas transfer is discussed in the next section.
4.2 Reactant Gas Transfer in GDLs Containing Liquid Water
Once the liquid water distribution is determined, it is interesting to assess the reactant gas transfer by solving the diffusion problem previously presented in the partially liquid satu-rated GDLs. It could be assumed a priori that the presence of less liquid water in the opti-mised GDL compared to the non-optiopti-mised GDL in the condensation regime should lead to an improved reactant gas transfer in the optimised GDL. However, this is not necessarily that simple. It was pointed out in (García-Salaberri et al. 2015) that the reactant gas trans-fer is highly liquid water distribution dependent and that the simple knowledge of the over-all saturation is generover-ally not sufficient to characterise the reactant gas access to the CL.
Table 4 Overall mass flow rate for various regimes and the reference and optimised GDLs
qtotnodry = 2.88 × 10⁻⁹ (mol/s) is the overall mass flow rate for the non-optimised GDL in the dry regime. S is
the overall saturation in the GDL. Srib is the saturation in the GDL region below the rib. Sch is the saturation
in the GDL region below the two half channels
Non-optimised GDL Optimised GDL qtot qtotnodry S Srib Sch qtot qtotnodry S Srib Sch Dry regime 1 0 0 0 1.02 0 0 0
Dominant condensation regime 0.94 0.22 0.47 0.005 0.97 0.11 0.18 0.006
Mixed regime 0.52 0.39 0.59 0.19 0.62 0.41 0.60 0.16
The PNM procedure to compute the reactant gas diffusive transfer through the GDL in the presence of liquid water is very similar to that for a dry GDL (Sect. 2.1). The additional feature is to take into account the presence of liquid water in some throats and pores. The presence of liquid water in an element of the network affects the reactant gas diffusion transport into this element until no diffusion can happen once the element is fully filled with liquid water. The diffusive conductance in a wet throat is computed using the follow-ing relationships: • gi,j= cDd2 i,j a [
1− S(i, j)] (where S(i,j) is the water saturation in the throat between pores i and j) if neither the throat between pores i and j, neither pore i, neither pore j is com-pletely filled.
• gi,j= 0 if at least one of the three connected elements (the throat between pores i and j or the pore i or the pore j) is completely filled by liquid water.
The overall mass flow rate so obtained for various cases is presented in Table 4 together with the overall saturation in the GDL, and below the rib or below the two half channels.
As shown in Table 4, the impact of the liquid water presence on the overall mass flow rate is highly dependent on the regime. In the condensation regime, this impact is weak and the overall mass flow rate is comparable to that for a dry GDL. The difference between the optimised GDL and non-optimised GDL is small, but the overall mass flow rate is slightly greater with the optimised GDL. As shown in Fig. 8a and indicated by the very low values of Sch in Table 4 for this regime, this weak impact of the liquid presence in this regime is due to the fact that the region below the channel is almost perfectly dry. By contrast, the overall mass flow rate is about half the one for the dry GDL in the mixed regime but slightly greater in the optimised GDL. The reduction compared to the dry GDL is still more severe in the liquid injection regime. This is due to the presence of water in the region below the channel, which is highly sensitive as regards the gas access owing to its smaller diffusion path. In accordance with the discussion in (García-Salaberri et al. 2015), Table 4
shows that the overall liquid water saturation is not sufficient to predict the degradation of the reactant gas transfer due to the liquid water presence. For instance, one can see that the overall saturation is about the same in the mixed regime and the liquid injection regime, whereas the overall mass flow rate is significantly less in the liquid injection regime. Thus, more detailed information of the liquid water distribution is necessary to explain the differ-ence in the overall mass flow rate between these two regimes.
The fact that the overall mass flow rate is significantly lower in the liquid injection regime compared to the mixed regime (Table 4) can be related to the degree of presence of liquid water in the row of pores next to the GDL–CL interface. This information is reported in Table 5. As can be seen from Table 5, there are significantly more liquid pores in this layer of pores in the liquid injection regime compared to the mixed regime and thus more pores blocking the reactant gas transfer. In other words, the partial
Table 5 Fraction of dry pores in the first row of pores next to the GDL–CL interface
Density of dry pores at the BC
Non-opti-mised GDL Optimised GDL
Dry regime 1 1
Dominant condensation regime 0.88 1
Mixed regime 0.62 0.53
flooding of the first layer of pores degrades significantly the reactant gas transfer. Also, one can see that the enhanced in-plane liquid invasion in the optimised GDL leads to the invasion of more pores in this first row. Although the fraction of injection throats is the same (20%), the preferential in-plane invasion in the optimised GDL eventually leads to more liquid saturated or partially liquid saturated pores in the first row of pores next to the GDL–CL interface. Interestingly, one can see that this first layer of pore is dry in the optimised GDL in the condensation regime, whereas some of them are with liquid water in the non-optimised GDL.
Table 6 presents the normalised standard deviation of the mass flow rate distribution over the GDL–CL interface. In the case of the wet regimes, the standard deviation is computed only over the dry throats connecting the GDL to the CL.
Here again, it can be seen that the situation is highly dependent on the regime. The standard deviation is comparable to that of the dry non-optimised GDL in the condensa-tion regime for both the optimised and non-optimised GDLs. In this respect, the occur-rence of liquid water removes the benefit of the optimisation in terms of homogenisation of the local mass flow rate (note that the standard deviation in the optimised dry GDL is about a quarter of that for the non-optimised GDL). This can be understood since the presence of liquid water in the region below the rib in this regime is equivalent to reduce the “effective” porosity (defined as the volume fraction of the medium occupied by the gas phase) in this region, which is the region where the porosity was increased as a result of the optimisation procedure (Fig. 6). The situation is less good for the two other wet regimes. The standard deviation is significantly greater compared to the dry GDLs and smaller in the non-optimised GDL compared to the optimised GDL.
More details on the mass flow rate distributions over the GDL–CL interface are shown in Fig. 10. First, the presence of liquid water below the rib for all regimes is sufficient to remove the benefit of the optimisation in this region since the local mass flow rate is quite low over the corresponding region of the GDL–CL interface, even lower than for the non-optimised dry GDL (Fig. 10a). Then, this figure well illustrates the impact of the liquid water presence in the region below the channel (the two half channels in Fig. 10) for the mixed regime and the liquid injection regime. The local reactant gas mass flow rate is clearly smaller on average in this region for these two regimes compared to the condensation regime where this region is dry. The colour maps (Fig. 10b) well illustrate the greater fluctuations for these two regimes consistently with the values of the standard deviation reported in Table 6.
Also, Fig. 10 illustrates the compensation mechanism in the condensation regime already observed between the optimised GDL and non-optimised dry GDL leading to a comparable value of the overall mass flow rate. In the condensation regime, the greater mass flow rate over the region of the GDL–CL interface below the channel compensates the lower mass flow rate below the rib compared to the dry optimised GDL so that the overall mass flow rate is similar to the one in the dry GDLs.
Table 6 Standard deviation of the mass flow rate distribution over the GDL–CL interface for various regimes and the reference and optimised GDLs;𝜎refnodry
qref = 0.81
is the standard deviation for the non-optimised dry GDL.
qref = qtotnodry
NxNy = 1.93 × 10
−11 (mol/s)
𝜎
𝜎refnodry Non-opti-mised GDL Optimised GDL
Dry regime 1 0.28
Dominant condensation regime 1.06 1.01
Mixed regime 1.31 1.57
5 Discussion
We have shown that the GDL microstructure could be optimised so as to make the O2 flux more uniform over the CL while maintaining an overall flux comparable to the one for the non-optimised reference GDL. The idea was simply to ensure a more uniform feeding of the catalyst particles. Actually, we have not proved that making the flux more uniform improves the fuel cell performance. A much more comprehensive model ena-bling one to compute the fuel cell polarisation curve would be necessary to confirm or not that this is a fully relevant optimisation criterion. The objective was much more lim-ited in scope and simply to present a method enabling one to optimise the GDL micro-structure. Also, the obtained results raise a series of questions. The first one is of course the fabrication of such an optimised GDL. For instance, it is not at all obvious to region-alise the GDL properties and then to proceed such that the GDL with spatially variable properties is correctly aligned with the ribs and channels.
Fig. 10 a Reactant gas mass flow rate distribution along the GDL–CL interface in the dry regime, the
domi-nant condensation regime, the mixed regime and with the pure liquid injection with no phase change model for the reference GDL and the optimised GDL (the reactant gas flow rate corresponds here to the average mass flow rate in the y direction, i.e. the vertical direction in b Reactant gas mass flow rate distribution over the GDL–CL interface for various cases
However, the GDL fabrication techniques can be expected to be improved so as to fab-ricate more challenging design. For instance, it is now possible to fabfab-ricate GDL with a through-plane porosity gradient (Balakrishnan et al. 2020). Thus, fabricating the design proposed in the present article will be perhaps possible in the near future.
In the mean time, a more realistic suggestion inspired from the present work could be simply to make the GDL more rigid so as to limit the presumably detrimental compres-sion effect under the rib. Thus, another view would be not to try to fabricate the optimised microstructure but rather to take into account the conclusions of the optimisation proce-dure in a different way. Since the optimisation was based on the observation that the in-plane diffusion path below the rib was significantly longer than the through-in-plane diffusion path between the channels and the CL, a different view is to reduce the in-plane diffusion path. This could be achieved by reducing the channel and rib size. This is actually a current trend which is indirectly consistent with the results presented in the present article.
6 Conclusions
We have studied numerically the gas access by Fickian diffusion through a thin porous layer with a partially occluded inlet surface in relation to the oxygen transfer in the PEMFC cathode gas diffusion layer (GDL). The main idea was to improve the GDL design so as to homogenise the reactant gas outward mass flow rate over the GDL exit surface (the surface in contact with the MPL or the CL in PEMFC) while keeping the overall mass flow rate comparable to that of the reference non-optimised GDL. To this end, we have combined pore network simulations and an optimisation procedure based on a genetic algorithm.
In the case of a dry GDL, the optimisation procedure leads to a design where the longer diffusion path to reach the region below the rib is compensated by a lower diffusive resist-ance in this region. In short, the porosity must be greater in the region below the rib com-pared to the region below the channel so as to enhance the in-plane gas transfer between the region below the channel and the region below the rib. In the current PEMFC situa-tion, the uncompressed GDL is of uniform porosity. As the result of the GDL compression below the rib, the porosity of the GDL in situ is lower below the rib, which is exactly the opposite of the optimised design. This somewhat paradoxical situation suggests that there are significant possibilities for improving the fuel cell performance through a more uniform gas access to the catalyst particles via modifications of the GDL design, at least in the dry regime. Also, the study suggests that a more uniform gas distribution can be obtained if one accepts to reduce a bit the overall mass flow rate. This might be a good solution in order to optimise the use of the costly catalyst particles in the CL since the latter are dis-tributed all over the CL independently of the position of the ribs and channels.
Since the GDL is often wet in an operating fuel cell, the impact of the presence of liquid water on the optimised GDL has been assessed from comparisons with a non-optimised reference GDL. This comparison has implied to consider various wet regimes occurring in the GDL depending on the fuel cell operating conditions. The overall liquid water satura-tion in the GDL is less in the optimised GDL compared to the non-optimised GDL (con-densation regime) or similar (mixed regime and liquid injection regime). However, glob-ally, the presence of liquid water in the region below the rib removes the benefit of the optimisation because the partial occupation of this region by liquid water is equivalent to reduce the porosity effectively accessible to the reactant gas. As the result, the local mass
flow rate distribution over the GDL–CL interface in a wet GDL is much less uniform than for the optimised dry GDL.
As pointed out in previous works, our results confirm that the overall saturation is not a relevant indicator for the reactant gas transfer. The liquid distribution must be characterised in more details to assess the impact of liquid water on the gas access.
The impact of liquid water is quite different depending on the regimes. In the regimes where liquid water is confined in the region below the rib, i.e. in the condensation regime, the reactant gas overall mass flow rate is not really affected compared the dry GDL. This is because the much smaller local mass flow rates below the rib due the presence of liquid water are compensated by a higher mass flow rate in the region of the GDL–CL interface below the channel compared to the optimised dry GDL. Consistently, the impact on the gas access is much greater when liquid water is present also below the channel. The latter has a detrimental effect with a significantly reduced overall mass flow rate compared to the refer-ence dry GDL.
Finally, it should be noted that the situation in a fuel cell can be more complicated than considered in this paper owing to the coupling with the electrical transport, at least in the wet case. As discussed in (Belgacem et al. 2018), the current density over the GDL–CL interface can vary spatially. According to (Belgacem et al. 2018), this leads to a lower local current below the rib in the condensation regime compared to the region below the chan-nel. This effect has not been taken into account. Also, the electrical conductivity should be less good below the rib in the optimised GDL compared to that of the non-optimised one since the porosity is greater in this region in the optimised GDL. More generally, the fact that making the oxygen access more uniform improves the fuel cell performance remains to be shown. In other words, a more comprehensive optimisation study should also consider the impact of the microstructure changes on the heat and electrical transfers and enable one to determine the impact of the GDL microstructure optimisation on the fuel cell polarisa-tion curve. Nevertheless, we hope that the present work is a valuable step in this direcpolarisa-tion.
Acknowledgements This research was supported by the Project “PEMFC – SUDOE” – SOE1/P1/E0293 which is co-financed by the European Regional Development Fund in the framework of the Interreg Sudoe programme.
References
Balakrishnan, M., Shrestha, P., Ge, N., Lee, C.H, Fahy, K.F., Zeis, R., Schulz, V.P., Hatton, B.D. Bazy-lak, A.: Electrospinning for polymer electrolyte membrane fuel cells. ACS Appl. Energy Mater. (Accepted for publication) (2020)
Belgacem, N., Pauchet, J., Prat, M.: On the current distribution at the channel—rib scale in polymer-electrolyte fuel cells. Int. J. Hydrog. Energy 43, 5112–5123 (2018)
Carrere, P., Prat, M.: Liquid water in cathode gas diffusion layers of PEM fuel cells: identification of various pore filling regimes from pore network simulations. Int. J. Heat Mass Transf. 129, 1043– 1056 (2019a)
Carrere, P., Prat, M.: Corrigendum to “Liquid water in cathode gas diffusion layers of PEM fuel cells: identification of various pore filling regimes from pore network simulations”. Int. J. Heat Mass Transf. 137, 1323–1325 (2019b)
Ceballos, L., Prat, M.: Invasion percolation with inlet multiple injections and the water management problem in proton exchange membrane fuel cells. J. Power Sources 195, 825–828 (2010)
Eshelman, L.J., Schaffer, J.D.: Real-coded genetic algorithms and interval-schemata. In: Whitley, L.D. (ed.) Foundations of Genetic Algorithms, pp. 187–202. Elsevier, New York (1993)
Fazeli, M., Hinebaugh, J., Bazylak, A.: Investigating inlet condition effects on PEMFC GDL liquid water transport through pore network modeling. J. Electrochem. Soc. 162, F661–F668 (2015)
Fazeli, M., Hinebaugh, J., Fishman, Z., Tötzke, C., Lehnert, W., Manke, I., Bazylak, A.: Pore network modeling to explore the effects of compression on multiphase transport in polymer electrolyte membrane fuel cell gas diffusion layers. J. Power Sources 335, 162–171 (2016)
García-Salaberri, P.A., Hwang, G., Vera, M., Weber, A.Z., Gostick, J.T.: Effective diffusivity in par-tially-saturated carbon-fiber gas diffusion layers: effect of through-plane saturation distribution. Int. J. Heat Mass Transf. 86, 319–333 (2015)
Gostick, J.T.: Random pore network modeling of fibrous PEMFC gas diffusion media using voronoi and delaunay tessellations. J. Electrochem. Soc. 160, F731–F743 (2013)
Gostick, J.T., Ioannidis, M.A., Fowler, M.W., Pritzker, M.D.: Pore network modeling of fibrous gas dif-fusion layers for polymer electrolyte membrane fuel cells. J. Power Sources 173, 277–290 (2007) Hinebaugh, J., Bazylak, A.: Condensation in PEM fuel cell gas diffusion layers: a pore network
mod-eling approach. J. Electrochem. Soc. 157, B1382–B1390 (2010)
Hinebaugh, J., Fishman, Z., Bazylak, A.: Unstructured pore network modeling with heterogeneous PEMFC GDL porosity distributions. J. Electrochem. Soc. 157, B1651 (2010)
Kramer, O.: Genetic algorithm essentials. Springer, Berlin (2017)
Kuttanikkad, S.P., Prat, M., Pauchet, J.: Pore-network simulations of two-phase flow in a thin porous layer of mixed wettability: application to water transport in gas diffusion layers of proton exchange membrane fuel cells. J. Power Sources 196, 1145–1155 (2011)
Lee, K.-J., Nam, J.H., Kim, C.-J.: Pore-network analysis of two-phase water transport in gas diffusion layers of polymer electrolyte membrane fuel cells. Electrochim. Acta 54, 1166–1176 (2009) Lee, K.-J., Nam, J.H., Kim, C.-J.: Steady saturation distribution in hydrophobic gas-diffusion layers of
polymer electrolyte membrane fuel cells: a pore-network study. J. Power Sources 195, 130–141 (2010)
Lee, K.-J., Kang, J.H., Nam, J.H.: Liquid water distribution in hydrophobic gas-diffusion layers with interconnect rib geometry: an invasion-percolation pore network analysis. Int. J. Hydrog. Energy
39, 6646–6656 (2014)
Luo, G., Ji, Y., Wang, C.-Y., Sinha, P.K.: Modeling liquid water transport in gas diffusion layers by topo-logically equivalent pore network. Electrochim. Acta 55, 5332–5341 (2010)
Medici, E.F., Allen, J.S.: The effects of morphological and wetting properties of porous transport layers on water movement in PEM fuel cells. J. Electrochem. Soc. 157, B1505–B1514 (2010)
Médici, E.F., Allen, J.S.: Vaporation, two phase flow, and thermal transport in porous media with appli-cation to low-temperature fuel cells. Int. J. Heat Mass Transf. 65, 779–788 (2013)
Park, S., Lee, J.-W., Popov, B.N.: A review of gas diffusion layer in PEM fuel cells: materials and designs. Int. J. Hydrog. Energy 37, 5850–5865 (2012)
Qin, C.: Water transport in the gas diffusion layer of a polymer electrolyte fuel cell: dynamic pore-network modeling. J. Electrochem. Soc. 162, F1036–F1046 (2015)
Qin, C.-Z., Hassanizadeh, S., Van Oosterhout, L.: Pore-network modeling of water and vapor transport in the micro porous layer and gas diffusion layer of a polymer electrolyte fuel cell. Computation 4, 21 (2016)
Rebai, M., Prat, M.: Scale effect and two-phase flow in a thin hydrophobic porous layer: application to water transport in gas diffusion layers of proton exchange membrane fuel cells. J. Power Sources
192, 534–543 (2009)
Santangelo, P.E., Cannio, M., Romagnoli, M.: Review of catalyst-deposition techniques for PEMFC electrodes. Tecnica Italiana-Italian J. Eng. Sci. 63, 65 (2019)
Sinha, P.K., Mukherjee, P.P., Wang, C.-Y.: Impact of GDL structure and wettability on water manage-ment in polymer electrolyte fuel cells. J. Mater. Chem. 17, 3089 (2007)
Spears, W.M., De Jong, K.A., Bäck, T., Fogel, D.B., de Garis, H.: An overview of evolutionary compu-tation. In: Brazdil, P.B. (ed.) Machine Learning: ECML-93, pp. 442–459. Springer, Berlin (1993) Straubhaar, B., Pauchet, J., Prat, M.: Pore network modelling of condensation in gas diffusion layers of
proton exchange membrane fuel cells. Int. J. Heat Mass Transf. 102, 891–901 (2016)
Unsal, E., Dane, J.H., Dozier, G.V.: A genetic algorithm for predicting pore geometry based on air per-meability measurements. Vadose Zone J. 4, 389–397 (2005)
Wu, R., Zhu, X., Liao, Q., Wang, H., Ding, Y., Li, J., Ye, D.: A pore network study on water distribution in bi-layer gas diffusion media: effects of inlet boundary condition and micro-porous layer proper-ties. Int. J. Hydrog. Energy 35, 9134–9143 (2010a)
Wu, R., Zhu, X., Liao, Q., Wang, H., Ding, Y., Li, J., Ye, D.: A pore network study on the role of micro-porous layer in control of liquid water distribution in gas diffusion layer. Int. J. Hydrog. Energy 35, 7588–7593 (2010b)
Wu, R., Zhu, X., Liao, Q., Wang, H., Ding, Y., Li, J., Ye, D.: Determination of oxygen effective diffusiv-ity in porous gas diffusion layer using a three-dimensional pore network model. Electrochim. Acta
55, 7394–7403 (2010c)
Wu, R., Zhu, X., Liao, Q., Chen, R., Cui, G.-M.: Liquid and oxygen transport in defective bilayer gas dif-fusion material of proton exchange membrane fuel cell. Int. J. Hydrog. Energy 38, 4067–4078 (2013) Zenyuk, I.V., Parkinson, D.Y., Connolly, L.G., Weber, A.Z.: Gas-diffusion-layer structural properties under
compression via X-ray tomography. J. Power Sources 328, 364–376 (2016)
Publisher’s Note Springer Nature remains neutral with regard to jurisdictional claims in published maps and institutional affiliations.