HAL Id: hal-01608961
https://hal.archives-ouvertes.fr/hal-01608961
Submitted on 9 Oct 2017
HAL is a multi-disciplinary open access
archive for the deposit and dissemination of sci-entific research documents, whether they are pub-lished or not. The documents may come from teaching and research institutions in France or abroad, or from public or private research centers.
L’archive ouverte pluridisciplinaire HAL, est destinée au dépôt et à la diffusion de documents scientifiques de niveau recherche, publiés ou non, émanant des établissements d’enseignement et de recherche français ou étrangers, des laboratoires publics ou privés.
Characterization of Water Gradients in Concrete by
Complementary NDT Methods
Géraldine Villain, Zoubir Medhi Sbartaï, Jean-François Lataste, Vincent
Garnier, Xavier Dérobert, Odile Abraham, Stéphanie Bonnet, Jean-Paul
Balayssac, Ngoc Tan Nguyen, Milia Fares
To cite this version:
Géraldine Villain, Zoubir Medhi Sbartaï, Jean-François Lataste, Vincent Garnier, Xavier Dérobert, et al.. Characterization of Water Gradients in Concrete by Complementary NDT Methods. Interna-tional Symposium Non-Destructive Testing in Civil Engineering (NDT-CE 2015), Sep 2015, BERLIN, Germany. 12p. �hal-01608961�
Characterization of Water Gradients in Concrete
by Complementary NDT Methods
Géraldine VILLAIN1, Z. Mehdi SBARTAÏ2, Jean-François LATASTE2, Vincent GARNIER3, Xavier DÉROBERT1, Odile ABRAHAM1, Stéphanie BONNET4, Jean-Paul
BALAYSSAC5, Ngoc Tan NGUYEN2, Milia FARES1
1
LUNAM Université, IFSTTAR, Centre de Nantes, Route de Bouaye, CS4, 44 344 Bouguenais, France [email protected], [email protected], [email protected], [email protected]
2
University of Bordeaux, I2M, Bât A11, 351 Cours de la libération, 33405 Talence, France [email protected], [email protected], [email protected]
3
Aix Marseille Université, LMA, LCND, IUT Aix en Provence, 13100 Aix en Provence, France [email protected]
4
LUNAM Université, GeM, IUT département Génie Civil, rue Michel Ange, 44606 Saint-Nazaire, France [email protected]
5
Université de Toulouse, UPS, INSA; LMDC;135, avenue de Rangueil, 31077 Toulouse Cedex 4, France [email protected]
Abstract
Several NDT methods (ultrasonic surface waves, capacitive method, ground penetrating radar and electrical resistivity probes or tomography (ERT)) were used in similar conditions for the evaluation of the moisture gradients inside concrete. After a long exposure in laboratory conditions to obtain a stabilization of the hygrometry, one face of the tested concrete slabs is put in contact with water. By capillary absorption, water penetrates gradually, and at different time intervals of the process, NDT measurements are performed both on the opposite face and on the face in contact with water. This protocol allows the formation of different water gradient profiles in the concrete slabs during water absorption. At each measurement step, the water gradient profiles are controlled by embedded relative humidity sensors but also by gammadensimetry on a specific sample. The results show that the embedded sensors are able to monitor the water front evolution during water absorption. Phase velocity of ultrasonic surface waves, even-though not significantly affected by moisture variations, can follow up relative modifications within the first concrete centimeters. GPR, electrical resistivity and capacitive measurements are sensitive to the evolution of the water front during absorption. Finally, the ERT provides interesting results for the monitoring of the water front.
Keywords
Water content, degree of saturation, gradient, surface waves, capacitive probes, ground penetrating radar (GPR), electrical resistivity tomography
1 Introduction
Evaluating the concrete water content is highly important to predict the evolution of degradations such as carbonation, chloride ingress or alkali-silica reactions and to estimate the potential durability of reinforced concrete structures [1]. Former research projects [2], showed that non-destructive testing (NDT) measurements are sensitive to moisture and that the NDT results can be related to the saturation degree of concrete slabs in homogeneous moisture conditions. Therefore, cover concrete of existing structures is characterized by its gradual properties such as porosity, water content, aggregate size… In the frame of the French collaborative research project ANR-EvaDéOS, it was thus decided to focus on gradient evaluation and to begin with characterization of moisture gradients by NDT methods.
The aim of this paper is to monitor the penetration of water by capillary absorption in dry concrete slabs, using complementary NDT methods. This complementarity is an important criterion in order to be able to combine them in the future and determine in the same time several durability indicators (strength, porosity, saturation degree or chloride content) [3, 4].
In this paper, the experimental procedure, to dry the concrete slabs and make water penetrate into them, then for NDT measurements, is detailed first. Second, the evolution of moisture gradient is monitored and controlled by embedded thermo-hygrometric probes in concrete and gammadensimetry on cores taken from similar slabs. Third, the NDT results are presented and analyzed to characterize the water ingress front or to evaluate their sensitivity as function of depth.
2 Description of the experimental study
2.1 Experimental campaign
In 2013, the concrete C1 (mix design in Table 1) was cast to make 6 concrete slabs devoted to ND testing, 2 others devoted to coring and cylindrical samples for strength characterization. The slab dimensions are 600x250x150 mm. At one end, 5 reservations per slab were drilled in a lateral face to place the thermo-hygrometric (THR) probes (∅ 10 mm) at 15, 25, 40, 60 and 120 mm from the surface that would be plunged into water. The remaining holes were sealed with silicon paste and the lateral faces were sealed using adhesive aluminum foils. Then, the slabs were sent to 5 labs situated in different towns in France, 3 slabs for Labs 1 and 5, 1 slab per lab for Labs 2, 3 and 4. After a first imbibition campaign, which enabled to improve the procedure reproduction and the measurement accuracy, the slabs were dried in an oven at 40°C during 7 days then wrapped in watertight plastic bags and kept in these conditions during 2 months minimum (depending on the lab) for homogenizing the water content. The second campaign protocol could begin.
Then, at time t0, one face is placed in water (height about equal to 10 mm). The NDT measurements are performed at t0 + ½, 1, 2, 4 and 8 hours, then the slabs are wrapped in the plastic bags during the night to continue the imbibition process in the following morning at
t0 + 8’, 12, (32), 50 or 56, (92) and 128 hours. There are only slight discrepancies in the
testing times between the different Labs.
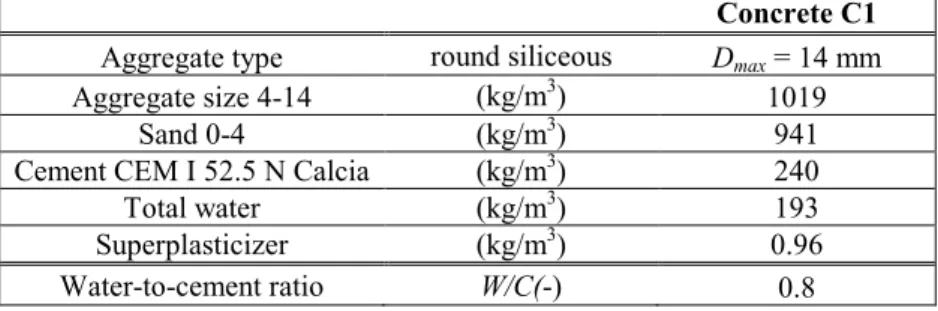
Table 1. Concrete mix design and properties in saturated conditions (sat) Concrete C1
Aggregate type round siliceous Dmax = 14 mm
Aggregate size 4-14 (kg/m3) 1019
Sand 0-4 (kg/m3) 941
Cement CEM I 52.5 N Calcia (kg/m3) 240
Total water (kg/m3) 193
Superplasticizer (kg/m3) 0.96
Water-to-cement ratio W/C(-) 0.8
2.2 Concrete characterization and methods used to control slab conditions
The mechanical properties as well as durability indicators (porosity and permeability) of concrete C1 were measured by destructive testing in laboratory.
3 cylindrical specimens of length 22 cm and diameter 11 cm were tested under uniaxial compression to get the ultimate strength and the static Young's modulus measured at 28 days. 3 cylindrical specimens of length 5 cm and diameter 11 cm were vacuum saturated in order to determine the apparent mean density and the water porosity.
The concrete permeability was measured using two different devices: the Cembureau system and the Torrent device.
The Cembureau system is a constant head permeameter and nitrogen gas is used as the permeating medium. Concrete cylinders of length 5 cm and diameter 11 cm were sealed with two epoxy resin coats in order to ensure one-dimensional gas through the discs. In this study, the specimens are oven-dried at 105°C to constant weight and each disc was tested with a pressure of 0.5 bars. The volume flow rate through the specimens is measured by means of a soap bubble flow meter. The apparent coefficient of permeability kA (m²) is calculated from the Hagen-Poiseuille expression for laminar flow of a compressible fluid through a porous body under steady state conditions [5].
The Torrent measuring device was developed in order to measure, in a non-destructive manner, the coefficient of permeability of the surface layer of concrete on site or, in our case, in the laboratory [6]. The device is combined with a vacuum pump; it is equipped with an interface recording the pressure evolution. The coefficient of permeability kT is then automatically calculated. Measurement lasts between 2 and 12 minutes depending on the permeability and the saturation degree of concrete [7]. The measurements were done on different slabs of concrete C1 for two concrete saturation degrees: for S = 35%, the 3 slabs devoted to the gradient experiment (resistivity from Lab 5: GeM) and, for the dry conditions, two other slabs were used.
The mean values are given in Table 2. The differences are explained by the different specimens and the different moisture conditions. Moreover, in dry conditions, the Cembureau and Torrent permeabilities are measured in either steady or transient flow conditions.
Table 2. Concrete mix design and properties in different moisture conditions
28 days Compressive Strength (MPa) 28 days Static Young's modulus (GPa) Apparent sat. mean density (kg/m3) Open porosity (water saturation) (%) Cembureau permeability (10-16 m²) dried slabs Torrent permeability (10-16 m²) dried slabs Torrent permeability (10-16 m²) S = 35% 21.5±1 24.9±0.04 2405±8 18.3±0.3 7.71 18 0.337±0.055
Two methods are considered as reference methods to monitor the water penetration.
•In each concrete slab, 5 Honeywell thermohygrometric THR probes are embedded at 5 depths. The evolution of relative humidity (RH) profiles is followed during imbibition process. Besides, the isothermal properties in adsorption and desorption of concrete C1 were measured and fitted for calculating the profiles of saturation degree [8]
•The principle of gammadensimetry is based on the absorption by matter of gamma-ray emitted by a radioactive source of cesium. The more humid is concrete, the more gamma-ray is absorbed. Thus, by difference with saturated and dry conditions of the same specimen, the degree of saturation and the water content of concrete at several depths can by monitored during drying or imbibition processes [9].
2.3 Non-destructive testing methods
Several NDT methods based on ultrasonic (US) and electromagnetic (EM) wave propagation and electric diffusion were used to monitor water penetration.
•Concerning US surface waves, a dedicated homemade dry contact multi-element US probe was used to measure the coherent surface wave-field (obtained by averaging 25 shots). The spacing between the 40 receivers is 5 mm and the source central frequency is 100 kHz [10]. The surface wave phase velocity dispersion curve is computed by a p-ω transform [11, 12] and the phase velocities (Vϕλ=2-6cm) at wave-lengths λ = 2,3,4,5,6 cm (after averaging over a length range of ± 5 mm) are extracted from the dispersion curve (the larger the wave-length the deeper the information).
•The US waves transmitted through the concrete specimen interact with a lot of aggregates. The multiple scattered waves contribute to the energy distribution in the space. One part is redirected backward and allows the recording backscattered waves built from all the contributions generated by each scatterer. This type of measurement is very easy to do. It consists in sending a wave from a transducer and receiving the US backscattered waves with the same transducer. A transducer with a double piezo (one emitter and one receiver) with 1 MHz central frequency is used. The signal is processed to get only the non-coherent part of the wave from which the dissipation coefficient σ is extracted [13].
•The radar systems employed, are a SIR3000 at IFSTTAR or a SIR20 at LMDC, both manufactured by GSSI. In each case, the antennas used are provided by GSSI, one antenna with a center frequency in air at 1.5 GHz for LMDC, and two antennas at 2.6 GHz frequency for IFSTTAR. In the last case, the measurements are performed using variable offsets (distance transmitter-receiver), ranging from about 9 to 20 cm. The largest offsets enable to discriminate the direct wave in the medium from the direct air wave. In this study, only the direct wave in concrete is studied either by its variation of velocity (IFSTTAR) or by means amplitude changes (normalized amplitude) [14-17].
•The capacitive technique exploits the measure of the capacitance value from electrodes laid on the concrete surface in order to obtain the real part of the relative permittivity (called here permittivity) of concrete, at a frequency roughly equal to 33 MHz. Three different sizes of electrodes are used, large GE, medium ME and small size PE to investigate different depths from the surface, around 50 mm, 11 mm and 5 mm respectively [14].
For measuring the concrete apparent resistivity, 3 different types of devices were used.
•Two different Wenner probes are used in two laboratories (GeM and LMDC) on different concrete slabs. The probe is equipped with four electrodes distanced of 4 cm. Two electrodes deliver an electrical current with a constant intensity and the two others measure the difference of potential between each side of the point measured. Before measuring the electrical resistivity, it is important to humidify the four foam contacts placed on the end of each electrode to allow an electrical contact with the concrete. The apparent resistivity is calculated by applying a geometrical factor on the electrical resistance value [17, 18].
•I2M performs measurement with a four probes device (called quadrupole) with a square section of 5 cm between probes. With the same data analysis than for the Wenner probes, both devices lead to very close results [18]. The main difference stays in the geometrical coefficient and their investigation volumes that are slightly different.
•The electrical resistivity tomography (ERT) is a more complete device composed of 14 electrodes (IFSTTAR) or 16 ones (I2M) on line, which enable varying the electrode spacing a like 2, 4, 6 or 8 cm [19]. Formally the principle of the measurement is similar to the one used for the Wenner probes. It allows a more complete description of material properties thanks to a higher number of measurements on the surface and integrating several depths of investigation [19-21].
3 Evolution of gradients determined by the control methods
3.1 THR embedded probes
The THR embedded probes enable to monitor the progression of the water penetration front during the imbibition process. The relative humidity (RH) is obtained after a calibration and transformed into degree of saturation by using the adsorption isotherms of concrete C1. Figure 1 shows an example of the results for 2 laboratories, in fact, with the slowest (Lab 1,
IFSTTAR) and the most rapid (Lab 4, I2M) kinetics. The kinetics differences can be due to the slab material difference and the disturbance of the probe calibration by the silicon paste. Some probes inside the material give a RH much higher than 100%, that can be corrected if the probe calibration is performed after the imbibition process. Nevertheless, it can be noted that the initial saturation degree S (at t0) is similar for the 5 labs, S between 33.8 and 36.4%.
The slab core seems to be slightly more humid than the faces (more visible with RH).
20 30 40 50 60 70 80 90 100 0 50 100 150 Depth (mm) D e g re e o f s a tu ra ti o n S ( % ) . t0 t0 + 2h t0 + 4h t0 + 8h t0 + 12h t0 + 32h t0 + 56h t0 + 128h a) 20 30 40 50 60 70 80 90 100 0 50 100 150 Depth (mm) D e g re e o f s a tu ra ti o n S ( % ) t0 t0 + 2h t0 + 24h t0 + 50h t0 + 92h b)
Figure 1. Profiles of saturation degree obtained with THR probes in 2 different labs – a) Lab 1 – b) Lab 4
3.2 Gammadensimetry
The gammadensimetry also enables to monitor the progression of the water penetration front during the imbibition process but on a special cored specimen. It can be noticed that, during the night in the plastic bag, water is moving: drying on the humid face and penetrating deeper. Meanwhile, at t0+14h, the water front finds its shape again.
30 40 50 60 70 80 90 0 50 100 150 Depth (mm) D e g re e o f s a tu ra ti o n S (% ) . t0 t0 + 2h t0 + 4h t0 + 8h t0+8h (night) t0 + 14h t0 + 32h t0 + 128h
Figure 2. Profiles of saturation degree obtained with gammadensimetry
3.3 Comparison and analysis of the results
The results obtained by the 2 reference methods can be compared. The initial saturation degree in the cored specimen (t0 in Fig. 2) is higher than the one of the slabs and is not
homogeneous because the drying process of the core does not correspond, it had a shorter duration that the slab's one. This test has to be performed again according to the protocol of the second campaign on another core.
Besides, the progression kinetics observed for gammadensimetry is similar to the average penetration registered by the THR probes in the 4 labs. It enables to position the water front.
The maximal degree of saturation reached in the core (gamma) and in the slab (THR) is different because of the methods. For gamma method, the saturated density is measured after a vacuum saturation so the pores are full of water whereas after 5 days of imbibition (t0+128h) all the pores seem not. For embedded probes, RH is measured and is equal to 100% as soon as the pressure of saturating vapor is reached in the surrounding space of the probe.
4 NDT evaluation of water ingress
For each NDT method, the evolution of the ND variables versus time is shown in the following figures by zooming on the first 18 hours when the penetration is more rapid.
4.1 US backscattered waves
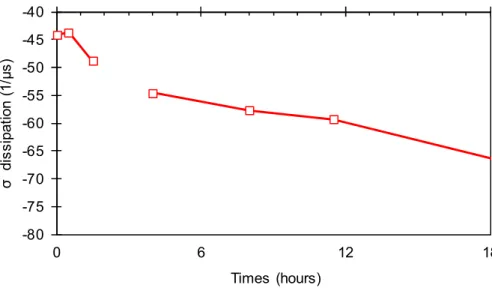
Figure 3 shows the decrease of the dissipation coefficient of backscattered US waves when water penetrates into concrete. This variable is sensitive because it is multiplied by 1.5 in 18 hours. As dissipation is primarily related to cement paste properties [13], its decrease can be explained by the increase of the moisture in the pores, thus of the degree of saturation.
-80 -75 -70 -65 -60 -55 -50 -45 -40 0 6 12 18 σ d is s ip a tio n ( 1 /µ s ) Times (hours)
Figure 3. Evolution of dissipation coefficient as function of imbibition time
4.2 US surface waves
The variation of surface wave phase velocities Vϕλ=2-6cm on the dry face (Fig. 4b) are within the precision range of the method, nonetheless some relevant patterns can be observed: first, at t0, Vϕλ=2-6cm are slightly higher that their counterpart on the wet face indicating a gradient within the slab; second, velocities are stable with time and show a gradient of mechanical properties (velocity increase with depth) due to a skin effect and diffusion on the aggregates [10].
Vϕλ=2-6cm on the wet face vary (Fig. 4a) with the water ingress in the material. As expected, starting from low saturation levels up to full saturation, the velocity should decrease and then
increase [22], in particular for the shortest wave-lengths. Vϕλ=2-5cm, as water penetrates into concrete, tend to converge towards a common value making possible the monitoring of concrete saturation in level (increase of water content) as well as in depth (propagation of the water front). As the corresponding surface wave investigation depth is around 2.5 cm, it can be deduced that, after around 14 hours, the water saturation level is almost homogeneous within this thickness.
2300 2320 2340 2360 2380 2400 2420 0 6 12 18 S W P h a s e v e lo c it y (m /s ) Time (hours) lambda=2cm lambda=3cm lambda=4cm lambda=5cm lambda=6cm a) 2300 2320 2340 2360 2380 2400 2420 0 6 12 18 S W P h a s e v e lo c it y (m /s ) Time (hours) lambda=6cm lambda=5cm lambda=4cm lambda=3cm lambda=2cm b)
Figure 4. Evolution of US surface wave phase velocity Vϕλ=2,6cm vs. time with several integrating values corresponding to wavelengths equal to λ = 2, 3, 4 5 and 6 cm (mean value and standard deviation on 3 slabs)
– a) From the slab wet face – b) From the slab dry face
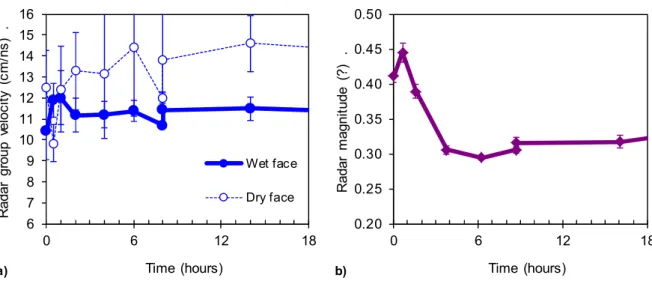
4.3 Radar CMP 6 7 8 9 10 11 12 13 14 15 16 0 6 12 18 R a d a r g ro u p v e lo c it y ( c m /n s ) . Time (hours) Wet face Dry face a) 0.20 0.25 0.30 0.35 0.40 0.45 0.50 0 6 12 18 R a d a r m a g n it u d e (? ) . Time (hours) b)
Figure 5. Evolution of radar EM wave parameters vs. time – a) Group velocity measured from the wet and
dry faces (Lab 1) – b) Signal magnitude measured from the wet face (Lab 2)
GPR velocity results, in Fig. 5a, appear to be noisy from one slab to another. After a strong variation during the first hour from radar wave interferences due to waveguide effect, the averaged tendency shows a stabilization of the velocity for the wet face. On the contrary, on the dry face, the radar velocities increase slightly as if the side continued to dry during the experiment.
Figure 5b represents the variation of the amplitude of direct wave versus time obtained on the wet face only. The amplitude of direct wave measured on the material is normalized to the amplitude measured in the air. As for velocity measurements, the amplitude measured on dry face showed no variation during the absorption process. The amplitude measured on the wet face is globally decreasing with time due to the moisture penetration and so to the increase of volume water content in the porosity. A singular phenomenon is observed during the first time of absorption where we can clearly observe an increase of attenuation after the first hour of absorption. This phenomenon is also observed for the velocity measurement (Fig 5a). Then, after a significant decrease, the attenuation is stabilized after about 4 hours of absorption. This increase could be explained as a waveguide effect with interference phenomena, due to the narrow thickness (~2 cm) of the saturated layer. This effect decreases and becomes negligible compared to the direct wave as the water front progresses and the thickness of the saturated material increases.
4.4 Capacitive probes 0 2 4 6 8 10 12 14 16 18 20 0 6 12 18 Time (hours) P e rm it ti v it y b y C a p a ( -)
PE wet face ME wet face GE wet face
GE dry face ME dry face PE dry face
Figure 6. Evolution of capacitive probe permittivity vs. time taken from both the wet and dry faces of the
concrete slabs with PE, ME and GE electrodes (mean value and standard deviation on 3 slabs) Figure 6 shows the evolution of permittivity measured by capacitive probes with different size electrodes. At t0, the material near both faces (about 10 mm) is more dry than the deeper material because the average permittivity of PE and ME is lower (between 6 and 8) than the permittivity of GE (between 8 and 10) as confirmed by THR probes. Then, during the imbibition process, the permittivity of the PE placed on the wet face increases rapidly and stabilized after 2 hours, which corresponds to a water front at 5 mm. The permittivity of the other electrodes increases more slowly (ME and GE from the wet face) until the front reaches their respective depth penetration. Besides, the modification of the water distribution during the night in the plastic bag is clearly visible at t0+8h from PE: the wet face concrete dries and the dry one gets more humid. The inversion of these results to obtain a gradient of permittivity then of saturation degree is proposed by [21].
4.5 Resistivity Wenner probes and multi-electrode ERT
Regarding Wenner probes, the resistivity measurements were only carried out on the wet surface because they were impossible on the dry one. Figure 7 shows that the results obtained
in the LMDC and GeM laboratories using the same device are quite similar even if both concrete slabs and measurements conditions were different, in GeM the room temperature was controlled at 20°C. The result obtained in the I2M laboratory using the square probe, shows difference for the first hours of immersion, then leads to very similar ranges and evolutions in time, for resistivity. It highlights a difference in the initial condition of the cover concrete between the slabs tested in the three laboratories. Regarding the evolution after 4 hours, the material could nevertheless be considered as similar for each laboratory. In a general way, the resistivity decreases with increasing water penetration. The stabilization of the resistivity appears after about 16 hours of absorption, later than for the other techniques (GPR or US surface waves). It can thus be assumed that the moisture evolution is beyond the investigated depth, which could be estimated between 2 and 4 cm, corresponding to a/2 and a (i.e. the spacing between electrodes).
50 100 150 200 250 300 350 400 450 0 6 12 18 A p p a re n t re s is ti vi ty ( Ω .m ) Time (hours) Wenner 4 cm - LMDC - avril 2014 ERT a=4cm - IFSTTAR - janv. 2014 Wenner 4cm - GEM - janv. 2015 Quadripole 5cm - I2M - juin 2013 ERT a=4cm - I2M - juin 2013
Figure 7. Evolution of apparent resistivity vs. time by 4 different methods used in 4 different labs – the
electrode spacing a = 4 cm except for quadrupole a = 5 cm
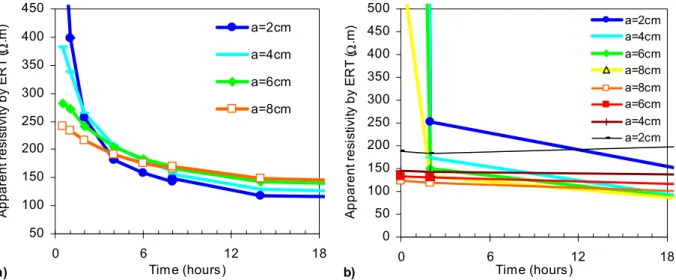
50 100 150 200 250 300 350 400 450 0 6 12 18 Time (hours) A p p a re n t re s is ti v it y b y E R T (Ω .m ) a=2cm a=4cm a=6cm a=8cm a) 0 50 100 150 200 250 300 350 400 450 500 0 6 12 18 Time (hours) A p p a re n t re s is ti v it y b y E R T (Ω .m ) a=2cm a=4cm a=6cm a=8cm a=8cm a=6cm a=4cm a=2cm b)
Figure 8. Evolution of apparent resistivity vs. time with ERT probes – a) From both the wet face (Lab 1) –
Regarding ERT results, the tendency is similar as expected: decrease of the resistivity with time of imbibition, moreover the ERT results, compared to Wenner ones with the same spacing a = 4 cm, present the same kinetics. The apparent resistivity measured by IFSTTAR is higher than the result of LMDC and GEM partly because the lab temperature in January was lower, a correction should be applied.
Figure 8 enables to have a notion on the distribution of apparent resistivity versus depth influenced by distribution of moisture in depth. The device of I2M (Fig 8b), being more sensitive, makes it possible to measure the resistivity at t0 and from the “dry face”. Thus it shows the difference in initial conditions between the opposing faces of the slab studied at t0: the face opposite to the “wet face” plunged into water was in fact more humid at t0 than the “wet face”. Consequently, the imbibition campaign will be done again in this lab. The results shown in Fig. 8a (IFSTTAR) confirm that the slabs were not homogeneous at early times, the slab core being more humid. Then, the resistivity under the wet surface (a = 2 cm) decreases more drastically than the 3 others and stabilized earlier at long term. This behavior is well explained by water penetration. The apparent resistivities are integrated from the wet surface to an estimated investigation depth, consequently, an inversion has to be proceeded to obtain gradient of resistivity as proposed by [21].
5 Conclusions and further researches
The large set of NDT results presented in this paper shows that it is possible to monitor the progression of the water ingress into concrete slab, in accordance with reference methods such as embedded THR probes or gammandensimetry, that are still difficult to implement and to analyze in order to obtain the degree of saturation.
The NDT results are sensitive and complementary to locate the water front and also to extract the saturation degree in the future. Some methods already give more information about gradient in depth, by using either the geometry of the devices (capacitive probes or ERT) or the phase velocity dispersion on a large frequency range (GPR or US surface wave).
In the future, these integrating results, giving information from the surface to the investigation depth depending on the device, need to be inverted to obtain true gradients versus depth. After, calibration curves, that relate NDT results with the degree of saturation of the studied concrete, have to be used to finally obtain moisture gradients. Concerning capacitive measurements and electrical resistivity tomography (ERT), an inversion process and a calibration are in progress [21]. Regarding GPR, studying the guided wave characteristics enable to monitor the water front depth [23, 24]. As for US surface wave, the inversion of dispersion curves to recover intrinsic properties (shear wave velocity with depth) is a real challenge [10] as phase velocity variations are lower than 10% and the relation between shear wave velocity and saturation degree is non-linear at low degree of saturation.
6 Acknowledgements
The French National Agency for Research (ANR “Building and Sustainable Cities”) is acknowledged for its financial support during the project ANR-EVADEOS.
7 Bibliography
1. Baroghel-Bouny V. et al. ‘Concrete design for a given structure service life – Durability management with regard to reinforcement corrosion and alkali-silica reaction – State of the art and guide for the implementation of a predictive performance approach based upon
durability indicators’, Scientific and technical documents AFGC, (French version 2004), English version 2007, 252 p.
2. Balayssac J.P., Garnier V., Villain G., Sbartaï M., Dérobert X., Piwakowski B., Breysse D., Salin J. ‘An overview of 15 years of French collaborative projects for the characterization of concrete properties by combining NDT methods’, Proceedings of Int. Symp. on NDT-CE, 15-17 sept. 2015, Berlin, Germany
3. Breysse D., Klysz G., Dérobert X., Sirieix C., Lataste J.F., How to combine several non-destructive techniques for a better assessment of concrete structures’, Cem. Con. Res., Vol. 38, pp. 783-793, 2008.
4. Villain G., Sbartaï Z. M., Dérobert X., Garnier V., Balayssac J.P., ‘Durability diagnosis of a concrete structure in a tidal zone by combining NDT methods: laboratory tests and case study’, Construction and Building Materials, Vol. 37, pp.893–903, 2012, http://dx.doi.org/10.1016/j.conbuildmat.2012.03.014
5. Djerbi-Tegguer A., Bonnet S., Khelidj A., Baroghel-Bouny V., ’Effect of uniaxial compressive loading on gas permeability and chloride diffusion coefficient of concrete and their relationship‘, Cem. Con. Res., Vol. 52 pp. 131-139, 2013. http://dx.doi.org/10.1016/j.cemconres.2013.05.013
6. Torrent R.J. ’A two-chamber vacuum cell for measuring the coefficient of permeability to air of the concrete cover on site‘, Materials and Structures, vol 25, pp 358-365, 1992. 7. Romer M. ’Effect of moisture and concrete composition on the Torrent permeability
measurement’, 2005, Materials and Structures, Vol 38, pp. 541-547, 2005.
8. Zhang Z., Thiéry M., Baroghel-Bouny V., ‘A review and statistical study of existing hysteresis models for cementitious materials’, Cem. Con. Res., Vol. 57, pp.44-60, 2014. 9. Villain G. and Thiery M. ‘Gammadensimetry: a method to determine drying and
carbonation profiles in concrete’, NDT&E Int. Journal, 2006, Vol. 39, n°4, pp.328-337. 10. Abraham O., Métais V., Villain G., Plantier G., Le Duff A., Durand O., ‘Influence of
water gradient on surface wave measurements in concrete’, Proceedings of Int. Symp. on NDT-CE, 15-17 sept. 2015, Berlin, Germany
11. Mokhtar T A, Herrmann R B, Russel DR., 'Seismic velocity and q model for the shallow structure of the arabian shield from short-period Rayleigh wave', Geophysics, 53(11), pp.1379-1387, 1988.
12. Abraham O., Piwakowski B., Villain G., Durand O., 'Non-contact, automated surface wave measurements for the mechanical characterisation of concrete', Construction and Building Materials, 37, pp.904-915, 2012.
13. Anugonda P., Wiehn J., and Turner J., ‘Diffusion of ultrasound in concrete’, Ultrasonics, Vol. 39, n°6, pp. 429-435, 2001.
14. Dérobert X, Iaquinta J, Klysz G, Balayssac J P. ‘Use of capacitive and GPR techniques for non-destructive evaluation of cover concrete’, NDT&E International; Vol. 41, pp.44-52, 2008.
15. Laurens S., Balayssac J.P., Rhazi J., Arliguie G., ‘Influence of concrete relative humidity on the amplitude of Ground-Penetrating Radar (GPR) signal’, Materials and Structures, Vol.35, N°248, pp 198-203, 2002
16. Balayssac J.P., Laurens S., Klysz G., Lataste J.F., Dérobert X., ‘Non destructive evaluation of concrete contamination by chloride: comparison of methods‘, Eur. Journ. Env. & Civil Eng., Vol. 15, N°7, pp.1073-1084, 2011.
17. Sbartaï Z.M., Laurens S., Rhazi J., Balayssac J.P., Arliguie G., ‘Using radar direct wave for concrete condition assessment: Correlation with electrical resistivity’, Journal of Applied Geophysics, Vol. 62(4), , pp. 361-374, 2007.
18. Lataste JF., Laurens S., Moczko A., ‘Some elements for improving interpretation of concrete electrical conductivity’, NDTCE’09, June 30th-July 3rd 2009, Nantes, France. 19. Du Plooy R., Palma Lopes S., Villain G., Dérobert X., ‘Development of a multi-ring
resistivity cell and multi-electrode resistivity probe for investigation of cover concrete condition’, NDT&E International, Vol. 54, 2013, pp. 27–36.
http://dx.doi.org/10.1016/j.ndteint.2012.11.007
20. Lecieux Y., Schoefs F., Bonnet S., Lecieux T., Palma Lopes S. ‘Quantification and uncertainty analysis of a structural monitoring device: detection of chloride in concrete using DC electrical resistivity measurement’, Nondestructive Testing and Evaluation, 2015, http://dx.doi.org/10.1080/10589759.2015.1029476
21. Fares M., Villain G., Fargier Y., Thiery M., Dérobert X., Palma Lopes S. ‘Estimation of water gradient and concrete durability indicators using capacitive and electrical probes’, Proceedings of Int. Symp. on NDT-CE, 15-17 sept. 2015, Berlin, Germany.
22. Chekroun M, Le Marrec L, Abraham O, Durand O, Villain G., 'Analysis of coherent surface wave dispersion and attenuation for non-destructive testing of concrete', Ultrasonics, 49(8), pp.743-751, 2009.
23. Villain G., Ihamouten A., du Plooy R., Palma Lopes S., Dérobert X., ‘Use of electromagnetic non-destructive techniques for monitoring water and chloride ingress into concrete’, Near Surface Geophysics, vol. 13, pp. 299-309, 2015.
24. Xiao X., Ihamouten A., Villain G., Dérobert X. Application of electromagnetic waves propagating in multi-layered waveguide to monitor chloride ingress into concrete, Proceedings of Int. Symp. on NDT-CE, 15-17 sept. 2015, Berlin, Germany.