PROGRAMME DE MAITRISE EXTENSIONNE
A
L'UNIVERSITE DU QUEBEC EN ABITIBI-TEMISCAMINGUEEFFETS DE LA FERTILISATION LOCALISEE SUR LA
CROISSANCE ET LA NUTRITION DE PEUPLIERS HYDRIDES
EN ABITffii-TEMISCAMINGUE
MEMO IRE PRESENTE
COMME EXIGENCE PARTIELLE DE LA MAITRISE EN BIOLOGIE
PAR
TOMA GUILLEMETTE
Mise en garde
La bibliothèque du Cégep de l’Témiscamingue et de l’Université du Québec en Abitibi-Témiscamingue a obtenu l’autorisation de l’auteur de ce document afin de diffuser, dans un but non lucratif, une copie de son œuvre dans Depositum, site d’archives numériques, gratuit et accessible à tous.
L’auteur conserve néanmoins ses droits de propriété intellectuelle, dont son droit d’auteur, sur cette œuvre. Il est donc interdit de reproduire ou de publier en totalité ou en partie ce document sans l’autorisation de l’auteur.
REMER ClEMENTS
J'aimerais tout d'abord remercier rna directrice Annie Desrochers pour ses conseils, ses encouragements et son dynamisme. Je tiens egalement
a
remercier Suzanne Brais et Claude Camire, qui ont su enrichir mes connaissances sur les analyses statistiques et la nutrition des arbres. Je remercie sincerement toute 1\~quipe de terrain, qui a brave le 'gumbo' de 1' Abitibi avec moi lors des activites de plantation et de prises de mesures. Je suis pareillement reconnaissant envers 1' equipe de chercheurs de la Chaire Industrielle CRSNG-UQAT -UQAM en Amenagement Forestier Durable (Chaire AFD) pour les discussions constructives. Je remercie les organismes suivants pour leur support financier: la Chaire AFD, l'Universite du Quebec en Abitibi-Temiscamingue, le Ministere des Ressources Naturelles du Quebec via les programmes de valets I et II, le Service Canadien des Forets et Developpement Economique Canada. Finalement, je salue Patou pour sa patience et sa comprehension et toi Mathea, qui arrive justea
temps ...TABLE DES MATIERES
LISTE DES FIGURES ... !¥ LISTE DES TABLEAUX ... VI RESUME ... VII
CHAPITRE 1: INTRODUCTION GENERALE ... 1
1.1 La fertilisation ... 3
1.2 Le contr6le de la vegetation competitive ... 4
CHAPITRE 2 : GROWTH AND NUTRITION OF HYBRID POPLARS FERTILIZED AT PLANTING IN THE BOREAL FOREST OF WESTERN QUEBEC ... 8
2.1 Abstract ... 9
2.2 Resume ... lO 2.3 Introduction ... 11
2.4 Materials and Methods ... 13
2.4.1 Study sites ... 13
2.4.2 Foliar analysis ... 16
2.5 Results ... 19
2.5 .1 Growth response to fertilizers ... 19
2.5.2 N:P ratios ... 28 2.5.3 DRIS indices ... 30 2. 6 Discussion ... 31 2.7 Conclusion ... 34 2.8 Acknowledgements ... 35 2.9 References ... 36
CHAPITRE 3 : BIOMASS ALLOCATION OF TWO-YEAR OLD HYBRID POPLARS FERTILIZED AT PLANTING WITH PHOSPHORUS ... 41
3.1 Abstract ... 42
3.2 Introduction ... 43
3.3 Methods ... 44
3.4 Results and discussion ... 46
3.6 Acknowledgements ... 53
3. 7 References ... 54
CHAPITRE 4 : CONCLUSION GENERALE ... 58
LISTE DES FIGURES
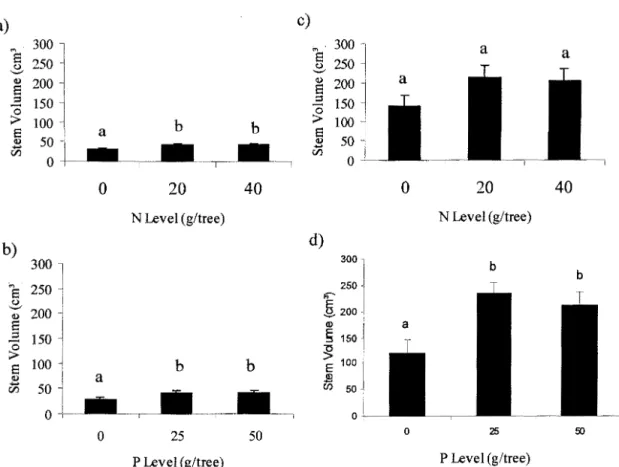
FIGURE 2.1: MEAN STEM VOLUME OF CLONE 747210 GROWN AT THE FARMLAND SITE FOR EACH A) N AND B) P FERTILIZATION LEVEL AFTER THE FIRST GROWING SEASON, AND FOR EACH C) NAND D) P FERTILIZATION LEVEL AFTER THE SECOND GROWING SEASON. ERROR BARS ARE SEs. BARS WITH THE SAME LETTERS ARE NOT SIGNIFICANTLY DIFFERENT ATP < 0.05 ... 21 FIGURE 2.2: MEAN STEM VOLUME OF CLONE 747210 GROWN AT THE FOREST SITE FOR
EACH A) NAND B) P FERTILIZATION LEVEL AFTER THE FIRST GROWING SEASON, AND FOR EACH C) NAND D) P FERTILIZATION LEVEL AFTER THE SECOND GROWING SEASON. ERROR BARS ARE SES. BARS WITH THE SAME LETTERS ARE NOT SIGNIFICANTLY DIFFERENT AT P < 0.05 ... 22 FIGURE 2.3: MEAN STEM VOLUME OF CLONE 915005 FOR EACH N AND P FERTILIZATION LEVEL COMBINATIONS AFTER THE FIRST GROWING SEASON, AT THE FARMLAND SITE. ERROR BARS ARE SEs. BARS WITH THE SAME LETTERS ARE NOT SIGNIFICANTLY DIFFERENT AT P < 0.05 ... 23 FIGURE 2.4: MEAN STEM VOLUME RESPONSE OF CLONE 915005 TOP FERTILIZATION AT THE FARMLAND SITE AFTER TWO GROWING SEASONS. ERROR BARS ARE SES. BARS WITH THE SAME LETTERS ARE NOT SIGNIFICANTLY DIFFERENT AT P < 0.05 . ... ... ... ... ... .. ... ... .. ... ... ... .. 24 FIGURE 2.5: MEAN STEM VOLUME RESPONSE OF CLONE 915005 TOP FERTILIZATION AT THE FOREST SITE AFTER A) THE FIRST AND B) THE SECOND GROWING SEASONS. ERROR BARS ARE SEs. BARS WITH THE SAME LETTERS ARE NOT SIGNIFICANTLY DIFFERENT AT P < 0.05 ... 25 FIGURE 2.6: MEAN STEM VOLUME OF CLONE 915319 GROWN AT THE FARMLAND SITE FOR EACH A) N AND B) P FERTILIZATION LEVEL AFTER THE FIRST GROWING SEASON, AND FOR EACH C) NAND D) P FERTILIZATION LEVEL AFTER THE SECOND GROWING SEASON. ERROR BARS ARE SES. BARS WITH THE SAME LETTERS ARE NOT SIGNIFICANTLY DIFFERENT AT P < 0.05 ... 27 FIGURE 2.7: MEAN STEM VOLUME OF CLONE 915319 FOR EACH A) N AND B) P FERTILIZATION LEVELS, AFTER TWO GROWING SEASONS AT THE FOREST SITE. ERROR BARS ARE SEs. BARS WITH THE SAME LETTERS ARE NOT SIGNIFICANTLY DIFFERENT AT P < 0.05 ... 28
FIGURE 2.8: RELATIONSHIP BETWEEN FOLIAR N:P RATIOS AND FIRST AND SECOND YEAR STEM VOLUME FOR EACH NAND P FERTILIZATION LEVEL COMBINATIONS AND FOR EACH CLONE: A) 747210 AT THE FARMLAND SITE, D) 747210 AT THE FOREST SITE, B) 915005 AT THE FARMLAND SITE AND E) 915005 AT THE FOREST SITE C) 915319 AT THE FARMLAND SITE AND F) 915319 AT THE FOREST SITE. EACH LINE REPRESENTS THE EVOLUTION IN N:P RATIOS FROM THE FIRST YEAR TO THE SECOND YEAR. CIRCLES AROUND SYMBOLS AT THE FARMLAND SITE REPRESENT FERTILIZATION TREATMENTS NOT SIGNIFICANTLY DIFFERENT ATP < 0.05 ... 29 FIGURE 3.1: EFFECT OF P FERTILIZATION ON ROOT AND SHOOT BIOMASS ON CLONE 747210, TWO YEARS AFTER PLANTING. ERROR BARS ARE SEs. BARS WITH THE SAME LETTERS ARE NOT SIGNIFICANTLY DIFFERENT AT P < 0.05 ... 48 FIGURE 3.2: EFFECT OF P FERTILIZATION ON STEM HEIGHT GROWTH OF CLONE 747210 LOCATED ON MODERATE AND IMPERFECT DRAINAGE CLASSES, AT BOTH SITES. BARS WITH THE SAME LETTERS ARE NOT SIGNIFICANTLY DIFFERENT AT P < 0.05 . ... 51
LISTE DES TABLEAUX
TABLE 2.1: MEAN BASAL DIAMETER, STEM HEIGHT AND STEM DIEBACK OF EACH CLONE AT PLANTING AND AFTER EACH GROWING SEASON. VALUES WITH THE SAME LETTER IN A LINE WITHIN EACH SITE ARE NOT SIGNIFICANTLY DIFFERENT AT p < 0.05 ... 15 TABLE 2.2 : MEAN SOIL CHARACTERISTICS FOR THE FARMLAND AND FOREST SITES .. 16 TABLE 2.3: DR18 FORMULAS DETERMINED BY THE VARIANCE OF NUTRIENT RATIOS BETWEEN THE FAST AND THE SLOW GROWING GROUPS OF EACH HYBRID POPLAR CLONE ... 18 TABLE 2.4: DRlS NORMS AND COEFFICIENTS OF VARIATION (CV) FOR EACH CLONE. THE MEANS REPRESENT AVERAGE NUTRIENTS RATIOS OF FIRST YEAR HIGH-YIELDING TREES LOCATED AT BOTH SITES ... 19 TABLE 2.5: DRlS INDICES OF FIRST YEAR UNFERTILIZED HYBRID POPLAR CLONES CALCULATED FROM FIELD STANDARDS ... 31
TABLE 3.1: MEANS OF SOIL ANALYSES FROM THE TWO SITES ... 46 TABLE 3.2: MEAN ROOT CHARACTERISTICS FOR TREES AT THE TWO SITES. SE VALUES ARE GIVEN IN PARENTHESES ... 49 TABLE 3.3: MEAN VALVES OF THE MEASURED PARAMETERS FOR EACH P FERTILIZATION LEVEL AND DRAINAGE CLASS. P FERTILIZATION WAS NOT SIGNIFICANT AT P < 0.05 FOR THIN ROOT BIOMASS AND MEAN ROOT LENGTH ONLY. SE VALUES ARE GIVEN IN PARENTHESES ... 50
RESUME
Deux dispositifs ont ete etablis en 2003 en milieu agricole et forestier afin d'etudier l'effet de differentes combinaisons de fertilisants (N-P-K) ainsi qu'a differents types d'entretien mecanique de la vegetation competitive sur la croissance de trois clones de peupliers hybrides (Populus spp.; PEH). La capacite des methodes DRIS (Diagnosis and Recommandation Integrated System) et du ratio N:P foliaire a predire les besoins en fertilisants a egalement ete evaluee sur les arbres non-fertilises. De plus, douze PEH ont ete deracines delicatement a l'aide de truelles afin de caracteriser le developpement racinaire des PEH suite a Ia fertilisation phosphatee. Les resultats apres deux saisons de croissance montrent que Ia fertilisation en P a ete la plus benefique sur la croissance en volume des arbres, en l'augmentant en moyenne de 63 %par rapport aux arbres non-fertilises. Une application moderee de N et de P a generalement procure les meilleurs taux de croissance lors de Ia premiere annee, mais l'effet de N n'etait plus significatif lors de la deuxieme annee. Le diagnostic nutritionnel a l'aide des ratios N :P s'est avere relativement fiable lorsque la croissance etait fortement liee a Ia disponibilite relative de ces 2 elements, comme pour Ia plantation etablie sur ancienne friche agricole. Cependant, la methode DRIS a mieux predit les besoins nutritionnels des plants parce qu'elle permet !'integration de plusieurs ratios d' elements nutritifs susceptibles d'influencer la croissance des plants analyses. Les trois types d'entretien mecanique pratiques lors des deux premieres annees n'ont pas engendres de differences signi:ficatives dans Ia croissance des plants. L'analyse de !'allocation de la biomasse a revele que Ia fertilisation en P ne modi:fie pas le rapport de la masse des racines sur la masse de la tige (ratio racines/tige ), mais elle permet une augmentation de la masse totale des arbres de
CHAPITRE 1 : INTRODUCTION GENERALE
La necessite de diminuer la pression de la recolte de bois en fon!t naturelle s'illustre bien au Quebec par la volonte d'appliquer a plus grande echelle un type d' amenagement « ecosystemique » de la fon!t et d' augmenter la superficie des aires protegees. Ce nouveau virage forestier que vit actuellement le Quebec, devra cependant mener a la fois a l'atteinte d'objectifs de protection des ecosystemes forestiers eta la production ligneuse en qualite et en quantite suffisante afin d'assurer la viabilite des usines de transformation de Ia province. Ainsi, le Quebec doit se doter d'une politique de rendement accru sur une portion du territoire situee a proximite des usines de transformation. Cette nouvelle politique permettrait d' approvisionner les usines de fa9on continue et rentable tout en diminuant Ia pression de coupe sur Ia majorite du territoire existant.
La ligniculture, c'est a dire la culture intensive d'arbres a croissance rapide sur courtes rotations, est une des approches de rendement accru pouvant augmenter le volume de bois disponible le plus rapidement pour une superficie donnee. Le peuplier hybride (Populus spp. ci-apres PEH) est !'essence Ia plus productive en terme de volume sur courte rotation en Amerique du Nord. Cependant, les experiences passees ont montre que Ia croissance du PEH est directement liee a l'intensite de culture, la fertilite du site et les conditions climatiques presentes. Bien que Ia region de I' Abitibi-Temiscamingue se situe au creur de l'industrie forestiere du Quebec, les pratiques sylvicoles n'ont pas encore ete developpees pour y pratiquer la ligniculture. La nature compacte des sols et les conditions climatiques rigoureuses qui prevalent dans cette region peuvent etre source de difficultes face a leur installation rapide apres la mise en terre.
Les depots d'argile lourde representent plus de 70% du territoire agricole de 1' Abitibi (Rompre et Carrier 1997) et sont, par consequent, le type de depot le plus susceptible
a
etre reboise en PEH. La texture fine de ces depots peut cependant causer des conditions difficilesa
l'etablissement des plants si le sol n'est pas travaille correctement. En effet, les depots limono-argileux crees par les lacs proglaciaires Barlow et Objiway (Veillette et al. 2000), ainsi que leur mauvaise structure resultant des activites agricoles passees, peuvent limiter l'enracinement des plants. De plus, meme si les sols sont bien pourvus en ehSments nutritifs, ces derniers risquent de ne pas etre disponibles pour les plants, compte tenu de Ia capacite limitee du systeme racinairea
exploiter pleinement le sol (Kozlowski et Pallardy 1997; Leroy 1969). Les solsa
texture fine peuvent egalement occasionner des problemes de soulevement des plants lors des gelees automnales s'il n'y a pas eu un enracinement suffisant lors de la premiere saison de croissance. Finalement, les solsa
texture argileuse prennent plus de tempsa
se rechauffer au printemps (Camire et Brazeau 1998), et il a ete demontre que Ia temperature froide du sol avait pour effet de retarder la croissance du peuplier (Landhausser et a!. 2001 ).Certains milieux forestiers mal regeneres de la foret boreale peuvent egalement constituer une alternative pour la ligniculture. Cependant, les sites mal regeneres apres coupe indiquent souvent de mauvaises conditions edaphiques pour Ia croissance des plants. Les sols forestiers pourraient s'averer avantageux pour la croissance des PEH, car ils ont I' avantage de posseder une meilleure structure que les sols des friches agricoles, du
a
la proportion plus forte de matiere organique deposee chaque annee sur le sol eta
!'absence de pratiques agricoles (Havlin et al. 1999). Cependant, afin de preserver l'integrite des ecosystemes, les stations forestieres productives et bien regenerees ne devraient pas etre converties en des plantations monospecifiques. Ainsi, le deploiement des sites de ligniculture sur le territoire public quebecois devrait se faire uniquement sur des stations presentant une regeneration en essences desirees (commerciales) insuffisantes, mais possedant tout de meme un bon de potentiel de croissance pour le PEH.La survie et la croissance des PEH lors des premieres annees apres leur mise en terre dependent de la facilite avec laquelle ils developpent un bon systeme racinaire. Cette periode d'installation consiste essentiellement en la mise en place d'un enracinement capable d'alimenter e:fficacement le plant en eau et en mineraux. Au cours de cette etape, la croissance en hauteur est reduite et la croissance en diarnetre est faible (Souleres 1995 dans Sirois 2001 ). La duree de la phase d'installation varie selon le clone, le milieu et l'intensite de la culture.
1.1 La fertilisation
II est reconnu que les varietes de peuplier hybride repondent bien
a
la fertilisation (Menetrier et Vallee 1980; van den Driessche 1999a, b; Brown and van den Driessche 2002). II a d'ailleurs ete demontre en Europe que les PEH reagissaient tres biena
la fertilisation dans les sols d'argile lourde, meme si ces sols sont generalement riches en elements nutritifs (Leroy 1969). Bien que la quantite ou la forme d' engrais ont des effets sur la croissance, la localisation et la disponibilite de !'element voulu au moment le plus opportun est tout aussi important: Le phosphore (P), pour le demarrage de la plantation et ensuite l'azote (N) pour la croissance (Menetrier et Vallee 1980). La croissance de la plupart des clones de PER semble etre directement relieea
la disponibilite de N et P dans le sol, tel que demontre par differents tests de fertilisation (Bameoud et al. 1979; Blackmon 1976, 1977b;Garbaye 1980; Menetrier et Vallee 1980; van den Driessche 1999). II n'est pas recornrnande de fertiliser en plein champ les trois premieres annees, car c'est generalement Ia vegetation competitive qui profite de I' apport de fertilisants (Staples
et al. 1999). Cette methode a pour effet d'augrnenter le nombre d'entretiens requis
afin de limiter la croissance des herbacees. La fertilisation par pied d'arbre, au moment de la plantation peut quant
a
elle arneliorer l'etablissement des plants enmaximisant les taux de croissance des la premiere annee, sans pour autant stimuler la croissance de la vegetation competitive (van den Driessche 1999). Rappelons que si la faible croissance initiale des PEH ne permet pas a la canopee de se fermer rapidement, 1' ensoleillement favorise les herbacees qui ralentissent alors davantage la croissance des plants (van Oosten 2001).
L 'habilete des plantes a extraire des sources ponctuelles de fertilisants explique pourquoi les traitements localises procurent une meilleure croissance que les applications faites a la surface du sol (Caldwell 1980). Des etudes sur la nutrition des plantes vasculaires ont montre qu'une proportion de seulement 10% du systeme racinaire pouvait maintenir la croissance d'un plant grace a un apport suffisant en mineraux (Burns 1980). Ainsi, un test de fertilisation localisee dans une plantation de PEH a ete etabli sur l'lle de Vancouver afin de verifier l'impact de la methode d'application (localisee vs en plein). Cette etude a demontre que le prelevement deN et p par kilo gramme de nutriments ajoutes etait environ 10 fois plus eleve en traitement localise comparativement au traitement a la surface du sol (van den Driessche 1999).
1.2 Le controle de Ia vegetation competitive
II est bien connu qu'un controle rigoureux des herbacees effectue entre les rangs de peupliers hybrides favorise la croissance de ces demiers (Schroeder et al. 2003; Thomas et al. 2000b; Bameoud et al. 1982; Dickmann et al. 2001 ). Des etudes nord-americaines ont d'ailleurs deja demontre que l'entretien rigoureux des plantations de PEH lors de la deuxieme annee de croissance produisait le meme gain de croissance qu'une application d'azote de 224 Kg/ha (Baker and Blackmon 1978). Leroy (1969) a demontre que le seul fauchage de la flore herbacee fait disparaitre la
carence en K et ameliore la nutrition azotee sur un site argileux compact. Cependant, d'autres etudes (Thomas et al. 2000a; Dickmann et al. 2001) montrent qu'il est preferable de pratiquer des techniques d' entretien qui eradiquent les racines des herbacees comme le hersage ou le binage du sol, car le fauchage tend
a
augmenter la densite des racines des herbacees, qui puiseronta
nouveau les mineraux du sol et formeront une couche isolante gardant les sols froids.Les pratiques courantes de suppression de la vegetation competitive dans les plantations de PEH au Quebec se font generalement avec un hersage dans un sens uniquement. En effet, les plants sont generalement bien espaces entre les rangees, mais ne le sont pas au niveau de la rangee elle-meme, ce qui complique le passage de la machinerie dans les deux sens. Une etude portant sur les modeles d'entretien a mis en evidence que la vegetation laissee entre les plants de PEH lors de l'entretien des rangees, meme si la vegetation competitive est completement retiree entre les rangees, ralentit significativement la croissance des PEH (Thomas et al. 2000b ). Ainsi, le binage du sol entre et autour des arbres, grace
a
un equipement specialise (Weed Badger™) pourrait avoir des effets benefiques sur la croissance des PEH. Cet appareil, gracea
son bras articule, permet d'eliminer la vegetation ne pouvant etre eliminee par les methodes conventionnelles d'entretien mecanique (par ex. une herse tiree par un tracteur).Finalement, mentionnons que les entretiens mecaniques sont plus dispendieux que les applications d'herbicides. II est plus facile d' obtenir un meilleur controle des herbacees
a
long terme avec les produits chimiques, mais lorsque fait de la bonne fa<;on et au moment opportun, les entretiens mecaniques peuvent donner de meilleurs resultats de croissance sur les PEH (van den Driessche 1999 b). Hansen et al. (1986) ont d'ailleurs demontre que I' accumulation des debris vegetaux au sol, causee par les applications d'herbicides, offrait un abri hivernal aux rongeurs et augmentait ainsi la proportion d'arbres pouvant etre rongee.6
II existe un climat continental frais et moderement humide en Abitibi-Temiscamingue. Les etes sont chauds et humides, mais Ia periode sans gel est relativement courte, d'oi:t !'importance de maximiser les interventions sylvicoles lors de cette periode. Selon les normales climatiques entre 1971 et 2000 etablies par Environnement Canada, on retrouve environ 1450 degres jours de croissance (>5°C) en Abitibi-Temiscamingue. L'accumulation des precipitations sous forme de pluie totalise 680 mm par an.
Le chapitre 2 de ce memoire traite des experiences realisees sur la fertilisation en traitement localise dans le sol appliquee au moment de la mise en terre des plants de PEH. Cette experience visait
a
identifier quelle combinaison de N-P-K selon differentes doses stimulerait le plus fortement la croissance des PEH suitea
leur mise en terre. Ensuite, nous avons evalue deux techniques de diagnostics foliaires (DRIS et ratio N:P) appliquees sur les arbres non-fertilises afin de voir si ces techniques permettent de predire efficacement les besoins en elements nutritifs des plants. En plus des traitements de fertilisation, nous avons utilise trois traitements d' entretien mecanique de la vegetation competitive afin de voir s'ils entraineraient des reponses differentes dans la croissance des plants. Les trois techniques d'entretien utilisees etaient (1) le passage simple de la herse, (2) le passage croise de la herse et (3) !'utilisation du Weed Badger™ combine au passage simple de la herse. Toutes ces techniques d'entretien on ete repetees deux fois par an pendant les deux premieres annees de croissance. Cependant, faute de differences significatives entre les techniques d' entretien, cet aspect de la recherche n' est pas aborde dans le chapitre 2, mais une breve description des observations faites lors des operations est presentee dans la conclusion generale de ce memoire.Dans le troisieme chapitre no us examinons 1' effet de Ia fertilisation en P sur Ia biomasse souterraine et aerienne de PEH ages de 2 ans qui ont ete reboises sur un sol
le but de cette experience etait de verifier si !'application de 50 g/arbre de p en traitement localise modifiait le ratio de la masse des racines sur la masse de la tige des plants apres deux saisons de croissance.
CHAPITRE 2 : GROWTH AND NUTRITION OF HYBRID POPLARS FERTILIZED AT PLANTING IN THE BOREAL FOREST OF WESTERN
QUEBEC
Toma Guillemette1 and Annie DesRochers
1
Corresponding author
Universite du Quebec en Abitibi-Temiscamingue, Chaire industrielle CRSNG-UQAT-UQAM en amenagement forestier durable, 445, boulevard de l'Universite,
)
Rouyn-Noranda, Qc J9X 5E7, Canada, Tel: (819)762-0971, Fax: (819)797-4727, email: toma.guillemette@uqat.ca.
2.1 Abstract
In order to maximize growth and diagnose nutritional requirements of hybrid poplars
(Populus spp.) grown in the boreal forest zone of Western Quebec, the Diagnosis and Recommendation Integrated System (DRIS) was evaluated in conjunction with N:P ratios of trees growing in two young plantations. Three hybrid poplar clones (747210; P. balsamifera x trichocarpa, 915005; P. balsamifera x maximowiczii, and 915319; P. maximowiczii x balsamifera) were fertilized at planting with 18 combinations of nitrogen (N), phosphorus (P) and potassium (K). Fertilizers used were granules of ammonium nitrate (34.5-0-0) at 3 levels (0, 20 and 40 g/tree ofN), triple-superphosphate (0-45-0) at 3 levels (0, 25 and 50 g/tree of P), and potassium sulfate (0-0-50) at 2 levels (0, 20 g/tree of K). After two growing seasons, P fertilization was the most effective in promoting growth and increased mean stem volume by 63% compared to unfertilized trees. The combination of a moderate level of N and P fertilizers generally resulted in highest yield during first year, but the effect ofN was not persistent throughout the second year. Nutritional diagnosis with N :P ratios was relatively reliable when growth was strongly related to these two nutrients, as we found at the farmland site. The DRIS method generally predicted nutrient requirements adequately, but relative proportions of nutrients needed did not always match growth responses to fertilization.
2.2 Resume
Afin de maximiser la croissance et de predire les besoins nutritionnels du peuplier hybride (Populus spp.) plante dans la zone bon5ale de 1 'ouest du Quebec, no us avons
evalue la methode DRIS (Diagnosis and Recommendation Integrated System) et compare les ratios N :P de deux jeunes plantations. Trois clones de peupliers hybrides (747210; P. balsamifera x trichocarpa, 915005; P. balsamffera x maximowiczii, et
915319; P. maximowiczii x balsamifera) ont ete fertilises au moment de la plantation
avec 18 combinaisons d'azote (N), de phosphore (P) et de potassium (K). Les fertilisants utilises etaient le nitrate d'ammonium (34.5-0-0) selon 3 niveaux (0, 20 et 40 g/arbre de N), le triple-superphosphate (0-45-0) selon 3 niveaux (0, 25 et 50 g/arbre de P), et le sulfate de potassium (0-0-50) selon 2 niveaux (0 et 20 g /arbre de K). Au terme de I' etude de 2 ans, la fertilisation en P a ete la plus benefique sur la croissance en volume des arbres, en l'augmentant en moyenne de 63 %par rapport aux arbres non-fertilises. Une application moderee de N et de P a generalement procure les meilleurs taux de croissance lors de la premiere annee, mais l'effet deN n'etait plus significatif lors de la deuxieme annee. Le diagnostic nutritionnel
a
l'aide des ratios N :P s'est avere relativement fiable lorsque la croissance etait fortement lieea
la disponibilite relative de ces 2 elements, comme pour la plantation etablie sur ancienne friche agricole. La methode DRIS a generalement bien predit les besoins nutritionnels lors de la premiere annee de croissance, mais la proportion relative des elements prescrits par DRIS ne concordait pas toujours aux gains de croissance obtenus suitea
la fertilisation.2.3 Introduction
Hybrid poplar (Populus spp.) plantations are economically attractive to the forest industry because of their fast growing rates and high yield potential. The decrease of wood supplies in native forests due, in part, to competing land uses and to more sustainable management practices, will accentuate the need to manage more intensively some portions of the available land. However, many operationally-established hybrid poplar plantations do not meet expected volume productivity, often because of a lack of maintenance during the establishment phase. Growing poplars in plantations is challenging, and good establishment the first year is critical to long-term success (Stanturf et al. 2001 ).
One option to improve plantation establishment and early growth across a wide range of site conditions is fertilization at planting. Hybrid poplars have high nutrient requirements (Brown and van den Driessche 2002), and they have been shown to respond well to fertilization (Blackmon 1977; Menetrier and Vallee 1980; Sheedy 1982; van den Driessche 1999a, b; Brown and van den Driessche 2002). Usually, fertilizers are added as broadcast applications just before canopy closure of plantations, because it corresponds to the nutrient peak demand of the trees (Hansen
1994). Placed fertilization at planting, however, requires lesser amounts of fertilizer per hectare than broadcast techniques, since the contact area between the fertilizer and the soil particles is reduced, which limits adsorption processes and increases fertilization efficiency (Baldock and Burgess 1995). Another advantage of fertilization at planting is that it accelerates the installation period of trees so they are likely to be more resistant in case of a sudden drought or others stressing events. Moreover, placed fertilization limits nutrient uptake by weeds compared to a broadcast application, and this is particularly important since weeds are known to severely reduce hybrid poplar growth (Thomas et al. 2001 ).
Nitrogen (N) is generally the most limiting nutrient in poplar plantations (Blackmon 1976, 1977; Garbaye 1980, Menetrier and Vallee 1980, Barneoud et al. 1982; van den Driessche 1999a). However, phosphorus (P) fertilization is reputed to promote growth when it is applied at earlier stages of growth (Chapin et al. 1983; Zwart and Baldock 1996; van den Driessche 2003; Liang and Chang 2004; Brown and van den Driessche 2005). Potassium (K), applied with P and N, may also reduce mortality rate by increasing resistance to diseases (Leroy 1969).
When fertilizing, it is crucial to seek optimal nutritional balance and avoid fertilizing in excess of one nutrient for maximum productivity (Ingestad 1974, 1986). Ratios of nutrient concentrations are thus often better indicators of nutrient deficiencies than are single nutrient concentrations (Jones 1981, Walworth and Sumner 1987). Additionally, ratios of elements are less affected by sampling procedures, and they remain more constant with plant ageing (Walworth and Sumner 1987).
The boreal region has a long daily photoperiod during summer but a short growing season. Intensive short rotation forestry in boreal regions thus commonly relies on the use of fertilizers to achieve high productivity (Weih 2004), but also to correct possible soil nutrient deficiencies. No previous study has dealt with fertilizer requirements of hybrid poplars planted in the boreal regions of eastern Canada. The first objective of this study was therefore to assess the potential of placed fertilization at planting to increase early growth of hybrid poplar in this region. Secondly, we wanted to determine if it was possible to match tree responses to fertilizers with two diagnosis methods using foliar nutrient concentration ratios: (1) N:P ratios (Koerselman and Meuleman 1996) and (2) the Diagnosis and Recommendation Integrated System (DRIS) (Beaufils 1973). The first method focuses on N and P, with the rationale that these two elements govern a large part of the growth and that plant species have critical N:P ratios indicating whether the plant is N or P limited (Koerselman and Meuleman 1996). The second method goes further in the analysis
and takes into account all pairs of nutrients susceptible to affect plant growth. The DRlS method can thus be viewed as a modified regression technique that uses boundary line conditions of an incomplete set of independent variables to describe the dependant variable, yield (Walworth and Sumner 1987). The average ratio of foliar nutrient concentrations of a random selection of faster growing trees becomes the norm or the 'field standards', by which growth performance of the slower growing trees is judged (Leech and Kim 1981). In this study, preliminary field standards are proposed for three hybrid poplar clones and their use is evaluated on unfertilized trees of two plantations.
2.4 Materials and Methods
2.4.1 Study sites
Two hybrid poplar plantations were established in spring 2003 in the region of Abitibi-Temiscamingue, Quebec, Canada. The first plantation was established on an abandoned farmland site near the locality of Amos (48° 35' N, 78° 05' W), which is part of the western balsam fir-paper birch (Abies balsamea - Betula papyrifera)
bioclimatic domain (Grondin 1996). This site is part of the clay belt of Quebec and Ontario resulting from deposits left by the proglacial Lakes Barlow and Ojibway (Vincent and Hardy 1977). The soil texture is a heavy clay Gray Luvisol (Canada Soil Survey Committee 1987). The average number of degree-days above 5° C for the region range from 1215 to 1450 and has had a yearly rainfall between 610 to 680 mm for the last three decades (Environment Canada 2004). No agricultural activity had been done on this site for the last 25 years. The site was dominated by grasses and a few patches of alder (Alnus incana ssp. rugosa), willow (Salix spp.) and
trembling aspen (Populus tremuloides Michx.). The second plantation was
established on a previously forested site located near to the locality ofRollet (47° 92' N, 79° 18' W) and is part of western balsam fir - yellow birch (Betula
alleghaniensis) bioclimatic domain (Grondin 1996). This site was previously dominated by a trembling aspen forest which was commercially harvested in 2000. Its soil type is classified as a Humo-Ferrique Podzol with a sandy-loam soil texture (Agriculture Canada Expert Committee on Soil Survey 1987).
The planting sites were ploughed to a depth of 30 em in the fall of 2002, followed by disking in the spring of 2003 to level the soil and incorporate organic matter to mineral soil as well as to remove the remaining stumps and logs. The trees were planted in the first week of June at the farmland site and in the first week of July at the forest site. Dormant, bare-root hybrid poplar trees of approximately 1.5 m in height (table 2.1) were planted 30 em deep at a 3 x 3 m spacing. Three locally-produced clones from the Quebec Ministry of Natural Resources were used: 747210
(P. balsamifera x trichocarpa), 915005 (P. balsamifera x maximowiczii) and 915319
(P. maximowiczii x balsamifera). The fertilizers were applied according to a 3N x 3P x 2K factorial design within each of the three hybrid poplar clones (split plot). The clones were randomized and replicated into 3 blocks. The treatment unit was two trees of one clone (n = 324 per site). Fertilizers used were granules of ammonium
nitrate (34.5-0-0) at 3 levels (0, 20 and 40 g/tree; equivalent to 0, 22 and 44 Kg/Ha), triple-superphosphate (0-45-0) at 3 levels (0, 25 and 50 g/tree; equivalent to 0, 28 and 56 Kg!Ha), and potassium sulfate (0-0-50) at 2 levels (0 and 20 g/tree). The fertilizers were applied at planting by inserting the granules into a spade slit made at
15 em from the trees to a depth of about 15 em. Vegetation control was done twice a year (end of June and August) by cross-cultivating the plantations using a farm tractor.
Table 2.1: Mean basal diameter, stem height and stem die back of each clone at planting and after each growing season. Values with the same letter in a line within each site are not significantly different at p < 0.05.
Clone
At planting
Basal diameter (mm) Height (em)
Stem diebaek (em)
After the first growing season
Basal diameter (mm) Height (em)
After the second growing season
Basal diameter (mm) Height (em)
Farmland Site Forest Site
747210 915005 915319 747210 915005 915319
9.59a 11.43b 9.62a 9.1 Oa 11.44b 9.65ab
133.54a 170.85e 152.48b 128.49a 168.43b 152.29ab
9.51 a 20.45b 85.26e 11. 72a 12.13a 38.43a
16.58b 16.81b 12.71a 14.25a 15.64a 13.17a
143.83b 163.85e 92.16a 127.48a 163.98a 125.94a
26.81b 27.91b 20.67a 25.08a 26.14a 22.63a
175.13b 196.88b 141.44a 164.20a 190.34a 173.45a
Soils were sampled at 0-20 and 20-40 em depth in each site before planting. Samples were air-dried, sieved with a 2-mm screen, and analyzed for particle size distribution using a pipette. The pH of each sample was determined from a 1 :40 dilution after a lh agitation (Conseil des Productions Vegetales du Quebec 1988). Available phosphorus (P) was determined using the Mehlich-III method (Mehlich 1985). Exchangeable potassium, calcium and magnesium (K, Ca and Mg) were extracted with BaCh-NH4Cl (Amacher and aL 1990) and their contents were determined by inductively coupled plasma (ICP; Perkin Elmer plasma model 40). Soils analyses from both sites are presented in table 2.2. Basal diameter and height of trees were measured right after planting and at the end of the first and second growing seasons. Stem volumes (V) were estimated as:
[1] V ba
*
h/3where ba = basal area and h = height (Brown and van den Driessche 2005). Bud
formation was examined at the end of the first growing season, while observations on bud burst was done at the beginning of the second growing season and characterized according to the Quebec Ministry ofNatural Resource method (Gagnon et al. 1991).
Table 2.2 : Mean soil characteristics for the farmland and forest sites.
Site
Variable Farmland Forest
· · · - - · · - - · · ·
Depth (em) 0-20 20-40 0-20 20-40
Texture Heavy clay Sandy loam
pH (CaCI2) 4.36 4.82 4.25 4.60 N (%) 0.14 0.02 0.12 0.03 C.O. (%) 2.38 0.53 2.45 0.75 S.B. (%) 83.97 96.57 39.58 47.50 CEC (cmol(+) kg-1) 6.69 9.79 2.60 0.74 K (mg kg-1) 133.64 114.66 70.82 24.04 Na (mg kg-1) 19.72 31.33 5.28 3.41 Ca (mg kg-1) 559.57 939.21 105.63 37.63 Mg (mg kg"1) 226.11 492.37 19.89 8.90 P (mg kg-1) 8.87 12.87 21.98 13.74 AI (mg kg-1) 1225.35 970.16 1955.02 1913.41 2.4.2 Foliar analysis
Foliar samples were collected in mid-august of each growing season. Overall 1620 leaves were collected on fully expanded leaves located in the upper part of trees as follow: 15 leaves (on 2 trees) x 18 fertilizer treatments x 3 clones x 2 repetitions. We
grouped 2 repetitions together in order to decrease analyses costs. Leaves were then air-dried at constant weight, ground and digested in a solution of sulphuric acid (H2S04), peroxide (H202) and selenium catalyser (Se) (Parkinson and Allen 1975). N was calibrated by flow injection analysis (FIA), while P, K, Ca and Mg were also
digested in a solution of H2S04-H20 2-Se and then determined by ICP analysis (Perkin Elmer plasma model 40). N and P foliar concentrations were used to
calculate N :P ratios of each tree from the nine possible combinations between N and P fertilizers for the first and second growing seasons. Others fertilizer combinations were not included asK may affect uptake ofN and P. Calculated N:P ratios of each clone were compared to some critical N:P ratios found in the literature (Koerselman and Meuleman 1996; Tessier and Raynal2003; Gueswell2004).
The field standards for N, P, K, Ca and Mg presented in this study consist of foliar nutrient concentrations and ratios of the 18 best growing trees (high yielding groups) of each clone independently of treatments. The cut-off limit between the fast and the slow growing groups was 75 %of maximal yield (Needham et al. 1990). The high yielding groups were equally composed from trees located at both sites in order to alleviate bias due to specific soil conditions on a site and to encompass a greater range of foliar nutrients data. One DRIS formula per clone (table 2.3) was necessary to give accurate diagnostic because clones showed different optimum nutrients ratios and different growth responses to fertilizers (Annex 4). Hence, three DRIS norms (table 2.4) are presented to evaluate their efficiency in detecting nutrient imbalances of first-year unfertilized trees. Of the three possible nutrients ratios (e.g. NIP, PIN or
N*P) used to express growth performance, the one with the highest variance between the fast and the slow growing groups of trees was chosen because it also maximizes the chances to detect a nutritional imbalance. In our case, no product (multiplication) ratio resulted in the highest variance between the two groups.
Table 2.3: DRlS formulas determined by the variance of nutrient ratios between the fast and the slow growing groups of each hybrid poplar clone.
clone
747210
915005
915319
DRlS formulas
N index=[+ f (NIP)+ f (N/K)- f (CaiN)+ f (NIMg)] I 4 P index=[- f (NIP)- f (KIP)+ f(PICa) + f (P/Mg)] I 4 K index [- f (NIK) + f (KIP)+ f (K/Ca) + f (K/Mg)] I 4 Caindex = [+ f(Ca/N) f(PICa)- f(K/Ca) + f(Ca/Mg)] I 4 Mg index= [- f (NIMg)-f (P/Mg)- f (K/Mg)- f (Ca/Mg)] I 4 N index [- f (PIN)- f (KIN)+ f (NICa) + f (NIMg)] I 4 P index=[+ f(P/N) + f(PIK) + f(PICa) + f(P/Mg)] I 4 K index [ + f (KIN)- f (PIK)- f (CalK) - f (Mg/K)] I 4 Ca index=[- f(NICa) f(PICa) + f(Ca/K)- f(MgiCa)] I 4 Mg index= [- f (NIMg)- f (P/Mg) + f (MgiK) + f (MgiCa)] I 4 N index = [ + f (NIP) - f (KIN) + f (NICa) + f (NIMg)] I 4 P index [- f(NIP) + f(P/K)- f(Ca/P)- f(MgiP)] I 4 K index=[+ f (KIN)- f (P/K)- f (CalK)+ f (K/Mg)] I 4 Ca index=[- f(NICa) + f(Ca/P) + f(Ca/K) + f(Ca/Mg)] I 4 Mg index= [- f (NIMg) + f (Mg/P)- f (K/Mg)- f (Ca/Mg)] I 4
Data was analyzed by an analysis of variance (ANOV A) using the general linear models and mixed procedures of SAS (SAS 8.3, SAS Institute Inc. 1999). Stem volume datasets were analyzed separately by clone to satisfy assumptions of homogeneity of variances. Growth measurements of clone 915319 were log transformed to homogenize the variance. There were some significant stem volumes differences at planting, so tree volume at planting was included as a covariate in the analysis. Least squares means were compared using Fisher's Protected LSD. A significance level ofp S 0.05 was chosen.
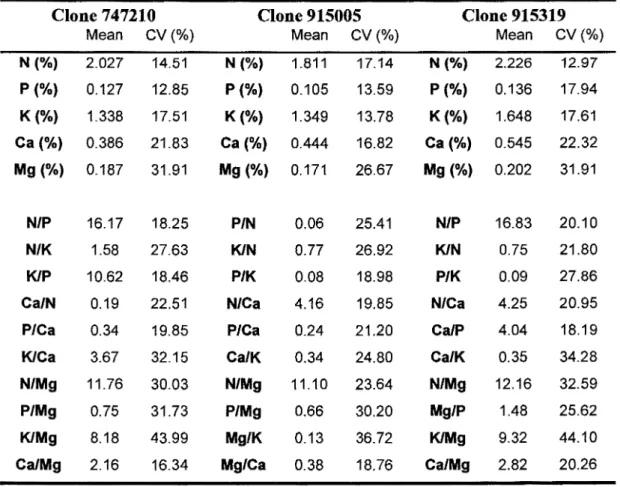
Table 2.4: DRIS norms and coefficients of variation (CV) for each clone. The means represent average nutrients ratios of first year high-yielding trees located at both sites.
Clone 747210 Clone 915005 Clone 915319
Mean CV(%) Mean CV(%) Mean CV(%)
N (%) 2.027 14.51 N (%) 1.811 17.14 N(%) 2.226 12.97
p (%) 0.127 12.85 P(%) 0.105 13.59 p (%) 0.136 17.94
K(%) 1.338 17.51 K(%) 1.349 13.78 K{%) 1.648 17.61
Ca(%) 0.386 21.83 Ca(%) 0.444 16.82 Ca(%) 0.545 22.32
Mg (%) 0.187 31.91 Mg(%) 0.171 26.67 Mg (%) 0.202 31.91
N/P 16.17 18.25 P/N 0.06 25.41 N/P 16.83 20.10
N/K 1.58 27.63 KIN 0.77 26.92 KIN 0.75 21.80
KIP 10.62 18.46 P/K 0.08 18.98 P/K 0.09 27.86
Ca/N 0.19 22.51 N/Ca 4.16 19.85 N/Ca 4.25 20.95
P/Ca 0.34 19.85 P/Ca 0.24 21.20 Ca/P 4.04 18.19
KICa 3.67 32.15 CalK 0.34 24.80 Ca/K 0.35 34.28
N/Mg 11.76 30.03 N/Mg 11.10 23.64 N/Mg 12.16 32.59
P/Mg 0.75 31.73 P/Mg 0.66 30.20 Mg/P 1.48 25.62
KIMg 8.18 43.99 Mg/K 0.13 36.72 K/Mg 9.32 44.10
Ca/Mg 2.16 16.34 Mg/Ca 0.38 18.76 Ca/Mg 2.82 20.26
2.5 Results
2.5.1 Growth response to fertilizers
Clones
At planting, trees from clone 915005 had the greatest height and basal diameter (Table 2.1 ). Trees from all three clones showed some stem dieback shortly after planting, particularly those of clone 915319 which lost more than half their length at the farmland site and a quarter of their length at the forest site (Table 2.1). Over all fertilizer treatments, trees from clone 915005 were the tallest after the first growing
season even though they had the least height growth during that season (Table 2.1 ). Over the two year period, trees from clone 747210 had the greatest basal diameter growth while those from clone 915319 had the greatest height growth (Table 2.1 ). None of the fertilizer treatments delayed fall bud formation on any of the three studied clones. Bud burst happened within one week around May 1oth for all clones and did not vary among the fertilizer treatments. Mean survival of clones 7 4 7210 and 915005 after 2 years was 98% at both sites. Mean survival was only 84% for clone 915319, mostly due to poor stock quality.
Clone 747210
At the farmland site, stem volume was increased by 48 % and 41 % in the N20 (p <
0.001) and P25 (p < 0.001) treatments, respectively, after the first year (Fig. 2.1 a,b). Trees in the N40 and P50 treatments were also significantly bigger than the control, but had similar stem volumes than the moderate fertilizer levels. After the second growing season, trees in the P25 or in the P50 treatment had 67% more stem volume than the unfertilized trees (p < 0.00 I; fig. 2.1d), while the effect of N fertilization was no longer significant (p 0.18; fig. 2.1c). First year stem volume
a) c) 500 500 :::-' 400
~
a :::-' 400!
!
300~
300 ~ "' 0 200 0 200 b b > > ~ e 100 ~ 100 1Zl 1Zl o. 0 0 20 40 0 20 40N Rate (g/tree) N Rate (g/tree)
b) 500 d) 500 b b ~ 400 :::-' 400 ~8
!
~ 3008
300 ~ .2 .2>
200 > 0 200 ~ 100 ~ e 100 Vl 1Zl 0 0 0 25 50 0 25 50P Rate (g/tree) P Rate (g/tree)
Figure 2.1: Mean stem volume of clone 747210 grown at the farmland site for each a) Nand b) P fertilization level after the first growing season, and for each c) Nand d) P fertilization level after the second growing season. Error bars are SEs. Bars with the same letters are not significantly different at p < 0.05.
also increased with N and P fertilization at the forest site, however this increase was smaller than at the farmland site with 30 % and 20 % greater stem volume in the N20 (p 0.001) and P25 (p = 0.04) treatments, respectively (Fig. 2.2 a,b). Again, the effect of N on stem volume was no longer significant after the second growing season at the forest site (p 0.09; fig. 2.2c) while trees in the P25 treatment had 41
% more stem volume (p 0.03; fig. 2.2d). At both sites, the addition of more P (P50 treatment) or more N (N40 treatment) did not produce further increases in stem
volume. Potassium did not have a significant effect on stem volume over the 2-year period, however it slightly increased first year stem height (p = 0.02; not shown).
a) c) 500
l
500 ~ 400: ~ 400 a a '-' I ~ ' 8 ~ 300 ~ ~ 300 .E! i ::0 0 200i
0 > > 200 e 100~
a b a j !! rz> rz> 100o-'-~,-~,
0 0 20 40 0 20 40N Rate (g/tree) N Rate (g/tree)
b) 500 d)
~ 400~
500 l ~ 400-' b b § 'i
300i
8, 1
~ 300 ~ 200 ::0 o JOO~
100 a > -b b&
0·~
~~
rz> 100 0 0 25 50 0 25 50PRate (g!tree) P Rate (g/tree)
Figure 2.2: Mean stem volume of clone 7 4 7210 grown at the forest site for each a) N and b) P fertilization level after the first growing season, and for each c) N and d) P fertilization level after the second growing season. Error bars are SEs. Bars with the same letters are not significantly different at p < 0.05.
Clone 915005
First-year volume growth of this clone at the farmland site was promoted from the interaction between Nand P (p = 0.045). The N20-P50 combination produced the greatest volume growth, with a 57 % increase above the control (Fig. 2.3). Fertilization with N or P separately did not significantly increase first year stem
volume (Fig. 2.3). After the second growing season, trees in the P25 treatment reached 63% greater stem volumes than the control (p < 0.001; fig. 2.4). Trees in the N treatments (N20 or N40) had similar stem volumes than unfertilized trees after two years (p = 0.09). Potassium did not significantly affect first or second-year stem volume at the farmland site. At the forest site, the P25 and P50 treatments produced a 28 % increase in stem volume after one growing season (p < 0.001; fig. 2.5a) and a 50 %increase after two growing seasons (p = 0.01; fig. 2.5b). N fertilization alone did not improve first year volume growth at the forest site (p= 0.36), but there was a significant interaction between N and K levels on second-year stem volume which increased by 46 % when K was added to the high N level.
250 II=NO =N20 D=N40 200 b b b
e
b ~ <!.) 150s
;:::1 a 0 >5
100...
r.J) 0 25 50 0 25 50 0 25 50 PRate (g/tree)Figure 2.3: Mean stem volume of clone 915005 for each Nand P fertilization level combinations after the first growing season, at the farmland site. Error bars are SEs. Bars with the same letters are not significantly different at p < 0.05.
600 b '"a ~ 400 (!) a :::! 0 > a 200 <l) .... r:n 0 0 25 50 P Level (g/tree)
Figure 2.4: Mean stem volume response of clone 915005 toP fertilization at the farmland site after two growing seasons. Error bars are SEs. Bars with the same letters are not significantly different at p < 0.05.
a) 150 b b 0 25 50 P Level (g/tree) b) 600 b 500
e
E- 400 <1l E ..::: 300 0 >e
200 <1l -CIJ 100 0 0 25 50 P Level (g/tree)Figure 2.5: Mean stem volume response of clone 915005 to P fertilization at the forest site after a) the first and b) the second growing seasons. Error bars are SEs. Bars with the same letters are not significantly different at p < 0.05.
Clone 915319
Similarly to clone 747210, the N20 and P25 fertilization treatments increased first year stem volume by 41% (p = 0.01; fig. 2.6 a) and 51 % (p = 0.001; fig. 2.6 b), respectively, at the farmland site. The higher doses of N or P produced a similar volume increases than the moderate doses. After two growing seasons, only P fertilization still had a significant effect on stem volume, where a 95 % increase was reached in the P25 treatment above the control (p = 0.01; fig. 2.6 c,d). At the forest site, growth of trees was increased by the interaction between N and P during the first growing season (p 0.02). Stem volume was increased by 66% in the N20-P50 treatment, compared to the control, while trees that had received N or P separately had similar stem volumes than the unfertilized trees. After the second growing season, stem volume was 69 % greater for trees in the N20 treatment at the forest site compared to the control (p = 0.02; fig. 2.7a). The P25 and P50 treatments resulted in an average 59 % stem volume increase compared to the control after two years (fig. 2. 7b ). Potassium fertilization did not significantly affect stem volume of this clone after one or two growing seasons, on both sites.
a) c) "
5
250 300~
!
"' 300 250l
a a ' - ' d) 200s
2001 8..a
150..a
150~
100 b b 0 > 100 ..1 ~ 50J
a ~ 50 J {i5 0 ~~-,---. . _, ... (I) 0 0 20 40 0 20 40N Level (g/tree) N Level (g/tree)
b) d) 300 ~ 300
l
250 J b b "'s 250-' ,.... (,) I ~ 200 ~ 200l
(J)..a
150 ~5
150 0 "0 > 100~
b b > 100 s E d) a .l!l-
50 -i en 50 (I)ol~,-IIJL,
0 0 25 50 0 25 50P Level (g/tree) P Level (g/tree)
Figure 2.6: Mean stem volume of clone 915319 grown at the farmland site for each a) Nand b) P fertilization level after the first growing season, and for each c) Nand d) P fertilization level after the second growing season. Error bars are SEs. Bars with the same letters are not significantly different at p < 0.05.
a) 300 .. b ;:;--. 250 E . (.) 'Q;' 200 E 150 :J
g
100 E $ 50 (/) 0 0 20 40 N Level (gltree) b) 300 b~
250 j (.) I ... 200 ..• Q) I~
1501 > 100] E I c7j 50~
0 0 25 50 P Level (gltree)Figure 2.7: Mean stem volume of clone 915319 for each a) Nand b) P fertilization levels, after two growing seasons at the forest site. Error bars are SEs. Bars with the same letters are not significantly different at p < 0.05.
2.5.2 N :P ratios
Mean first-year foliar N :P ratios of unfertilized trees planted at the farmland site were 18 and 17 for clones 747210 and 915005, respectively, while it was only 13 for clone 915319 (fig. 2.8 a,b,c). At the forest site, trees from clone 747210 had mean foliar N :P ratios of 13 during the first year (fig. 2.8 d), while clones 915005 and 915319 had N:P ratios of 17 and 16, respectively (fig. 2.8 e,f). Addition of Nat planting resulted in increased N :P ratios, while P fertilization resulted in decreased ratios.
R:re&Site a) d) Fertilizer T!Qltment (!}'tree) b) c) 30 .,25 0 E!20 0.. z 15j 10 5+---~~--,----~ 0 100 3)J :100 400 500 500 Stem \di.IOO(cm') 0 100 200 :100 400 500 600
Stem \dllTle (em')
35
30
0 100 3)J 300 400 500 600
Stem \dtrne (em')
~x ~ l'l20-PO
0 100 200 :100 400 500 600
Stem \Oiu'ne (em') - ¢ -N20-P25
e)
-+ ... N4().f'O
0 100 200 3J() 400 500 500
Stem \dtrne (em')
100 200 3J() 400 500 500
Stemvoii.I!Te (tm')
Figure 2.8: Relationship between foliar N:P ratios and first and second year stem volume for each Nand P fertilization level combinations and for each clone: a) 747210 at the farmland site, d) 747210 at the forest site, b) 915005 at the farmland site and e) 915005 at the forest site c) 915319 at the farmland site and f) 915319 at the forest site. Each line represents the evolution inN :P ratios from the first year to the second year. Circles around symbols at the farmland site represent fertilization treatments not significantly different at p < 0.05.
The optimal ranges of N:P ratios, i.e. the N:P ratios at which the trees had the greatest volume growth over the study period, ranged from 15-16 for clone 747210, 16-21 for clone 915005 and 14-18 for clone 915319 at the fannland site after 2 growing seasons (Fig. 2.8 a,b,c). Ranges of optimal N:P ratios were greater at the forest site, ranging 8-18 for clone 747210, 9-14 for clone 915005 and 7-17 for clone 915319 (Fig. 2.8 d,e,t). Also, N :P ratios of trees grown at the forest site generally decreased between the first and the second growing seasons.
2.5.3 DRIS indices
DRIS indices obtained for trees planted at the farmland site showed that N was the most limiting nutrient for growth of clones 915005 and 915319, while P was most limiting for clone 747210 (Table 2.5). At this site, magnesium (Mg) was the nutrient with the highest positive imbalance for all clones (Table 2.5). A slight K deficiency in relation to others nutrients was also observed for each clone located on this site. At the forest site, the DRIS indices showed a deficiency in N for all clones and, to a lesser extent, P and Mg deficiencies (table 2.5). K and Ca were found to be in supra-optimal conditions for all clones grown at the forest site.
Table 2.5: DRIS indices of first year unfertilized hybrid poplar clones calculated from field standards.
Farmland Site Forest Site
N p K Ca Mg N p K Ca Mg
Clone 747210 -5 -13 -3 +4 + 17 - 19 -4 + 10 + 15 -2
Clone 915005 -22 - 11 -5 +14 +24 -12 -7 +14 +9 -4
Clone 915319 -30 - 1 - 1 + 11 + 21 -17 -12 + 30 +4 -5
2.6 Discussion
Placed fertilization at planting successfully increased early growth of all hybrid poplar clones used in this study. At the farmland site, the greatest stem volume growth responses after the first growing season were obtained with N or P fertilization separately for clones 915319 and 747210 or in combination, for clone 915005 (Figs. 2.1, 2.3 and 2.6). Unfertilized trees of clones 747210 and 915005 had similar N :P ratios of about 17 (Fig. 2.8 a,b ). This corresponded to a N and P co-limitation, but more so P than N, as reflected by the growth response of these two clones to the fertilizers (Figs. 2.1 and 2.3). Unfertilized trees from clone 915319 had lower N:P ratios than the other clones (Fig 2.8c), suggesting that growth of this clone was more limited by N (Koerselman and Meuleman 1996; Tessier and Raynald 2003). However, its growth response to P fertilization was slightly greater than to N fertilization (Fig. 2.6). In this case, low N:P ratios did not exactly reflect a nutrient limitation but was rather a result of poor stock quality; trees from clone 915 319 had significant stem dieback at planting (Table 2.1 ), which resulted in lost nutrients and stimulated height growth to restore root-to-shoot ratios. In fact, their N:P ratios increased to similar levels to the other clones during the second growing season, reflecting more accurately the nutrient requirements of this clone.
The unimodal graphical display of N :P foliar ratios at the farmland site (Fig. 2.8 a,b,c), indicates that maximal biomass production was obtained at critical or optimal N:P ratios (Gtieswell 2004). The ranges of optimal N:P ratios varied among clones and sites, but there was a general trend showing that maximal growth was reached around a mean N:P ratio of 16.5 for all clones on both sites as defined by our DRIS norms (table 2.4). Based on our results, a N:P ratio between 13 and 18 would indicate a co-limitation by Nand P, but a greater N deficiency within the lower part of this range and a greater P deficiency within the upper part of this range.
Critical concentrations of foliar nutrients are often used alone to diagnose the nutritional state of trees (Weetman and Wells 1990). In our study, these critical concentrations would not have been useful since all clones had foliar N and P concentrations far below the levels found in the literature for Populus spp.
(Blackmon 1977; McLennan 1996; Camire and Brazeau 1998; van den Driessche 1999). Hansen (1994) also reported that clones with P. trichocarpa or P. maximowiczii parentage may have low level of foliar N and still have adequate
nutrition. However, critical concentrations used in conjunction with their ratio allow a better diagnosis accuracy, since trees with N and P concentrations below critical levels could have the same N:P ratio as trees with optimal concentrations. Moreover, foliar nutrient concentrations can also markedly change as trees age (Walworth and Sumner 1987), hence the benefit ofusing them along with their ratios.
Clones generally responded similarly to fertilizers at the forest site; however, the growth increases were smaller than at the farmland site. Even if differing soil conditions may have played a role (Table 2.2), it is probably also due to the fact that they were planted one month later in the season and thus had a shorter period of time to benefit from the fertilization. On this site, unfertilized trees of clone 747210 had lower N :P ratios than at the farmland site (Fig 2.8), suggesting a greater deficiency in N at the forest site. This diagnosis corresponded well to the DRJS indices that
showed a greater negative imbalance for N (Table 2.5), and to the growth response of this clone toN fertilization (Fig. 2.2a).
First year growth of clone 915319, which had a N:P ratio of 16, increased with Nand P fertilization, while growth of clone 915005, which had a ratio of 17, only responded to P fertilization (Fig. 2.5). These results agree with critical N :P ratios proposed by Koerselman and Meuleman (1996), as clone 915005 had N:P ratios> 16 corresponding to a P limitation, and clone 915 319 had N :P ratios = 16 corresponding to aN and P co-limitation. However, second-year stem volume of clone 915005 also benefited from the interaction between N and K (Fig. 2.6), showing the importance of considering that nutrients other that N or P may be limiting. The greater ranges of optimal N:P ratios obtained at the forest site showed that the N:P ratio method alone would not have been useful to give an accurate diagnosis of N or P limitations. These greater ranges in critical N :P ratios suggest that elements other than N or P were limiting tree growth on this site. There may have been some Mg deficiencies, as suggested by the DR1S indices (Table 2.5). However, this seems unlikely because the high foliar Mg concentrations of trees planted at the farmland site accentuated the Mg deficiency diagnosed by the DR1S indices for trees located at the forest site, since high-yielding trees of both sites are included into our DRlS norms. When we used standards developed for poplar D38 (Populus deltol'des Marsh.) in a greenhouse trial by Leech and Kim (1981) to diagnose the nutrition state of our clones, no Mg deficiencies were then detected. In order to alleviate this problem of diagnosis when site conditions differ, a greater spectrum of site conditions should be included into the DR1S calculations for a specific clone. The main limitation of the DR1S method with forest crops is often the lack of foliar nutrient concentration data for high-yielding populations from which to derive the field standards (Weetman and Wells 1990).
The general decrease in N:P ratios between the first and the second growing season at the forest site reflects an increase in P and a decrease in N uptake, perhaps because of the longer lasting effect of P fertilization or possibly because of the higher available soil P concentration on this site (table 2.2). Optimal or critical N:P ratios can vary widely for different types of ecosystems, with lower ratios for upland vegetation compared to wetland vegetation (Tessier and Raynald 2003). In their literature review on critical N:P ratios, Tessier and Raynal (2003) report critical N:P ratios around 11 for upland vegetation, and that higher ratios would indicate limitations in P only. Our growth results, however, clearly show that trees were limited by both N and P with N :P ratios around 16.5.
Soil available P was low at both sites (Table 2.2), in comparison with suggested minimum concentrations of 37 mg·kg-1 for optimal hybrid poplar growth (van den Driessche 2000). This is probably why P fertilization was so important in increasing growth of all clones. However, the moderate level of triple superphosphate (25 kg ha·
1
of P) was in most cases sufficient to maximize tree growth. P applied at planting was still increasing growth during the second year, while N was probably leached or exhausted during the previous year (Hauck 1968).
2. 7 Conclusion
Placed fertilization at planting was an effective management tool to improve early growth of hybrid poplar plantations established on heavy clay and sandy loam textured soils typical of the region. A moderate application of25 g/tree ofP fertilizer increased stem volume by an average of 63 % over the 2-year period. This study showed that it is possible to get a certain predictive accuracy with N :P ratios when N and P were mainly limiting, but should be used in conjunction with critical foliar nutrient concentration to maximize reliability. Because it considers more nutrient
ratios, the DRIS method has better predictive accuracy, especially when nutrients other than N or P are limiting. The use of a larger spectrum of high-yielding trees of each hybrid poplar clone growing at different sites across the region will refine the DRIS field standards and result in better nutrition diagnoses and fertilization recommendations.
2.8 Acknowledgements
This research was funded by the CRSNG-UQAT-UQAM Industrial Chair in Sustainable Forest Management, the University of Quebec in Abitibi-Temiscamingue, Canada Economic Development and the Ministry of Natural Resources (MRNQ). We also thankS. Brais and C. Camire for their comments and numerous field technicians.
2.9 References
Agriculture Canada Expert Committee on Soil Survey. 1987. In: The Canadian System of Soil Classification. 2nd edition. Publication 1646. Research Branch, Agriculture Canada, Ottawa, Ontario, 164 p.
Amacher, M.C., Henserson R.E., Breithaupt, M.D., Seale, C.L., and LaBauve, J.M. 1990. Unbuffered and buffered salt methods for exchangeable cations and effective cation-exchange capacity. Soil Sci. Soc. Am. J. 54:1036-1042.
Baldock, J.A., and Burgess, D. 1995. Influence of fertilizer placement and form of nitrogen on the growth of hybrid poplar at a site in Eastern Ontario. In: Karau J. (Compiler) Proc. Can. Energy Plantation Workshop, Gananoque, ON, pp. 67-71.
Barneoud, C., Bonduelle, P., and Dubois, J.M. 1982. Manuel de Populiculture. AFOCEL, Nangis, Paris, 319 p.
Beaufils, E.R. 1973. Diagnosis and Recommendation Integrated System (DRIS). University ofNatal, South Africa. Soil Sci. Bull. No. 1, 132 p.
Blackmon, B.G. 1976. Response of Aigeiros poplars to soil amelioration. In: Proc. Symp. Eastern Cottonwood and Related Species. Greenville, MS. Edited by B.A. Thielges and S.B. Land Jr., pp. 344-358.
Blackmon, B.G. 1977. Effects of fertilizer nitrogen on tree growth, foliar nutrient and herbage in eastern cottonwood plantations. Soil Sci. Soc. Am. J. 41:992-995.
Brown, K.R., and van den Driessche, R. 2002. Growth and nutrition of hybrid poplars over 3 years after fertilization at planting. Can. J. For. Res. 32:226-232.
Brown, K.R. and van den Driessche, R. 2005. Effects of nitrogen and phosphorus fertilization on the growth and nutrition of hybrid poplars on Vancouver Island. New For. 29:89-104.
Camire, C., and Brazeau, M. 1998. Culture des genres Populus et Larix au Quebec: sols, exigences nutritionnelles et productivite. Report presented to the Min. Res. Nat, Qc., 115 p.
Chapin, F.S., Tryon, P.R., and Van Cleve, K. 1983. Influence of phosphorus on growth and biomass distribution of Alaskan taiga tree seedlings. Can. J. for. Res. 13:1092-1098.
Conseil des Productions Vegetates du Quebec. 1988. Methodes d'analyse des sols, des fumiers et des tissus vegetaux. Commission des sols, section methodologie. Quebec (Canada). AGDEX, 533 p.
Environment Canada. 2 004. Canadian climate normals or averages 1971-2000.
Available at: http://www.climate.weatheroffice.ec.gc.ca
Gagnon, H., Numainville, G., and Robert, D. 1991. Instructions pour la collecte informatisee des donnees dans les dispositifs. Service de !'amelioration des arbres, Ministere des Forets, Quebec, 26 p.
Garbaye, J. 1980. Nutrition minerale et production des peupliers « Robusta » et « 1-214 » en populiculture traditionnelle dans le nord du bassin parisien. Ann. Sci. For. 37:159-172.
Grondin, P. 1996. Ecologic forestiere. In: Manuel de foresterie. Presses de l'Universite Laval, Quebec, pp.l35-279.
Gueswell, S. 2004. N:P ratios in terrestrial plants: variation and functional significance. Tansley review. New Phytol. 164:243-266.
Hansen, E.A. 1994. A guide for determining when to fertilize hybrid poplar plantations. USDA For. Ser., North Central For. Exp. Sta .. , Res. Pap. NC-319, 7p.
Hauck, R.D. 1968. Forest Fertilization: theory and practice. Papers presented at the Symposium on Forest Fertilization. Gainesville, Florida, pp. 46-57.
Ingestad, T. 1974. Towards optimum fertilization. Ambio. 3:49-54.
Ingestad, T. and Lund, A.B. 1986. Theory and techniques for steady state mineral nutrition and growth of plants. Scand. J. For. Res. 1:439-453.
Jones, C.A. 1981. Proposed modifications of the diagnosis and recommendation integrated system (DRIS) for interpreting plant analyses. Commun. Soil Sci. Plant. Anal. 12:785-794.
Koerselman, W., and Meuleman, A.F.M. 1996. The vegetation N:P ratio: a new tool to detect the nature of nutrient limitation. J. App. EcoL 33:1441-1450.