BIOMONITORING OF DIOXINS AND PCBS IN HUMAN SERUM :
SPE-LC-GC-IDHRMS FOR HIGH THROUGHPUT SUB-PPT LEVEL
MEASUREMENTS
Focant J.-F., Eppe G., Massart A.-C., Scholl G., Pirard C., De Pauw E.
Center for Analysis of Trace Residues (CART), Mass Spectrometry Laboratory, University of Liège, Allée de la Chimie 3, B6c, B-4000 Liège, Belgium. E-mail: [email protected]
INTRODUCTION
Human biomonitoring consists in the assessment of the internal dose exposure of individuals by measuring a toxicant level in body matrices. In the case of lipophilic compounds like PCDD/Fs and PCBs, relevant matrices are adipose tissues, blood, and milk. Blood appears as the preferred matrix as it can be relatively easily obtained by intravenous withdrawing from any individual without inconvenients of other matrices. Considering blood for analysis however has the disadvantage to lower the target compound levels as the lipid content is below 1% in weight. Enrichment procedures followed by ultra sensitive detection devices are therefore required to ensure proper detectability and measurements. Gas chromatography (GC) coupled to 13C-based isotopic dilution (ID) high resolution mass spectrometry (IDHRMS) is the hyphenated instrumentation of choice to measure ultra-trace levels (detection limits at the p.p.t. level) of PCDDs, PCDFs, and PCBs. Analytical measurement methods based on the use of GC-IDHRMS can easily isolate and quantify the target toxic compounds, namely, the 2,3,7,8-substituted PCDD/F congeners as well as the non-ortho (NO) and mono-ortho-PCB (MO-PCB) congeners that have been assigned a toxic equivalent factor (TEF) by the WHO, but also the so-called indicator (I-) PCBs. However, for a durable routine use, GC-IDHRMS requires the extracts subjected to measurement to be of an extremely good quality (e.g. to be free of matrix interferences responsible for MS ion suppression). It is therefore mandatory to implement a robust sample preparation procedure prior the measurement step. However, it is as important to minimize the time and resource consuming aspect of such a complex procedure to allow the validation and use of the method on a routine basis.
Solid phase extraction (SPE) based on different formats and sorbents has been considered by many groups to complete the extraction step. Among the available sorbents, octadecyl bounded silica and polymer-based sorbents are the more widely used due to their large spectra of application and their robustness over a wide range of extraction media. SPE can also easily be automated. Because of the non selective aspect of the extraction step, a clean-up procedure has to be present to further purify the samples and isolate the analytes of interest from co-extracted matrix components. Based on the use of reported efficient sorbents, Lapeza et al. reported in 1986 on an automated apparatus capable of sequentially clean-up series of extracts. The system matured over the years to offer parallel operation mode and finally became one of the most used automated clean-up system in the field of dioxin analysis. It is based on the use of disposable columns made of sorbents such as silica, alumina, Florisil, C18, biobeads, and dispersed carbon. This apparatus acts as a fat remover and is also responsible for the fractionation of the analytes into sub-classes suited for GC separation and MS measurement1. Its use allows the fast and reliable production of clean extracts for GC-IDHRMS analysis.
The purpose of the present project was to optimize an updated multi-step procedure based on C18 SPE, automated multi-column clean-up, and GC-IDHRMS for the measurement of selected PCDD/Fs and PCBs in human serum under strong QA/QC criteria. This was required by our routine laboratory, which is confronted to the following challenges: 1) measurements are to be performed in samples that contain decreasing levels of toxicants, 2) available sample sizes are decreasing, 3) the demand in terms of sample throughput is increasing.
928
Sample preparation and analysis
EXPERIMENTAL
Chemicals, consumables and samples
All information on solvents, sorbents, labeled standards, equipments, and Quality control (QC) procedures can be found in a previous report2. QC samples consisted in foetal calf bovine serum fortified with PCDD/Fs and PCBs. The mean level was 280 pg TEQ/L (157±15 pg TEQ/L for PCDD/Fs, 106±14 pg TEQ/L for NO-PCBs, 16±2.5 pg TEQ/L for MO-PCBs). QC and unknown serum samples were stored at -20°C prior to analysis. QC and unknown sample sizes were 20 g.
Lipid content determination
Enzymatic lipid determinations of unknown samples were performed on a dedicated 5mL serum bag. Triglycerides, total cholesterol, non-esterified (free) cholesterol, and phospholipids B were targeted and measured. A summation method was used to estimate the total lipid concentrations. Lipid concentration of unknown samples ranged from 4 g/L and 17 g/L. Manual solid phase extraction (SPE)
SPE was carried out using 2g/15mL non-endcapped (-Si(Me3)) octadecyl SPE disposable cartridges. Series of 20 samples were processed on manifolds. Formic acid and water were added to samples prior to to extraction. SPE cartridges were gravimetrically conditioned using methanol and water. The internal standard mixture was
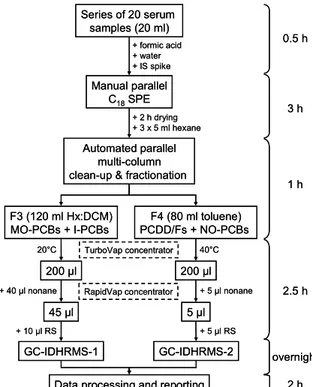
Figure 1. Procedural scheme for the PCDD/Fs and PCB measurement in human serum.
added on the SPE frits just before the sample. Water was used to wash the sample bottles and cartridge barrels. Cartriges were dried under water pump suction for 2 hours. Disposable sodium sulfate cartridges were then placed at the bottom of the C18 cartridges. The elution took place using hexane (3 x 5 mL). Those extracts were processed the same day for clean-up and fractionation (see Figure 1 for complete procedural scheme).
Automated clean-up and fractionation
The clean-up and fractionation in sub-groups of analytes was performed by automated multi-sorbent (silica, alumina, and carbon-based) liquid chromatography (LC) using the Power-Prep System (FMS Inc.). Sizes of Teflon disposable columns were 4 g (2 g acid, 1 g basic, and 1 g neutral) for silica, 4 g for basic alumina, and 0.35 g of carbon dispersed on Celite for the carbon column. The total run time was 45 min, plus a preventive decontamination program of 15 min. The MO- and I-PCBs were isolated in 120 mL of hexane-dichloromethane (1:1) (F3) and the PCDD/Fs and NO-PCBs were collected in 80 mL of toluene (F4). Evaporation using a TurboVap II Workstation and a RapidVap was performed after addition of nonane as keeper. The final volumes were 90 µL for the MO- and I-PCBs fraction (F3) and 5 µL for the PCDD/Fs and NO-PCBs fraction (F4). 10 µL and 5 µL of syringe (recovery) standards were added to the GC vials prior to injection for F3 and F4, respectively.
Alternative manual clean-up for PCBs
The alternative procedure for the measurement of I-PCBs was carried out on 10 g sample sizes. SPE was followed by manual chromatography using 4 g acidic silica, 1 g partially deactivated alumina, and 0.5 g sodium sulfate. The evaporation procedure was similar as described earlier.
GC-IDHRMS measurement
Measurements of F3 and F4 were performed separately on two different GC-MS setup. The total separation time was 30 min for F3 and 55 min for F4. All details concerning GC and MS operation as well as QC checks and BC monitoring are available elsewhere2.
Series of 20 serum samples (20 ml) Manual parallel C18SPE Automated parallel multi-column clean-up & fractionation
+ formic acid + water + IS spike + 2 h drying + 3 x 5 ml hexane F3 (120 ml Hx:DCM) MO-PCBs + I-PCBs F4 (80 ml toluene) PCDD/Fs + NO-PCBs TurboVap concentrator RapidVap concentrator 200 µl 200 µl 20°C 40°C 45 µl 5 µl + 40 µl nonane + 5 µl nonane GC-IDHRMS-1 GC-IDHRMS-2
Data processing and reporting
+ 5 µl RS + 10 µl RS 0.5 h 3 h 1 h 2.5 h 2 h overnight Series of 20 serum samples (20 ml) Manual parallel C18SPE Automated parallel multi-column clean-up & fractionation
+ formic acid + water + IS spike + 2 h drying + 3 x 5 ml hexane F3 (120 ml Hx:DCM) MO-PCBs + I-PCBs F4 (80 ml toluene) PCDD/Fs + NO-PCBs TurboVap concentrator RapidVap concentrator 200 µl 200 µl 20°C 40°C 45 µl 5 µl + 40 µl nonane + 5 µl nonane GC-IDHRMS-1 GC-IDHRMS-2
Data processing and reporting
+ 5 µl RS + 10 µl RS 0.5 h 3 h 1 h 2.5 h 2 h overnight
929
Sample preparation and analysis
RESULTS AND DISCUSSION Extraction
20 g sample size was the minimum amount of matrix required to ensure proper detectability of the target analytes (0.5% lipid content, then 0.1 g of lipids; 1 ppt 2,3,7,8-TCDD, then 100 fg/20 ml; 80 % recovery rate+injection of half of the extract, then 40 fg injected, which is close but still above (S/N>3) our iLODs). An iLOD stability study over a 6 months period showed an average S/N of 19 for 80 fg injected every time a series of 20 unknowns was injected. The use of a 2 g C18 sorbent bed size was validated. It showed to be adequate to proper matrix dispersion and good analyte retention prior to organic solvent elution. This small size also cut down prices and reduces solvent consumption compared to the 10 g sizes usually used. The volumes of solvents were reduced to 20 mL of formic acid, 12 mL of methanol, and 40 mL of water per sample. The 2h SPE drying step and the use of disposable sodium sulphate cartridges were crucial to ensure efficient water removal without adding water miscible solvent (important risk of partially eluting analytes of interests) nor using centrifugation. The clean-up procedure that employs deactivated alumina to retain the analytes is ultra-sensitive to water. The sample pre-treatment and extraction step required less than 4 h per series of 20 samples and per operator. The addition of the multi-analyte internal 13C-labelled standard (30 µL of nonane) on the frit of the SPE cartridge instead of the sample was validated and permitted to improve recovery rates of 10-15% on blanks. It also reduced the risk of overestimation of the concentration when performing ID quantification because of poor miscibility of the nonane standard in samples without using more delicate methanol standards.
Clean-up and fractionation
The automated clean-up and fractionation procedure was originally developed to accommodate 1 to 5 g of lipids for multi-analyte measurement. For 20 mL serum specimen (<0.3 g of lipids), the goal was to scale down the column sizes and solvent volumes to reduce blank (BC) levels, improve mLOQs, and minimize the number of non-detected (nd) and non-reported (nr) congeners to facilitate data handling. The new silica and alumina column sizes (4 g) allowed a significant reduction of the solvent consumption while maintaining a high level of extract purity (Figure 2).
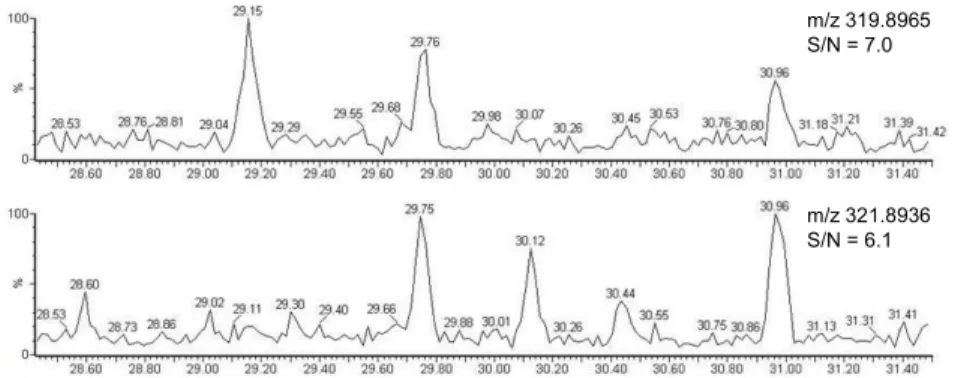
Figure 2. Unknown sample SIM chromatogram for 2,3,7,8-TCDD (tR = 29.7 min). The two native traces represent 19 fg of
2,3,7,8-TCDD injected (0.3 pg/g lipid in sample, 9 g/L lipid content).
The total solvent consumption for the clean-up and fractionation of one sample extract was 260 mL, 120 mL, and 130 mL for hexane, dichloromethane, and toluene, respectively (reduction of 40%, 20%, and 20% compared to previously reported methods3, a solvent cut of 230 L per 1,000 samples). The processing time for 10 samples in parallel was 60 min, including a 15 min preventive decontamination program, speeding-up the processing time of 20%. The following parallel semi-automated evaporation step time was 2.5h.
Procedural blanks, LODs, and LOQs
mLOQs are listed in Table 1. Although it does exist a dioxin Directive 2004/44/EC4 that gives guidelines for LOQ calculations, such as isotope ratio and retention time check, S/N 3:1, etc…, we do use additional requirements (trueness, precision) from the general IUPAC recommendations regarding analytical performances5. In practice, the precision is specified with a RSD of 10% at the LOQ. This is important for congeners with low LOQs (potentially high variations in measurements), but also for those that suffer from the influence of potentially high blank levels on the precision of the measurement. For example, in the case of HxCDFs, only the 1,2,3,4,7,8-HxCDF congener is constantly present in blanks (8.2 pg/L, SD = 0.85 pg/L, RSD
m/z 319.8965 S/N = 7.0 m/z 321.8936 S/N = 6.1 m/z 319.8965 S/N = 7.0 m/z 321.8936 S/N = 6.1
930
Sample preparation and analysis
= 10.4%, n=92). Therefore, although the LOQS for the other HxCDFs (1,2,3,6,7,8-, and 1,2,3,7,8,9-) are calculated to be 5 pg/L serum (Table 1) based on Directive 2004/44/EC guidelines, LOQ calculations for 1,2,3,4,7,8-HxCDF have to include the influence of the background contamination of the analytical procedure. The LOQ calculation approach has to rest on the estimation of the minimum amount of the congener that can
reliably be distinguished from the average amount present in the procedure blank, even if ‘LOQs’ based on
instrumental performances only are lower. In concrete terms, a one-tailed normal distribution of the blank levels can be assumed (Figure 3).
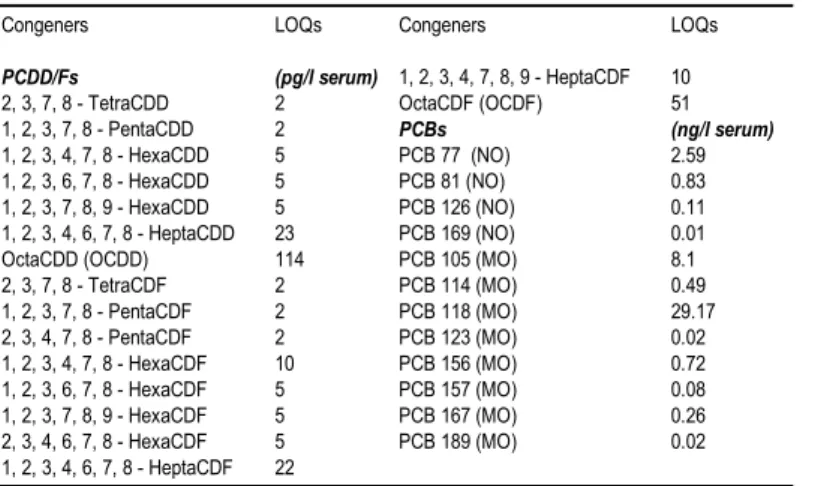
Table 1. PCDD, PCDF, and WHO-PCB LOQs for the comprehensive multi-analyte method.
Congeners LOQs Congeners LOQs
PCDD/Fs (pg/l serum) 1, 2, 3, 4, 7, 8, 9 - HeptaCDF 10
2, 3, 7, 8 - TetraCDD 2 OctaCDF (OCDF) 51
1, 2, 3, 7, 8 - PentaCDD 2 PCBs (ng/l serum)
1, 2, 3, 4, 7, 8 - HexaCDD 5 PCB 77 (NO) 2.59
1, 2, 3, 6, 7, 8 - HexaCDD 5 PCB 81 (NO) 0.83
1, 2, 3, 7, 8, 9 - HexaCDD 5 PCB 126 (NO) 0.11 1, 2, 3, 4, 6, 7, 8 - HeptaCDD 23 PCB 169 (NO) 0.01
OctaCDD (OCDD) 114 PCB 105 (MO) 8.1
2, 3, 7, 8 - TetraCDF 2 PCB 114 (MO) 0.49 1, 2, 3, 7, 8 - PentaCDF 2 PCB 118 (MO) 29.17 2, 3, 4, 7, 8 - PentaCDF 2 PCB 123 (MO) 0.02 1, 2, 3, 4, 7, 8 - HexaCDF 10 PCB 156 (MO) 0.72 1, 2, 3, 6, 7, 8 - HexaCDF 5 PCB 157 (MO) 0.08 1, 2, 3, 7, 8, 9 - HexaCDF 5 PCB 167 (MO) 0.26 2, 3, 4, 6, 7, 8 - HexaCDF 5 PCB 189 (MO) 0.02 1, 2, 3, 4, 6, 7, 8 - HeptaCDF 22 0 0.2 0.4 0.6 0.8 1 4 5 6 7 8 9 10 11 12 pg/L serum R el at iv e un it s of t h e nor m al di st ri bu ti on
Figure 3. Normal distribution of procedure blank level for congener 1,2,3,4,7,8 HxCDF.
Hence, a LOQ value of 8.2 + (1.64 x 0.85) = 9.6 pg/L or 8.2 + (2.33 x 0.85) = 10.2 pg/L is proposed at 95% and 99% level confidence, respectively. The choice between those two values depends on the acceptable level of risk the analyst is ready to take. For this congener, the presence of a background contamination doubles the value of the LOQ initially defined on S/N approach. The difference between LOQ values calculated both ways can be as large as one or two orders of magnitude for some congeners, depending on the blank level and its variability. Manual clean-up option for selected PCBs
High LOQ values are observed for some selected PCBs (Table 1) due to elevated BC levels because of the large sample size (solvents and consumables) required for PCDD/F analyses. It produces a significant number of non reportable congeners. Fortunately, this only has an impact for few congeners, NO-PCB (77,81) and I-PCBs (not listed here). The levels of those PCBs are extremely low in concentration inside the samples and their TEF are also low, which means that their absence in the TEQ calculation is not critical. The elevated LODs for PCB-105, 114, and 118 have no real impact because those congeners are present at levels above those LOQs. Nevertheless, to avoid troubles for the quantification of those PCBs (especially the I-PCBs), we have a quick manual PCB method (see experimental part) that can be carried out in parallel to the comprehensive method on 10 mL of serum. The smaller sample size permits to reduce solvent volumes and size of consumables, thus reducing blank levels and LOQs. In practice, after analyzing several hundreds of samples, it appears that spending time and resources cleaning-up extra sample aliquots to get values for those congeners might not be necessary in all studies because the problematic congeners represent only few % (<10%) of the total PCB concentration.
ACKNOWLEDGEMENTS
The authors acknowledge the University of Liège, the Walloon Region, the European Regional Development Fund (ERDF), and the National Fund for Scientific Research (FNRS) for financial support.
REFERENCES
1. J.-F. Focant, C. Pirard, E. De Pauw (2004), Talanta 63, 1101. 2. Focant J.-F., De Pauw E. (2002), J. Chromatogr. B. 776, 199.
3. W.E. Turner, T.P.C. Cash, E.S. DiPietro, D.G. Patterson Jr. (1998), Organohalogen Compd. 35, 21. 4. COMMISSION DIRECTIVE 2004/44/EC, 20.4.2004, L113/17-18.
5. The Fitness for Purpose of Analytical Methods, Eurachem guide, December 1998, http://www.eurachem.ul.pt/guides/valid.pdf