1
Thermal histories and microstructures in Direct Energy Deposition of a High
Speed Steel thick deposit
R. T. Jardin1, J. Tchoufang Tchuindjang1, L. Duchêne1, H.-S. Tran1, N. Hashemi1, R. Carrus2, A. Mertens1, A.M. Habraken1*
1University of Liège, Quartier Polytech 1, Allée de la Découverte 9 (B52), B4000 Liège, Belgium 2Sirris Research Centre (Liège), Rue Bois St-Jean, 12, B 4102 Seraing, Belgium
Abstract
The results of 2D Finite Element thermal simulations of Direct Energy Deposition of a High Speed Steel thick deposit explain the observed microstructural heterogeneities over the whole height of a 36-layer deposit. The Finite Element model is validated by the recorded substrate temperature and the melt pool depth of the last clad layer experimentally measured. The correlation between the computed thermal fields and the microstructures of three points of interest located at different depths within the deposit is carried out. The effect of both the melt superheating temperature and the thermal cyclic history on the carbides type, shape and size is discussed.
Keywords: Finite element analysis, Laser deposition, Powder processing, Solidification microstructure,
Carbide
1. Introduction
High Speed Steels (HSS) are widely used in various applications including cutting operations, high speed machining, hot stamping, moulding and hot strip mills. They withstand severe mechanical and physico-chemical stresses in service, thanks to their alloy design and to their carefully tailored microstructure. These alloys belong to the complex Fe-Cr-C-X system, where X is a strong carbide-forming element as V, Nb, Mo or W [1].
DED (Direct Energy Deposition) is an additive manufacturing technique where a powder is projected on the substrate and melted while passing through a laser beam. Very high cooling rates ranging from 103 to 107 °C/s are achieved and yield ultrafine microstructures. Advantages such as the reduction of thermal distortions, porosity, cost and machining time as well as the possibility of manufacturing material gradients through powder of different chemical compositions are the specificities of DED [2]. High temperature gradients are generated during DED leading to directional microstructures. To understand their genesis, the thermal fields predicted by Finite Element (FE) analyses often complement experiments. Yang et al. [3] studied the heat affected zone while Wang et al. [4] analyzed the melt pool. Kong et al. [5] investigated the effect of different processing parameters on the deposit height while Tran et al. [6] focused on the evolution of the microstructure in the deposit. However,
works focusing on the solidification of thick HSS deposits processed by DED are innovative. Heat tends to accumulate in such thick deposits due to the laser power of 1 to 2 kW, leading to microstructural heterogeneities within the deposit height [7].
2. Materials and Method
* Corresponding author,
2
The DED equipment of Sirris Research Centre (5-axis Irepa Laser Cladding & Nd-YAG laser operating continuously, maximum power 2kW) was used to manufacture the sample (40 x 40 x 27.5 mm³). The raw material consisted of the commercial HSS M4 powder with a chemical composition of (in wt%) 1.35 C, 4.30 Cr, 4.64 Mo, 4.10 V, 5.60 W, 0.34 Mn, 0.9 Ni, 0.33 Si and balance Fe. The particle size ranged from 50 to 150 μm. The laser power, nozzle scanning speed, powder feed rate, and the pre-heating temperature of the 42CrMo4 substrate (40mm height, 100mm diameter) were fixed at 1100W, 6.87 mm/s, 76mg/s, 300°C, respectively. Four thermocouples were located at the four cardinal points within the substrate, 5 mm below the surface, and at 20 mm from the edge.
Using conduction-convection-radiation exchanges, the thermal field was computed by the FE code Lagamine from the University of Liège. The details of these simulations applied to DED can be found in [6]. In the present case of 36 layers, 2D simulations were preferred to save computational time. A planar mesh with element height of 0.764 mm within the deposit and coarser elements within the substrate was designed. It simulates a vertical cut in the middle of the deposit, parallel to the laser displacement. Within the deposit, the element width of 0.75 mm corresponds to half of the laser spot diameter. Based on the experimental laser beam velocity, the element birth technique models the heat source movement and the addition of material. The ambient temperature is assumed constant at 298 K. The thermal conductivity, the density and the specific heat capacity were measured for samples extracted from the deposit and the substrate [8]. The radiation emissivity factor was set to 1 and a convection coefficient of 230W/m²K was applied. The liquidus and solidus temperatures used in the model, 1677K and 1503K respectively, were obtained from thermodynamical simulation. Laser heat flux was fitted in the 2D model to obtain the range of substrate temperature experimentally measured. This inverse approach provide reliable results as already shown by [9].
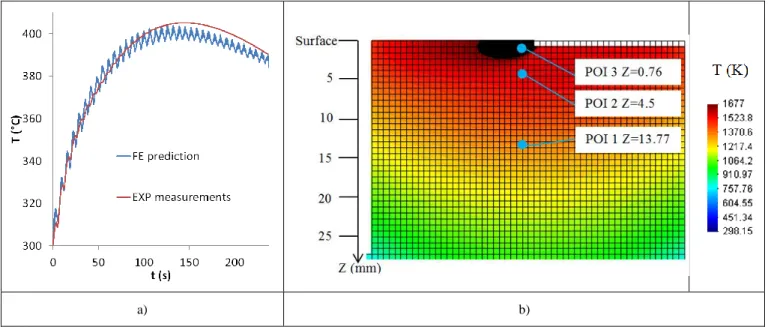
a) b)
Fig. 1 a) Computed and experimental curves of temperature versus time at one thermocouple; b) FE thermal field during the last layer deposition (temperature higher than liquidus in black color) and location of points of interest (POI) within the thick deposit.
3
Fig. 2: Predicted curves showing the thermal histories (full lines) and temperature rate (dashed lines) within the three POIs.
3. Result and discussion
Fig. 1a compares the measured and predicted temperature histories in the substrate, at one thermocouple. In addition, the 2D FE simulation (Fig. 1b) predicted the melt pool depth of the last clad layer: 2.3 mm, similar to the experimental one (2.4 mm). As discussed on a DED Ti-based alloy [6], due to high heating rates, an upward shift of the solidus was observed, toward the liquidus. Fig. 2 gathers the predicted temperature histories for the three points of interest POI1, POI2 and POI3, which are located in the central part of the clad at different depths from the free surface (Fig. 1b). Key results for POIs are provided in Table 1. The cooling rate achieved during solidification (column 4) seems to be similar for all the POIs, regardless of the initial superheating temperature. Therefore assuming a similar initial cell size for all the POIs is reasonable. However due to the occurrence of partial melting especially for POI1 and POI2, their related cell size is reduced as explained hereafter.
Table 1: Key predicted temperatures associated with the different depthss.
Depth from top surface (mm)
Peak number
Average cooling rate between peak max and min temperature (K/s)
Cooling rate between liquidus and solidus (K/s)
Max. predicted super
heating temperature T of the melt pool (K) 13.77 POI1 2nd 1148 1025 1941 3rd 1019 1019 1687* 4.5 POI2 3rd 1096 1045 1794* 4th 1035 1668 0 500 1000 1500 2000 2500 3000 100 120 140 160 180 200 220 240 260 280 300 T ( K ) -d T/d t (K /s) t (s) T POI1 dT/dt POI1 T POI2 dT/dt POI2 T POI3 dT/dt POI3 T solidus T liquidus Liquidus Solidus Peak 1 Peak 2 Peak 3
4 0.76 POI3
1st 1563 1026 2768
2nd 1216 1022 2075*
* last melting of the POI
As shown in Fig. 3, the microstructure is made of cells (martensite with few retained austenite) surrounded by a quasi-continuous network of intercellular carbides [10].
Based on Fig. 2, it can be assumed that both POI1 and POI2 are fully melted three times prior to the last solidification, whereas POI3 is melted twice. Each complete melting step corresponds to reheating above the liquidus (1677 K). In addition, subsequent partial melting steps also occur for both POI1 and POI2, because of the numerous peaks having their maximum ranging between the solidus and the liquidus. This maximum temperature within solidification range follows a decreasing trend (Fig. 2). For POI1, the partial melting steps start around the middle of the solidification range before quickly decreasing below the solidus. For POI2, the partial melting steps are more pronounced over time and present a higher average temperature compared to POI1. Such a partial melting step of the cells is related to the dendritic fragmentation phenomenon [11]. Amin-Ahmadi’s work [13] already linked this phenomenon to DED when fragmentation of dendrites appears due to applied stress created by melt flow which decreases the melting point of dendrite.
For POI1, it can be assumed that only M2C eutectics are melted while keeping the intercellular MC
unmelted or only partially melted, due to their high melting point [14]. For POI2, the more pronounced melting phenomenon generates smaller cells containing intracellular coral-shaped MC carbides. This observation can be related to back diffusion of carbides forming element within the unmelted cells in the semi-solid regime (Fig. 3b). It explains why very few intercellular MC are present in POI2, whereas intracellular MC precipitated together with the first solid under a coupled growth process. POI3 exhibits a microstructure similar to POI1. However, the size of both cells and intercellular MC carbides is higher in POI3 than in POI1 (Fig. 3a and c), confirming the refining process achieved with partial melting steps (Fig. 2).
The relative chemical composition could be obtained from BSE mode. The darkest MC carbides found within intercellular zones on both POI1 and POI3 are closed to “pure” VC whereas the brightest ones present in POI2 contain other transition elements heavier than V, such as W, Mo, Nb (Fig. 3). This result is in good agreement with the previous assumption of a longer residence time within the semi-solid state for POI2. This period allows a near partition equilibrium for many elements including V which diffuse back into the unmelted cells after being dissolved from the MC. The M2C intercellular
carbides present in each POI appear white as they contain heavy elements such as Mo and W.
a) b) c) Angular MC Rod-like MC M2C Angular MC Rod-like MC Coral-shaped MC M2C 8 µm 8 µm 8 µm
5
Fig. 3: SEM-BSE micrographs of a) POI1 with star-like MC and lamellar eutectic M2C intercellular carbides; b) POI2 with
coral-shaped intracellular MC, intercellular eutectic M2C and refined cells due to multiple melting; c) POI3 with coarse
angular MC and eutectic M2C within intercellular zones.
4. Conclusions
The FE thermal field computed for DED of HSS M4 thick deposit explains the microstructure genesis. The scientific novelties are summed up as follows:
Close to the deposit free surface, as well as at mid-height, the angular-like MC carbides precipitated in intercellular zones just after the primary cells under high superheating temperature of the melt pool. The increased superheating within the melt pool at mid-height of the deposit promotes the coarsening of the solidification phases including cells and intercellular carbides.
At intermediate depth from the deposit free surface, a lower superheating temperature and a higher number of re-melting of the material points promote the precipitation of coral-like MC carbides inside cells. They are formed together with the first solid (matrix) under a coupled growth process.
For all the locations within the thick deposit, the end of the solidification is similar, leading to the precipitation of eutectic M2C carbides.
Acknowledgments
This work was supported by Walloon Region [RW 11-1-7335 Recylclad], FNRS F.R.S. [PDR T.0039.14 and position of AM Habraken], FEDER [IAWATHA], CAREM ULiège.
References
[1] M. Boccalini, H. Goldenstein, Int. Mater. Rev. 46 (2001) 92.
[2] E. Toyserkani, A. Khajepour, S. Corbin, Laser Cladding, CRC Press LLC, Boca Raton, 2005. [3] J. Yang, S. Sun, M. Brandt, W. Yan, J. Mater. Process. Technol. 210-15 (2010) 2215.
[4] L. Wang, S. Felicelli, Y. Gooroochurn, P.T. Wang, M.F. Horstemeyer, Mater. Sci. Eng. A, 474-1 (2008).
[5] F. Kong, R. Kovacevic, Metall. Mater. Trans. B, 41 (2010) 1310.
[6] H. Tran, J.T. Tchuindjang, H. Paydas, A. Mertens, R.T. Jardin, L. Duchêne, R. Carrus, A.M. Habraken, Mater. Des. 128 (2017) 130.
[7] G.P. Dinda, A.K. Dasgupta, J. Mazumder, Surf. Coat. Technol. 206 (2012) 2152. [8] N. Hashemi, PhD thesis ULiège, 2017 https://orbi.uliege.be/handle/2268/214330 [9] H. Yin, S.D. Felicelli, L. Wang, J. Heat Transfer, 130-10 (2008) 102101.
[10] N. Hashemi, A. Mertens, H. Montrieux, J.T. Tchuindjang, O. Dedry, R. Carrus, J. Lecomte-Beckers, Surf. Coat. Technol. 315 (2017) 519.
[11] P. Grgac, M. Liptak, M. Behulova, L. Caplovic, H. G. Lindenkreuz, W. Löser Mater. Sci. Eng., 449 (2007) 658.
[12] J. Valloton, D. M. Herlach, H. Henein, D. Sediako Metall. Mater. Trans. A, 48(10), (2017) 4735. [13] Amin-Ahmadi, B., & Aashuri, H. J. Mater. Process. Technol., 210-12 (2010) 1632.