Send Orders for Reprints to [email protected]
The Ergonomics Open Journal, 2014, 7, 13-20 13
1875-9343/14 2014 Bentham Open
Open Access
Bimodal Interaction: The Role of Visual Information in Performing
Acoustic Assessment in Architecture
Aurore Defays
*,1, Stéphane Safin
2,3, Alexis Billon
4, Christine Decaestecker
5, Nadine Warzée
5,
Pierre Leclercq
3and Anne-Sophie Nyssen
11Cognitive Ergonomics Laboratory (LECIT), Université de Liège, Belgium
2Conception, Création, Compétences, Usages (C3U) Team - Lab Paragraphe EA 349 - Université Paris 8, France 3Laboratory for User Cognition and Innovative Design (LUCID), Université de Liège, Belgium
4Laboratoire des Sciences de l’Ingénieur pour l’Environnement (LaSIE), University of La Rochelle, 17042 La Rochelle
Cedex 1, France
5Laboratory of Image Synthesis and Analysis (LISA), Université Libre de Bruxelles (ULB), Belgium
Abstract: In the framework of the design process of a multimodal 3D simulation environment to support architects’
acoustic tasks, we wanted to gain a better understanding of how architects are able to discriminate the sounds using audio and/or visual inputs. This study explores how 2D pictures of rooms do support or impede the auditory evaluation of a space (specifically reverberation). The paper describes an experiment evaluating participants rankings of perceived acoustic reverberation when presented with congruent (coherent) or non-congruent (conflicting) evocative pictures of architectural spaces. We found that the congruent pictures had a positive impact on task performance while the non-congruent pictures had no significant effect. Moreover the effect of the expertise (professional background) of participants was investigated. We found differences between architects and non-architects in the way they performed the task, and they processed reverberation assessments. Taken together, the findings of this study contribute to the question of usefulness of expensive multimodal 3D simulation environment.
Keywords: Audio-visual interaction, acoustics task, architecture expertise, influence of vision. 1. INTRODUCTION
Our fascination with simulation or immersive reality often leads designers to attempt to duplicate reality and to represent the various sensory modalities (visual, auditory, haptic, etc.) that support the task, believing that multimodality improves performance. However, several studies have shown that lower-fidelity simulation environments, such as screen-based simulators or serious games, could be as useful in training or evaluation as a full-scale simulator [1]. Some studies have shown that multimodal feedback can impair performance in some contexts rather than facilitating activity especially when information conveyed by different modalities is in conflict [2-4].
Architects are able to design and build complex and beautiful forms. However, an important aspect of building’s performance is its acoustic performance. The collaboration between architects and acousticians is critical to the success of a design project but continuous exchange between them is sometimes difficult to organize during the design project. Address correspondence to this author at the Cognitive Ergonomics Laboratory (LECIT), Université de Liège, Belgium;Tel: 00 32 4 366 46 65; Fax: 00 32 4 366 29 44; E-mail: [email protected]
Architects are trained to understand space behaviours and are familiar with acoustics concepts. The calculation of acoustic absorption and reverberation time are important factors for predicting the acoustic performance of a building. During the last 50 years, there have been intense efforts to improve space acoustics, using sound models and simulations.
Within the framework of the research project AURALIAS, our first goal was to design an immersive environment combining 3D view of room models and 3D sound simulation [5-7] in order to support the architects’ acoustic tasks. However, before designing this expensive multimodal 3D simulation environment, we wanted to gain a better understanding of how architects are able to discriminate the sounds using audio and/or visual inputs.
The usual paradigm in studying multimodal integration is to make the information conveyed by two modalities either redundant (congruent) or in conflict [8-11]. In the redundant
condition, several modalities access simultaneously the same
object properties and then converge to perceive it [12]. The redundancy enhances learning economy, facilitates a unified view of the world, and sometimes guarantees a degree of sensory compensation [13-15]. In the conflicting condition, the sensory modalities receive simultaneously incongruent properties about the same object. This can lead to perceptual errors or illusion, called crossmodal or intersensory biases [16-18, 4]. Several studies have shown the influence of
visual information (called a visual capture effect) on music perception. For example, Saldana and Rosenblum [19] have shown that visual depictions of cello can influence timbre identification. In another study, Davidson [20] has attested the influence of musicians' expressivity (provided by their gestures and body movements) on the auditory judgment of a musical performance. More recently, Thompson, Russo, & Quinto [21] have demonstrated that visual information influences the perception of emotion in music. Although most of the studies showed visual capture effect, some studies have demonstrated an auditory capture effect [22], showing the influence of auditory stimulus on visual performance. For example, Sekuler, Sekuler & Lau [23] showed that in the presence of a sound, the visual perception of motion could be changed. Shams, Kamitani & Shimojo [3] demonstrated that when a single flash is accompanied by several beeps, the single flash is perceived as multiple flashes. However, they showed that this effect appeared only when a single flash was coupled with multiple beeps, but not when multiple flashes were paired with a single beep.
These different results emphasize the need to gain a better understanding of the visual-auditory integration before designing expensive simulation environment.
Even if numerous studies in the literature have examined the interaction between auditory and visual modalities in different tasks, only few studies have been dedicated to the study on the role of vision on the assessment of room acoustics. Some studies used still images to analyze auditory distance [24-26], spatial impression [27, 28] and seat preference in an opera house [29]. Valente and Braasch [30] used the video of a performer inserted into a number of virtual environments asking participants to adjust the sound rendering with its displayed room. Results showed that participants had an a priori idea of the acoustic ambience of the displayed room based on its architecture. The authors concluded that these expectations influence the acoustical evaluation of the room.
In this paper, we present an original study on the role of images in discrimination of reverberation taking into account the variable of expertise. Our project of simulator being to facilitate the architects’ acoustic tasks, we use architects as subjects. We tested first the hypothesis that even 2D static pictures of a space support the judgment of relative reverberation in order to investigate the degree of fidelity useful for the simulation environment. Then, we tested the hypothesis that conflicting visual and auditory information would impede the acoustic judgment. We finally assumed that architects might be able to compensate for the incoherence between visual and auditory input when performing the acoustic task.
2. MATERIALS AND METHODOLOGY
In order to test our hypotheses, we created two sets of material: one for the acoustic task (sound clips with different acoustic properties) and one for the visual stimuli (pictures of different rooms). We ensured that both the sound clips and the pictures were clearly discriminable. We did not try to have a strict correspondence between the sound extracts and the rooms; Our goal was to better understand the impact of
visual-audio integration on acoustic assessment and not the influence of expectations.
The following sections describe how we created these materials.
2.1. Auditory Task
With the collaboration of acousticians, we chose two sound extracts (one for each experimental phase). Reverberation (which can be related to the objective criterion of “reverberation time”, RT) is a major perceptual dimension, which characterizes the acoustics of a room [31]. In addition, this dimension is easy for non-experts in acoustics to assess [32].
Thus, sound extracts differing only in terms of their reverberation were created starting with anechoic recordings of drums and cymbals. Two anechoic motifs were composed, one motif per experimental phase, differing by their rhythm and lasting 5 s. These motifs were auralized [33] with several room impulse responses (RIRs) using the Auralias software [7, 34].
The RIRs were computed on the basis of directional echograms obtained with the broadband ray-tracing software Salrev [35]. In a first step, a simulation was carried out for a (8x10x3 m3) room with an absorption coefficient equal to 0.036. A set of echograms with an RT equal to 2.0 s was obtained for all frequency bands. The later part of the echograms (after the first 80 ms) varied with 10% steps in the reverberation times (twice the Just Noticeable Difference (JND), in order to account for the inexperience of the participants). The RIRs were obtained from the echograms using the filtered white noise method [36].
For the obtained RIRs, the RTs were evaluated between -5 and -3-5 dB and were found to be equal to 1.6 s, 1.8 s, 2.0 s, 2.2 s and 2.4 s (the variation in the sound pressure level between the RIRs was lower than 0.2 dB). Together with the anechoic motifs, ten acoustic stimuli (five per experimental phase) were obtained using the Auralias software [7, 34]. Head related transfer functions (HRTFs) were applied in order to provide a more realistic sound rendering through headphones [37]. Each acoustic stimulus included the same anechoic motif twice and lasted 12s.
2.2. Visual Stimuli
We chose a set of 13 pictures of building interiors that would evoke a different level of reverberation through their visual characteristics: form, volume, surface and absorptive material. Fourteen naïve participants were then asked to rank the pictures according to the level of reverberation they judged each one to evoke. After this pretest, a ranking became apparent. In order to validate this selection, a pairwise comparison was carried out (Wilcoxon test), leading to our retaining the five pictures with a sufficient level of significant difference of perceived reverberation (p<0.01). These five pictures are shown in Fig. (1).
2.3. Participants
Seventy students (31 men / 39 women) participated in the experiment. The average age of the participants was 25.1,
Bimodal Interaction in Assessment The Ergonomics Open Journal, 2014, Volume 7 15
with a standard deviation of 5.2 years. All participants declared normal hearing and normal vision and stated that that they had never previously taken part to a similar experiment.
In order to test for a potential effect of expertise on the task, we selected 28 architecture students (5th year students) and 42 other students (studying at the same level, mainly psychology students).
2.4. Procedure
All subjects were asked to rank the sound clips in order of increasing reverberation. Before asking participants to perform the task, we explained that we were interested in their perception of sound reverberation. We also explained to the participants that, in acoustics, the reverberation parameter represents all direct and indirect reflections of a sound, evoking the perception of a confusing sound.
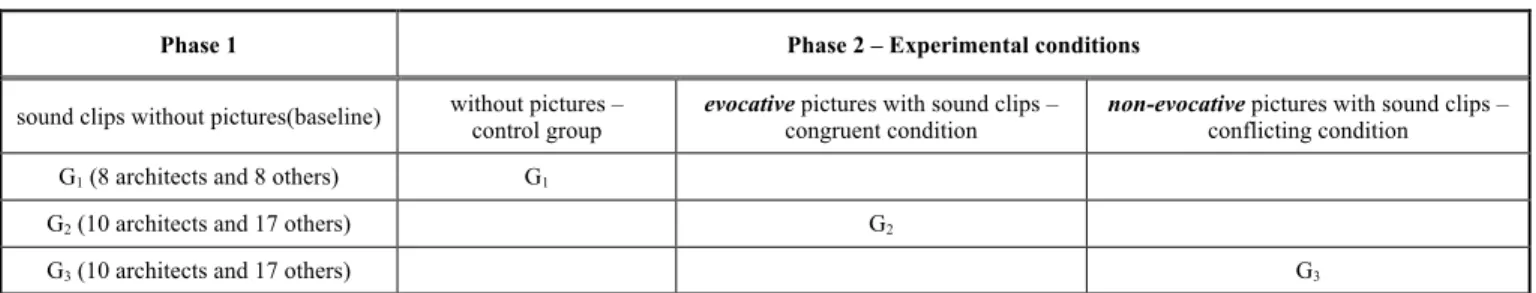
The task was undertaken in two phases (see Table 1). In phase 1, all participants were asked to perform the task without pictures. This condition allowed us to check whether the participants were able to assess the sound clips on the basis of their reverberation and to obtain a baseline for each participant.
In phase 2, subjects were divided into three groups: one group for each experimental condition: without pictures (G1),
looking at congruent evocative pictures (G2), looking at
non-congruent evocative picture (G3).
The first group (G1) repeated the task without pictures in
order for us to check for a potential training effect (control group).
Participants of Group 2 (G2) and Group 3 (G3) were
asked to give their impression of the degree to which they judged that the sound persisted or resounded in the environment shown through the picture.
G2 performed the task while looking at congruent
evocative pictures (this represented the redundant condition). In this condition, the reverberation ranking evoked by a picture was congruent with the reverberation ranking of the sound clip estimated in phase 1.
G3 performed the task while looking at non-congruent
evocative pictures (or conflicting condition). In this condition, the sound clip and the picture were randomly associated in each trial so that there was no link between the sound and the perceived reverberation of the room (as displayed in the picture).
The experiment was carried out using a laptop computer (Sony Vaio VGN-NS – Intel Core 2 Duo, 1.67 GHz – NVIDIA GeForce Graphics Card). A Matlab interface was developed in order to enable the participants to read the instructions, to play the sound clips, to display the pictures and to record their answers. The sound clips were broadcast through open-headphones (Sennheiser HD600).
The instructions were formulated so as to prevent the acoustic task turning into a visual task.
For the conditions without pictures, the instructions were: “Hello, you will hear five sound clips. Please rank these
clips in order of increasing reverberation (1 for the least reverberant to 5 for the most reverberant).”
For the conditions with pictures (congruent or non-congruent), the instructions were: “Now, we are going to
present you five more sound clips. These clips are given with a picture of a place. Please rank these extracts in order of ascending reverberation (1 for the least reverberant to 5 for the most reverberant) associated to the place.”
The participants were able to listen to the sound clips as many times as desired, to shift from one clip to another during the recording, or to stop the recording.
In order to control the homogeneity of the groups, we asked participants to complete a questionnaire regarding their experience of music, concerts and the theatre and also
their experience of dealing with plans or architectural models.
2.5. Task Performance
Performance was evaluated using two variables: accuracy and the number of replays before making a decision (revealing participants’ level of confidence in their own judgement during the task and their reaction time).
Accuracy score was calculated using the Spearman
correlation coefficient between the expected ranking (correct answers following the pretest ranking) and the participants’ given answers in phases 1 or 2. This accuracy score was variable from -1 (inverse of the accurate ranking) to +1 (accurate ranking).
The number of replays was assessed using the number of times the subject listened to the sound clips before answering.
3. RESULTS
3.1. Performance Without Pictures (Phase 1)
First, we ensured that all the groups (and sub-groups) were able to perform the acoustic task. Table 2 shows the mean accuracy score (from -1 to +1) and the mean number of replays of the three groups (and their expertise sub-groups) without pictures (sound-only condition).
Table 2. Mean accuracy scores and mean number of replays for each group (by subject pool) in phase 1 (sound-only condition).
Accuracy Number of replays
Subject Pool Mean SD Mean SD
G1 all subjects 0.51 0.42 17.87 8.34 architects 0.5 0.27 20.63 10.9 others 0.52 0.54 15.13 3.64 G2 all subjects 0.43 0.53 22.97 10.33 architects 0.61 0.42 25.2 9.65 others 0.26 0.58 20.88 10.81 G3 all subjects 0.55 0.52 20.87 7.28 architects 0.77 0.31 20.67 8 others 0.41 0.59 21 7.09
• We found no significant difference between the performance of the three groups regarding the level of accuracy (H=1.29; p=0.53) or the number of replays (H=3.80; p=0.15) ;
• We found no significant difference between the performance of architects from G1, G2 and G3 (accuracy: H=5.71; p=0.06 / number of replays: H=1.82; p=0.4) ;
• We found no significant difference between the performance of non-architects from G1, G2 and G3 (accuracy: H=1.46; p=0.48 / number of replays: H=2.85; p=0.24) ;
• We found no significant difference between G1, G2 and G3 regarding their experience of music (p=0.104), concerts (p=0.998) or the theatre (p=0.296), or their experience of dealing with plans or architectural models (p=0.749). This result supported our assessment of the homogeneity of the three groups;
• We found no significant difference between women and men for the accuracy score (U=541.5; p=0.46) or for the number of replays (U=474.5; p=0.126) ; • Finally, we found a significant difference in expertise.
Architects demonstrated a better score than non-architects (accuracy score of 0.68 vs 0.33, U=475.5; p=0.03), but there was no significant difference regarding the number of replays (U=482.5; p>0.1). These results will be discussed in section 3.3. (Impact
of expertise on performance).
3.2. Impact of Congruent or Non-Congruent Evocative Pictures (Phase 2)
In phase 2, we first compared the rankings given by the participants to the five sound clips for each experimental condition (with congruent or non-congruent evocative pictures). As shown in Figs. (2, 3), participants performed the task relatively successfully.
Moreover, our results showed that in the congruent condition (Fig. 2), the variance in the ratings decreased around the correct rankings of the sound clips. In the non-congruent condition (Fig. 3), the variance in the ratings increased with a greater spread of judgments and more errors (as seen in the confusion between sound clips 4 and 5).
We then calculated an individual performance score for each participant and grouped all scores per condition (congruent or non-congruent).
Table 1. Experimental design.
Phase 1 Phase 2 – Experimental conditions
sound clips without pictures(baseline) without pictures – control group evocative pictures with sound clips – congruent condition non-evocative pictures with sound clips – conflicting condition
G1 (8 architects and 8 others) G1
G2 (10 architects and 17 others) G2
Bimodal Interaction in Assessment The Ergonomics Open Journal, 2014, Volume 7 17
Fig. (2). Box plot of each sound for G2 (congruent condition) in
phase 2.
Regarding the accuracy scores, a repeated measures ANOVA showed a significant interaction effect between visual effect and congruence of pictures (F=6.55; p=0.013).
Indeed, Fig. (4) shows that the congruent pictures had a positive impact on the accuracy score (improving the G2
mean score from 0.43 to 0.77, T=35.5; p=0.0003). However, there was no evidence of a significant effect of the non-congruent pictures on the accuracy score (invariant score for G3 between phase 1 and phase 2, T=104; p=0.7).
Fig. (3). Box plot of each sound for G3 (non-congruent condition)
in phase 2.
The absent-visual group (control) failed to show a significant improvement in performance (accuracy: T=36.5; p=0.53) when tested a second time without visual input. This supports the conclusion that the improvement observed with congruent evocative visual input was not due to a simple learning effect.
Regarding the number of replays, the subjects performed faster with pictures (regardless of their congruence) than without (G2: from 23 to 17 replays; T=56.5; p=0.0002 / G3: from 21 to 18 replays; T=47; p=0.009/control group G1: T=54.5; p=0.75).
3.3. Impact of Expertise on Performance
We compared the performance of the architects and the non-architects in phase 1 (sound-only condition). Without pictures, the architects achieved a better accuracy mean score than the others (accuracy score of 0.68 vs 0.33, U=475.5; p=0.03) but there was no significant difference regarding the number of replays (U=482.5; p>0.1).
Table 3 shows the same pattern of results as previously. Congruent pictures both improved task accuracy (architects: T=8; p=0.015 and others: T=10; p=0.007) and decreased the
number of replays in both groups (architects: T=14.5; p=0.01 and non-architects: T=13.5; p=0.005).
Fig. (4). Means and standard errors for the performance score
(correlation between actual and perceived ranking) of Group 2 (congruent) and Group 3 (non-congruent).
There was no evidence of a significant effect on accuracy of non-congruent evocative pictures in either group (architects: T=9; p=0.11 and others: T=25; p=0.27). There was a significant decrease in the number of replays in the architect group (T=4; p=0.028) but not in the non-architect group (T=20.5; p=0.081). However, the architects who were shown non-congruent evocative pictures showed a decreased score, although this difference was not significant. When the non-architects were shown the non-congruent evocative images, they were found to behave in the same exact way as in phase 1 (without pictures).
We performed a Mann-Whitney U test to check whether the ∆ accuracy score (the difference in score between the two phases, i.e. the gains/losses generated by the presence of images) was different between the groups. Our results showed no significant difference: the non-architects and the architects showed the same pattern of difference, both in the congruent condition (U=89.5; p=0.23) and in the non-congruent condition (U=33, p=0.06). Nevertheless, the difference in the non-congruent condition was close to the threshold of significance, and Table 3 shows that the architects’ performance decreased while the non-architects’ performance increased.
This result may be due to the fact that, in making their judgments, the architects relied rather on the images than on the sound, something which would have been problematic in the non-congruent condition. In order to test this hypothesis, in phase 2, we calculated a new score (picture accuracy
score) for each subject in the non-congruent condition. The
picture accuracy score is the correlation between the perceived reverberation (i.e. the ranking actually given by the subjects to the sound clips) and the visual evoked reverberation of the pictures (i.e. the “theoretical” ranking of the images, from the room (1) to the cathedral (5) – see Fig. 1).
This score was calculated in the same way as the sound accuracy score, but the picture accuracy score was linked to
the ranking of the pictures, not to that of the sound clips1. Our results showed that there was a significant difference between the picture accuracy score (correlation between judgment and pictures) and the sound accuracy score (correlation between judgment and sounds) for the non-architects (sound: 0.6; image: -0.08; T=14; p<0.01) but not for the architects (sound: 0.48; image: 0.38; T=2; p=0.95). The architects relied therefore both on the pictures and on the sounds in order to give an appreciation of the reverberation of the sound clips accompanying the non-congruent pictures. This seems to have impeded their accuracy score. By contrast, it seems that the non-architects based their judgments only on the sounds: their performance was comparable to the control condition, and the correlation of their judgments with the pictures was close to 0 (mean: -0.08).
3.4. Participants’ Comments
Results showed no significant difference between the architects and the others regarding their experience of music (p=0.352), concerts (p=0.795) or the theatre (p=0.422). But we did find a significant difference between the two groups regarding the experience of dealing with plans (p=<0.01). As expected, the architects were found to have dealt more often with plans or architectural models than the others.
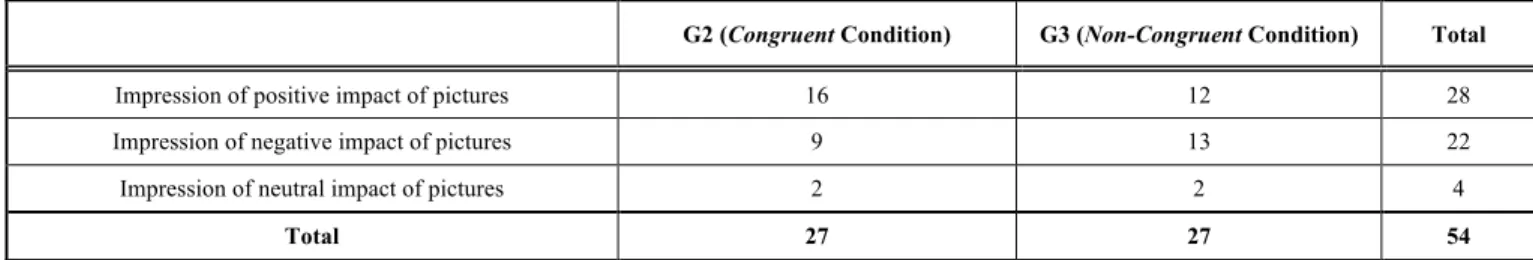
We asked the participants how they thought the pictures had influenced their acoustic evaluation. Table 4 shows that most participants felt that the pictures had a positive impact on their performance during the acoustic task (N=28) compared to an impression of a negative impact (N=22). Moreover, most participants in G2 (congruent condition) felt that the pictures had had a positive effect (positive: 16 vs negative: 9). For the participants in G3 (non-congruent condition), we found a slight difference in the impressions of the participants (positive: 12 vs negative: 13). This result suggests that when incongruent pictures were shown, participants did not know whether the pictures had really helped them or not. A Chi2 test carried out on these results
was not significant, indicating that the results demonstrate a
1Note that in the congruent condition, as the sound clips were matched to the images, the accuracy score and this new score were the same.
trend. The visual properties of the images (congruent or incongruent) and participants’ impressions were independent variables (Chi2=1.29; p=0.52).
4. DISCUSSION AND CONCLUSION
In this research, our aim was to study of the influence of visual information displayed by a static 2D picture of a building interior on architects’ perceived reverberation in acoustic stimuli, before proceeding with an advanced 3D computer simulation including visual and audio input.
First, we found, not surprisingly, that the presence of static 2D pictures supported reverberation assessment, increasing the level of accuracy and decreasing the number of replays before assessing. This supports the idea that music perception and specifically reverberation discrimination benefits from an auditory-visual experience. Other studies have shown the benefit of bimodal experience in music perception [19, 20, 21].
More interestingly, our results showed that congruent audio-visual information effectively supports reverberation judgment but that non-congruent pictures had no significant effect on the accuracy of the judgment. Yet, some studies have argued that rather than improving performance, multimodal input can impair performance when the information conveyed by the different modalities is in conflict [2, 3, 4, 11, 18]. One potential explanation could refer to the modality appropriateness hypothesis [38], which states that different modalities are better suited for different tasks. With this hypothesis, an acoustic task will favor audition because audition outperforms the vision modality in this task. In addition, Sham et al. [3] postulate that discontinuous stimuli from one modality might significantly change the perception of a continuous stimulus in another modality but that the reverse effect is less. In fact, this is the case in our study evaluating participants’ acoustic reverberation when presented continuous images.
Our analysis of the variable of expertise allowed us to take our understanding of the auditory-visual integration one step further. Our results showed that, without picture, architects performed better than non-architects, suggesting that their expertise allowed them to perform the acoustic task more efficiently than non-architects. In addition, we found
Table 3. Impact of picture properties according to participant expertise (architects vs others) - comparison between phases 1 and 2.
Mean at Phase 1 Mean at Phase 2 Statistical Significance
G2 (with congruent pictures in Phase 2)
Architects (N=10) Accuracy score 0.61 0.81 p=0.015*
Number of replays 25.20 17.87 p=0.01*
Others (N=17) Accuracy score 0.26 0.73 p=0.007*
Number of replays 20.88 15.81 p=0.005*
G3 (with non-congruent pictures in Phase 2)
Architects (N=10) Accuracy score 0.77 0.48 p=0.11
Number of replays 20.67 16.56 p=0.028*
Others (N=17) Accuracy score 0.41 0.60 p=0.27
Number of replays 21 19.5 p=0.081
Bimodal Interaction in Assessment The Ergonomics Open Journal, 2014, Volume 7 19
that, in the presence of incongruent pictures, the architects’ acoustic performance seemed to decrease and the non-architects’ performance seemed to increase (even though the difference was not significant). Our deeper analysis suggests that, in this conflicting condition, architects use both images and sound to perform the acoustic task whereas the non-architects, following the modality appropriateness hypothesis, judged the “reverberation” based on the sound
and not the image. So, we can postulate that expertise influences the “modality appropriateness” associated to a task and, that, in our case, incongruence between image and sound undermined the architect’s expertise in the acoustic task. It is even conceivable that the observed differences in the accuracy score between architects and non-architects would have been more salient if there had been a fixed number of replays for performing the task and if we had used professional architects instead of students. In the future, we would like to repeat the experiment using acousticians or music experts in order to confirm these results about expertise, incongruence and multimodal integration.
In this study, we decided to use both a series of stereotyped indoor environments that reflects different acoustics qualities and a series of sounds that was not extracted from these environments. In the future, we need to consider and examine the architects’ ability to discriminate the acoustical properties of a same environment by changing the interior properties regarding, for example, the surface, the geometry, the material, the furniture and so on. This should be done with sounds and pictures extract in these different interiors. These experiments will allow us to better understand the architects’ ability for predict the consequences of their design choices in terms of acoustic performance.
Taken together, the findings of this study contribute to the question of the usefulness of a multimodal simulation environment. Our results suggest that static 2D pictures already help architects in their acoustic assessment. There is no doubt that 3D multimodal environment would facilitate acoustic assessment. However, designers would do well to consider developing highly realistic simulation environment taking into account the users, their expertise, the type of task and the cost/benefit of multimodal support technologies. In fact, with the rise of the use of computation in architectural design, there is an opportunity to include sound as a design parameter into the analysis packages of software being adopted by the architects [39]. The challenge is not only to measure the phenomena of sound but to illustrate it in pictures so that the architects understand the acoustic consequences of their design choices.
The goal of simulation tools either 2D, 2D plus or 3D is not to replace the acoustician consultant in the design project but rather to provide an environment that favours collaboration and allows both architects and acousticians to learn from representations that illustrate the phenomena of sound in space before the design is committed to construction.
CONFLICT OF INTEREST
The authors confirm that this article content has no conflict of interest.
ACKNOWLEDGEMENTS
This research was funded in the framework of an Actions
de Recherche Concertées grant, financed by the French
Community of Belgium and a NON-FRIA grant, financed by the University of Liège. The authors wish to thank the Region of Wallonia (Belgium) for providing financial support to the Auralias project (Grant n◦616416). They also thank Rudy Ercek for his contribution.
REFERENCES
[1] Nyssen A-S, Larbuisson R, Janssens M, Pendeville P, Mayné A. A comparison of the training value of two types of anesthesia simulators: computer screen-based and mannequin-based simulators. Anes Anal 2002; 94(6): 1560-5.
[2] Calvert GA, Brammer MJ, Iversen SD. Crossmodal identification. Trend Cognit Sci 1998; 2(7): 247-53.
[3] Shams L, Kamitani Y, Shimojo S. Modulations of visual perception by sound. In: Calvert G, Spence C, Stein BE, Eds. The Handbook of Multisensory Processes. Cambridge: MIT Press 2004.
[4] Vroomen J, de Gelder B. Perceptual effects of cross-modal stimulation: ventriloquism and the freezing phenomenon. In: Calvert G, Spence C, Stein BE, Eds. The Handbook of Multisensory Processes. Cambridge: MIT Press 2004.
[5] Barron M. Auditorium acoustics and architectural design. London: Routledge (Taylor & Francis) 2009.
[6] Beranek L, Martin DW. Concert and opera halls: how they sound. J Acoust Soc Am 1996; 99: 2637.
[7] Bos L, Embrechts J-J, Eds. An interactive real-time based auralization system for room acoustics implementing directional impulse response and multiple audio reproduction modules for spatialization (the AURALIAS project). Proceedings of NAG/DAGA: Rotterdam 2009.
[8] de Gelder B, Bertelson P. Multisensory integration, perception and ecological validity. Trend Cognit Sci 2003; 7(10):460-7.
[9] O'Callaghan C. Perception and multimodal. In: Margolis E, Samuels R, Stich S, Eds. The Oxford Handbook of Philosophy of Cognitive Science: Oxford University Press 2011.
[10] Seitz AR, Kim R, van Wassenhove V, Shams L. Simultaneous and independent acquisition of multisensory and unisensory associations. Perception 2007; 36:1445-53
[11] Stein BE, Meredith MA. The merging of the senses. Cambrigde MA: The MIT Press 1993.
Table 4. Participants’ comments about the impact of pictures.
G2 (Congruent Condition) G3 (Non-Congruent Condition) Total
Impression of positive impact of pictures 16 12 28
Impression of negative impact of pictures 9 13 22
Impression of neutral impact of pictures 2 2 4
[12] Driver J, Spence C. Multisensory perception: beyond modularity and convergence. Curr Biol 2000; 10(20): R731-R5.
[13] Bouchara T, Jacquemin C, Katz BF. Cueing multimedia search with audiovisual blur. ACM Transactions on Applied Perception (TAP). 2013; 10(2):1-21.
[14] Campanella S, Belin P. Integrating face and voice in person perception. Trends Cogn Sci 2007; 11(12):535-43.
[15] Colin C, Radeau M. Les illusions McGurk dans la parole: 25 ans de recherches. L'année psychologique 2003; 103(3): 497-542. [16] Kohlrausch A, Par S. Audio-visual interaction in the context of
multi-media applications. In: Blauert J, Ed. Communication Acoustics. Berlin: Springer Verlag 2005; pp. 109-38.
[17] McGurk H, MacDonald J. Hearing lips and seeing voices. Nature 1976; 264: 746-8.
[18] Storms RL. Auditory-visual cross-modal perception phenomena. Monterey, California: Naval Postgraduate School 1998.
[19] Saldana HM, Rosenblum LD. Visual influences on auditory pluck and bow judgments. Percept Psychophys 1993; 54(3):406-16. [20] Davidson JW. Visual perception of performance manner in the
movements of solo musicians. Psychol Music 1993; 21(2):103-13. [21] Thompson WF, Russo FA, Quinto L. Audio-visual integration of
emotional cues in song. Cogn Emot 2008; 22(8):1457-70. [22] Ernst MO, Bülthoff HH. Merging the senses into a robust percept.
Trends in Cogn Sci 2004; 8(4):162-9.
[23] Sekuler R, Sekuler AB, Lau R. Sound alters visual motion perception. Nature 1997; 385:308.
[24] Calcagno ER, Abregu EL, Eguía MC, Vergara R. The role of vision in auditory distance perception. Perception 2012; 41(2):175-92.
[25] Gorzel M, Corrigan D, Kearney G, Squires J, Boland F, Eds. Distance perception in virtual audio-visuak environments. Proceedings of 25th AES UK Conference: Spatial Audio in Today’s 3D World. UK: AES 2012.
[26] Rébillat M, Boutillon X, Corteel É, Katz BF. Audio, visual, and audio-visual egocentric distance perception by moving subjects in virtual environments. ACM Trans Appl Percept (TAP) 2012; 9(4):19.
[27] Larsson P, Västfjäll D, Kleiner M. Multimodal interaction in real and virtual concert halls. J Acoust Soc Am 2004; 115(5): 2403.
[28] Nathanail C, Lavandier C, Polack JD, Warusfel O. Influence of sensory interactions between vision and audition on the perceptual characterization of room acoustics. J Acoust Soc Am 1999; 105(2): 1046.
[29] Jeon JY, Kim YH, Cabrera D, Bassett J. The effect of visual and auditory cues on seat preference in an opera theater. J Acoust Soc 2008; 123(6):4272-82.
[30] Valente DL, Braasch J. Subjective expectation adjustments of early-to-late reverberant energy ratio and reverberation time to match visual environmental cues of a musical performance. Acta Acust United Acust 2008; 94(6):840-55.
[31] Zahorik P. Perceptually relevant parameters for virtual listening simulation of small room acoustics. J Acoust Soc Am 2009; 126(2):776-91.
[32] Bech S. Selection and training of subjects for listening tests on sound-reproducing equipment. J Audio Eng Soc 1992; 40(7-8): 590-610.
[33] Vorländer M. Auralization : fundamentals of acoustics, modelling, simulation, algorithms and acoustic virtual reality. Berlin: Springer Verlag 2007.
[34] Embrechts JJ, Werner N, Lesoinne S, Eds. Auralization in room acoustics using directional impulse responses computed by sound ray techniques. Proceedings of 4th Forum Acusticum Congress. Budapest 2005
[35] Embrechts J-J. Broad spectrum diffusion model for room acoustics ray-tracing algorithms. J Acoust Soc Am 2000; 107: 2068-81. [36] Farina A, Ed. Auralization software for the evaluation of the results
obtained by a pyramid tracing code: results of subjective listening tests. Proceedings of ICA95; Norway: Trondheim 1995.
[37] Begault DR. 3D Sound for virtual reality and multimedia. Cambridge: Academic Press Professional 1994.
[38] Welch RB, Warren DH. Immediate perceptual response to intersensory discrepancy. Psychol Bull 1980; 88: 638-67.
[39] Peters B, Olesen TS, Eds. Integrating sound scattering measure-ments in the design of complex architectural surfaces. simulation and visualization, prediction and evaluation. Proceedings of 28th Conference : eCAADe 2010.
Received: July 6, 2014 Revised: November 26, 2014 Accepted: December 6, 2014
© Defays et al.; Licensee Bentham Open.
This is an open access article licensed under the terms of the Creative Commons Attribution Non-Commercial License (http://creativecommons.org/licenses/by-nc/3.0/) which permits unrestricted, non-commercial use, distribution and reproduction in any medium, provided the work is properly cited.