THE ROLE OF PARTICLES IN THE PROCESSING OF THE SOLID-STABILIZED EMULSIONS
BING WAN
DÉPARTEMENT DE GÉNIE CHIMIQUE ÉCOLE POLYTECHNIQUE DE MONTRÉAL
THÈSE PRÉSENTÉE EN VUE DE L’OBTENTION DU DIPLÔME DE PHILOSOPHIAE DOCTOR
(GÉNIE CHIMIQUE) DÉCEMBRE 2018
UNIVERSITÉ DE MONTRÉAL
ÉCOLE POLYTECHNIQUE DE MONTRÉAL
Cette thèse intitulée :
THE ROLE OF PARTICLES IN THE PROCESSING OF THE SOLID-STABILIZED EMULSIONS
présentée par : WAN Bing
en vue de l’obtention du diplôme de : Philosophiae Doctor a été dûment acceptée par le jury d’examen constitué de :
M. LEGROS Robert, Ph. D., président
M. FRADETTE Louis, Ph. D., membre et directeur de recherche M. HENRY Oliver, Ph. D., membre
DEDICATION
ACKNOWLEDGEMENTS
I want to express my sincere gratitude to my supervisor prof. Louis Fradette. I would not be able to go this far without his patience, support and guidance throughout these years. In the beginning of the Ph.D. path, I lost myself in the darkness and almost gave up. It is him, who always finds a way to lead me towards the brightness, where I could gain the confidence and motivation again. He has the magic to transform a “stone” into “gold”. Each time when I presented unexpected experiment results to him, he always imparting positive spirit to me and telling me how interesting they are. This encourages me to investigate further on the potential reasons behind, and sometimes it becomes a new discovery.I would like to thank all my jury memebers for taking your previous time to attend my defense. I would like to express my special appreciation to my close colleague Dr. Emir Tsabet, who contributes to my papers and translating the abstract. He always provides me with precious suggestions and ideas when I share results with him, and he will always encourage me saying “congrats Bing, you are closer to your defense”. His ideas are always inspiring to me and being essential to my work. I am very lucky to collaborate two papers of mine with him, his attitude towards the experiments always impress me. I would also like to thank my two other colleagues from Pickering group Rahi Avazpour and Alexandre Al-haiek. I enjoyed each group meeting we had together, from which, so many interesting ideas are fostered from the discussions for each one’s project. A thank you to Faezeh Sabri and Navid Elahipanah, who always being there for me when I am in the struggles of switching from doctoral to master. I could still remember they even made a list for me about the advantage and disadvantage of doing master and doing Ph.D. and told me not to make the rash decisions. Thank you for the support from my colleagues in URPEI group (David Vidal, Jean-michel Tucny, Shuli Shu, Bruno Blais, Charlotte Vanengeland, Bastien Delacroix, Igor Belot, MinhDung Nguyen), Office colleauges (Fatma Ben Dhieb, Adrian Carrillo, Charles Bruel, Mohaned Khalil, Yefeng Zhou) the technicians and the secretaries (Robert Dlisle, Dnaiel Pilon, Sylvie Taillon, Kalonji Mbelu, Monique Malouin, Yoan Ayassamipoulle) in the department. I appreciate the care and thoughtfulness from my friends (Chongyang Li, Zheni Ma, He Li, Hang Qu, Lili Wang, Lianfeng Zou, Qinghua Wu) and family, thank you for being loving, caring and kind to me.
Last but not least, a special thanks to the two most important people in the world, my parents, who raise me up with unconditional love and bring the sunshine into my life.
RESUME
L’utilisation de particules solides pour la stabilisation d’émulsions suscite de plus en plus l’intérêt des industriels en raison de leur capacité à générer des émulsions très stables en plus de leurs potentiels à produire des nouveaux matériaux. La présence de particules aux interfaces huile-eau peut cependant être à l’origine de problèmes de séparation au niveau industriel tel que c’est le cas dans le domaine pétrolier lors du traitement du pétrole brut ou de son dessalage. L’impact des propriétés des particules (mouillabilité, taille, forme, concentration, etc…) sur les émulsions produites a été largement étudié. Cependant, le manque d’information sur le comportement des particules durant le processing empêche l’optimisation des procédés d’émulsification et de déstabilisation. L’objectif de ce travail est donc de mettre la lumière sur le rôle exacte des particules durant les procédés d’émulsification, d’inversion de phase ou de déstabilisation d’émulsion. Ces trois opérations ont notamment été reproduites à l’échelle du laboratoire dans un dispositif standard de mélange en utilisant un système modèle avec des matériaux bien caractérisés incluant des huiles silicones, de l’eau déminéralisée et des microbilles de verre. L’évolution du type d’émulsion, de la taille de gouttes, et du taux de couverture des particules à l’interface huile-eau a été suivie en ligne en utilisant la sonde PVM®
de Mettler-Toledo selon une nouvelle méthodologie qui a été validée en comparant les résultats aux distributions de taille obtenues avec le Mastersizer 3000 (Malvern Instruments).
Le premier article a été consacré à l’analyse de l’impact des particules sur les mécanismes de rupture et de coalescence des gouttes pendant la génération d’émulsions. Il a été observé que la rupture de gouttes était le mécanisme dominant dans la zone entourant l’agitateur, particulièrement durant les premières étapes de l’émulsification, alors que la coalescence dominait la région éloignée de l’agitateur équilibrant ainsi l’effet de la rupture après quelques minutes d’émulsification. Il a ainsi été possible de dissocier les processus de rupture et de coalescence et de les analyser séparément en introduisant la sonde dans la région concernée. Les résultats ont montré que la présence de particules réduisait l’efficacité de la rupture à travers l’altération des propriétés de la phase continue tandis qu’il a été révélé que la coalescence était affectée par le rapport entre le potentiel de couverture des particules et le potentiel de génération d’interface.
Le second article a été dédié à l’étude de l’impact des particules sur l’inversion de phase catastrophique des émulsions stabilisées par des solides. Similairement aux émulsions stabilisées par des tensio-actifs, l’addition progressive de l’huile a permis l’inversion de phase catastrophique des émulsions huile/eau à des émulsions eau/huile. La comparaison des points d’inversion de phase à différentes concentrations de particules a montré que la quantité d’huile
requise pour déclencher l’inversion de phase dépendait de la quantité de particules qui affecte notamment le taux de coalescence.
Le troisième article a été consacré à l’étude de l’impact des particules sur le processus de demulsification. Il a ainsi été possible de briser des émulsions stabilisées par des solides en ajoutant des particules de plus grosse taille que celles utilisées pour la stabilisation et ayant une plus grande affinité avec la phase dispersée. Les images de la sonde PVM® ont également
révélé un processus d’attachement et de détachement des particules aux interfaces pendant le mélange. Le détachement des particules a été attribué au taux de cisaillement élevé dans la zone proche de l’agitateur. De plus, il a été observé que les particules ajoutées pendant le mélange remplaçaient les particules préalablement attachées aux interfaces. Ce comportement a été associé à la contamination des particules détachées par l’huile conduisant à une modification de leurs propriétés de surface. Ce phénomène a notamment été confirmé par des mesures de forces en utilisant la technique de la sonde colloïdale.
Globalement, en étudiant l’impact dynamique des particules pendant les procédés mettant en jeu des émulsions, ce travail a montré qu’il était possible de contrôler l’émulsification et l’inversion de phase par le biais de la concentration en particules tandis qu’il était possible de déstabiliser les émulsions par l’ajout de particules ayant certaines propriétés. Ces résultats proposent donc une approche plus écologique et moins coûteuse pour la séparation de l’huile et de l’eau en présence de particules.
ABSTRACT
The use of solid particles as an emulsion stabilizer is attracting an increasing interest of industry because of their ability to produce the well-stabilized emulsions (namely solid-stabilized emulsions or Pickering emulsions), together with their promising potential to create new materials. Nonetheless, the presence of particles at the oil-water interface generates separation problems in the industrial processes, such as in the case of crude oil dewatering, crude oil desalting.
The impact of particle properties (wettability, size, shape, concentration, etc.) on the resulting emulsions was extensively investigated by researchers. However, given the lack of consideration regarding the particle behaviour during the process, optimization of the emulsification and the demulsification of solid-stabilized emulsions appears to be a challenge. Thus, this work aims at exploring the role of particles during the dynamic processes involving emulsification, phase inversion and destabilization. These three processes were performed in a standard mixing configuration using a model system with well-characterized materials including silicone oil, demineralized water, and glass microbeads. The evolution of the droplet size, emulsion type and particle coverage at the oil-water interface was tracked using a probe-based microscope (PVM®, Mettler-Toledo), based on a new methodology validated through
comparing the obtained particle size distribution with Mastersizer 3000 (Malvern Instrument). The first paper was dedicated to analyzing the impact of particles on the droplet generation, fragmentation and coalescence during emulsification. Breakage is shown to be the predominant mechanism in the region surrounding the impeller, especially during the early stage of emulsification, while coalescence dominates in the region far from the impeller and balances breakage after a couple of minutes. These findings allow further analysis of breakage and coalescence process separately by confining the system to corresponding probing locations in the mixing tank. The results show that particles lower the breakage efficiency by altering the property of continuous phase whereas the coalescence reveals sensitivity to the ratio between particle coverage potential and interface generation potential.
The second paper was dedicated to investigating the impact of particles on catastrophic phase inversion of the solid-stabilized emulsion. Analogous to the surfactant-stabilized emulsion, gradual addition of the oil phase gives rise to the catastrophic phase inversion from O/W emulsion to W/O emulsion. Comparing the phase inversion points at various particle concentrations, we highlighted that the particle amount determines the required amount of oil to trigger the phase inversion, which is related to the variation in coalescence rate.
The third paper was dedicated to studying the impact of particles on the demulsification process. PVMÒ probe images revealed particles attachment/detachment process at generated interfaces during mixing. Particles detachment is attributed to the high shear level at the impeller zone. Additionally, we reported the replacement of freshly added particles with the particles that are already attached at droplet surfaces. Such behaviour is caused by the contamination of the detached particles with the oil phase which is evidenced by a colloidal probe technique, thus leading to the modification of surface properties. We further managed to break the solid-stabilized emulsion by adding larger particles possessing a high affinity with the dispersed phase.
Overall, through investigating the impact of particles in the dynamic processes, this work allowed better controlling the emulsification, phase inversion process by adjusting the particles concentration and achieving the destabilization by adding particles with given properties. The findings are anticipated to offer green, low-cost approaches to promoting the separation between oil and water in the presence of particles.
TABLE OF CONTENTS
DEDICATION ... III ACKNOWLEDGEMENTS ... IV RESUME ... V ABSTRACT ... VII TABLE OF CONTENTS ... IX LIST OF TABLES ... XIII LIST OF FIGURES ... XIV LIST OF SYMBOLS AND ABBREVIATIONS ... XIXCHAPTER 1 INTRODUCTION ... 1
1.1 Background ... 1
1.2 Structure of the thesis ... 2
CHAPTER 2 LITERATURE REVIEW ... 4
2.1 Features of solid-stabilized emulsions ... 4
2.1.1 Stabilization mechanism ... 4
2.1.2 Effective particle types ... 6
2.1.3 Emulsion types ... 6
2.1.4 The relationship between particle contact angle and emulsion type ... 7
2.1.5 Factors affecting the stability of the emulsion ... 9
2.1.6 Novel applications ... 11
2.2 Emulsification of solid-stabilized emulsions ... 13
2.2.1 Characteristic time ... 13
2.2.2 Interface generation ... 15
2.2.3 Particle adsorption at the interface ... 16
2.2.4 Limited coalescence ... 18
2.3 Coalescence and demulsification of solid-stabilized emulsions ... 21
2.3.2 Catastrophic phase inversion ... 23
2.3.3 Transitional phase inversion ... 26
2.3.4 Utilization of a stimuli-responsive particle stabilizer ... 26
2.4 Summary of the literature review ... 27
CHAPTER 3 OBJECTIVES ... 29
CHAPTER 4 ARTICLE 1: THE IMPACT OF PARTICLES ON BREAKAGE AND COALESCENCE PROCESSES DURING THE PREPARATION OF SOLID-STABILIZED EMULSIONS...……….30
4.1 Summary ... 30
4.2 Introduction ... 30
4.3 Materials and Methods ... 32
4.3.1 Materials ... 32
4.3.2 Experimental Methods ... 33
4.4 Results and Discussion ... 36
4.4.1 Impact of the location of the PVM® probe in the mixing tank ... 36
4.4.2 Impact of the presence of particles in the early stage of emulsification ... 37
4.4.3 Impact of adding particles during the early stage of emulsification ... 41
4.4.4 Impact of adding particles after emulsification equilibrium is reached ... 42
4.4.5 Impact of particles on coalescence efficiency ... 43
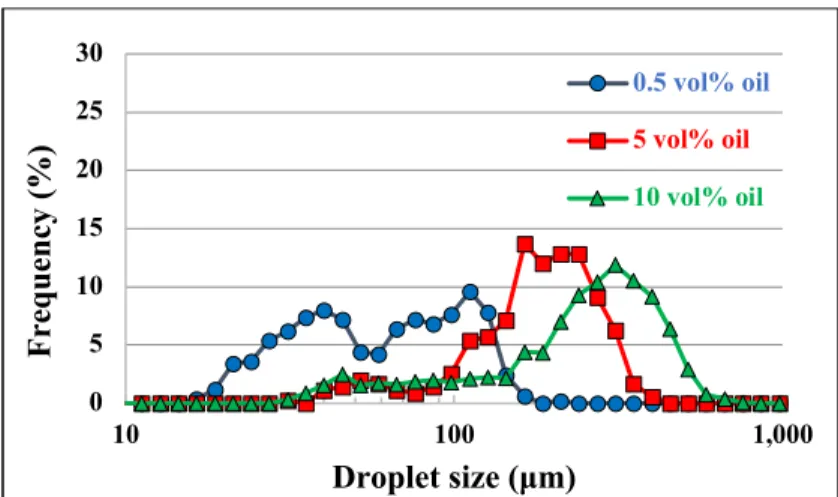
4.4.6 Impact of the dispersed phase volume fraction and particles on droplet size distribution after equilibrium ... 46
4.5 Conclusion ... 49
4.6 Reference ... 50
CHAPTER 5 ARTICLE 2: PHASE INVERSION OF A SOLID-STABILIZED EMULSION: EFFECT OF PARTICLE CONCENTRATION ... 54
5.1 Summary ... 54
5.2 Introduction ... 54
5.3.1 Materials ... 56
5.3.2 Experimental methods ... 56
5.4 Results and discussion ... 58
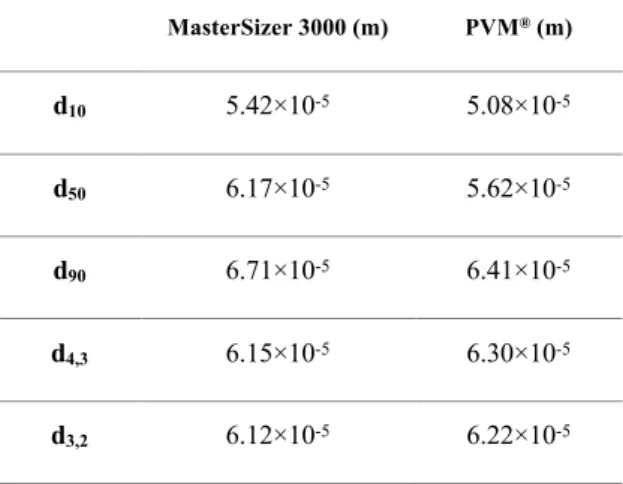
5.4.1 Validation of the PVM® approach for measuring droplet size ... 58
5.4.2 Evolution of droplet morphology during catastrophic phase inversion ... 60
5.4.3 Effect of particle concentration on phase inversion ... 62
5.4.4 Parameters of phase inversion ... 63
5.4.5 Relationship between the determination factor and the coalescence rate ... 66
5.5 Conclusions ... 70
5.6 Ackowledgement ... 70
5.7 Reference ... 71
CHAPTER 6 ARTICLE 3: DESTABILIZING SOLID-STABILIZED EMULSIONS: PARTICLE ATTACHMENT DYNAMICS AT THE INTERFACE ... 73
6.1 Summary ... 73
6.2 Introduction ... 73
6.3 Materials and Methods ... 75
6.3.1 Materials ... 75
6.3.2 Experimental methods ... 76
6.4 Results and Discussion ... 80
6.4.1 Particle exchange at the interface during emulsification ... 80
6.4.2 The impact of particle size on the particle exchange process ... 81
6.4.3 The impact of particle wettability on the particle exchange process ... 83
6.4.4 Combined effect of particle wettability and size on emulsion behavior ... 86
6.4.5 Analysis of the particle exchange mechanism ... 88
6.5 Conclusion ... 92
6.6 References ... 92
CHAPTER 8 CONCLUSION AND RECOMMENDATIONS ... 99
8.1 Conclusion ... 99
8.2 Recommendations ... 100
BIBLIOGRAPHY ... 101
LIST OF TABLES
Table 2.1 The link between particle contact angle and final emulsion type (Aveyard et al.,
2003). ... 7
Table 4.1 Tank configuration and impeller parameters ... 33
Table 4.2 Oil, water, and particle formulations ... 34
Table 5.1 Statistics of sieved particles in the 5.3×10⁻⁵~6.3×10⁻⁵ m range. ... 59
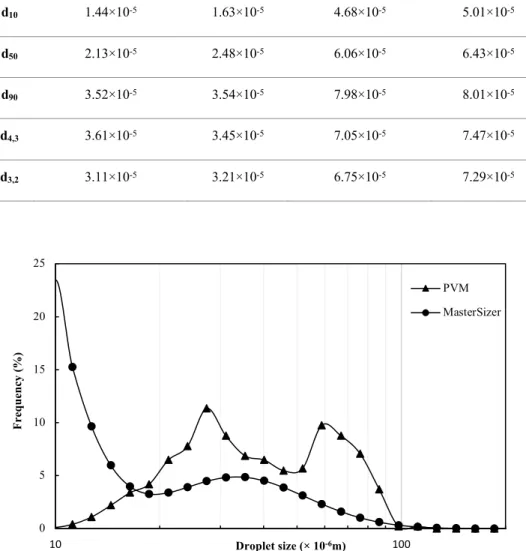
Table 5.2 Individual size distribution statistics of particles A and B measured using the PVM® and the MasterSizer 3000. ... 60
Table 6.1 Properties of the soda lime glass microspheres ... 75
Table 6.2 Properties of the silicone oil: viscosity and interfacial tension ... 76
Table 6.3 Geometrical parameters of the emulsification setup ... 77
Table 6.4 Particle types used in the corresponding cases, and names of the base emulsions .. 79
Table 6.5 Forces acting on spherical particles during emulsification ... 89
LIST OF FIGURES
Figure 2.1 The capillary forces between two particles in the liquid-liquid interface. ... 5 Figure 2.2 3D network formation in SSE (Nesterenko et al., 2014). ... 5 Figure 2.3 Schematic representation of closely packed monolayer (left) and dilute monolayer with bridge (right) (French et al., 2015). ... 6 Figure 2.4 Schematic illustration of different emulsion types (He et al., 2015). ... 6 Figure 2.5 The particle position between oil and water phase and the corresponding resulting emulsion type (Aveyard et al., 2003). ... 7 Figure 2.6 Droplet interface of simultaneously self-assembled mixing of green hydrophobic (~117°) and red hydrophilic (~59°) particles with diameters of 1 μm. The scale bar is 5 μm (Tarimala et al., 2004). ... 9 Figure 2.7 The effect of HDK® H30 hydrophobic silica concentration on the mean droplet diameter of o/w SSEs of 2-Ethylhexyl stearate oil (Frelichowska et al., 2010). ... 10 Figure 2.8 The effect of emulsification time on the stability of emulsion (Chen et al., 2005).
... 11 Figure 2.9 The effect of emulsification time on the mean diameter in different oil volume fraction at 350 cS PDMS in 10-2 M NaCl emulsion stabilized by 0.7 wt % hydrophobic silica in the aqueous phase : left: 33 vol %; the right one: 60 vol% (Binks et al., 2004). 11 Figure 2.10 Left: 3 steps process for obtaining hierarchical porous TIO2-based materials using high internal dispersed phase SSE as a template (Li et al., 2014). Right: polymer foams, hollow spheres (Blaker et al., 2009). ... 12 Figure 2.11 The schematic presentation of the emulsification process in the tank (Tsabet et al., 2015b). ... 13 Figure 2.12 The schematic presentation of the emulsification process (A) to (B) deformation; (B) to (C) breakage; (C) to (D) collision; (D) to (A) coalescence (Tcholakova et al., 2008). ... 13 Figure 2.13 Sequence of photos showing the bubble adhesion on a horizontal plane: the evolution of TPC line as a function of time (Vachova et al., 2013). ... 17 Figure 2.14 Coalescence time as a function of the surface coverage area by the particles. Square indicates the bubbles are both coated by particles whereas the diamond-shaped indicates only one bubble covered by particles (Ata, 2008). ... 20
Figure 2.15 Emulsion destabilization types (Marko et al., 2013) ... 21 Figure 2.16 Schematic presentation of the Ostwald ripening between two flocculated droplets stabilized by silica (Juarez et al., 2012). ... 22 Figure 2.17 The effect of initial particle location on the emulsion type of water-tricaprylin batch emulsions stabilized by hydrophobic silica particles (Binks et al., 2003). ... 24 Figure 2.18 The effect of mixing time on the 75 vol% O/W emulsion prepared from 2 wt % particles in water from left to right are original o/w after 2 min, multiple w/o/w after a further 10 min and mixture of multiple o/w/o and simple w/o after a 13mins’ mixing (Binks et al., 2003). ... 24 Figure 2.19 Schematic presentation of droplet formation by droplet deformation (Ohtake et al., 1988). ... 25 Figure 2.20 Upper illustrates the reaction between pH-responsive nanoparticles and 8-HQ. Lower demonstrate the emulsion stability at different pH using 8-HQ coated nanoparticles (Haase et al., 2010). ... 27 Figure 4.1 Emulsification setup ... 33 Figure 4.2 Location of the PVM® probe in the mixing tank ... 34
Figure 4.3 Evolution of droplet size in the breakage and coalescence zones during emulsification ... 37 Figure 4.4 Droplet size distributions in the breakage and coalescence zones after 12 h of emulsification (5 vol% O/W mixture without particles at an agitation rate of 700 RPM) ... 37 Figure 4.5 Evolution of droplet size during the emulsification of a 5 vol% O/W mixture at an agitation rate of 700 RPM ... 39 Figure 4.6 Impact of the amount of particles on the evolution of droplet size during the emulsification of a 5 vol% O/W mixture at an agitation rate of 700 RPM ... 40 Figure 4.7 Emulsion samples prepared using a 5 vol% oil fraction and different amounts of particles mixed at an agitation rate of 700 RPM and collected after 1, 5, and 10 min of emulsification ... 41 Figure 4.8 Impact of adding particles to a liquid-liquid dispersion (5 vol% oil fraction and sufficient particles mixed at an agitation rate of 700 RPM) ... 42
Figure 4.9 Impact of particle addition to Pickering emulsions during the emulsification of a 5 vol% O/W mixture at an agitation rate of 700 RPM ... 43 Figure 4.10 Impact on droplet size of reducing the impeller speed from 700 to 350 RPM ... 45 Figure 4.11 Impact on droplet size of reducing the impeller speed from 700 to 350 RPM ... 45 Figure 4.12 Impact of particle load on the ratio between the coverage potential and the
system-generated interface without particles (the particle conditions from left to right of the particle mass are the cases of no particles, insufficient particles, intermediate particles, and sufficient particles) ... 46 Figure 4.13 Impact of the oil fraction on droplet size distribution after equilibrium (sufficient particles at an agitation rate of 700 RPM) ... 47 Figure 4.14 Impact of the oil fraction on droplet size distribution after equilibrium (insufficient particles at an agitation rate of 700 RPM) ... 47 Figure 4.15 Impact of the oil fraction on droplet size distribution after equilibrium (no particles at an agitation rate of 700 RPM) ... 48 Figure 4.16 Impact of oil viscosity on the breakage process and droplet size distribution (Taken from Tcholakova S. et al. (2007)) ... 49 Figure 5.1 Number-based size distributions of particles in the 5.3×10⁻⁵~6.3×10⁻⁵ m range (from sieving). ... 58 Figure 5.2 Comparison of the number-based size distributions resulting from mixing the same number of particles of two sizes, A and B. The statistics of the distributions are given in Table 5.2. ... 60 Figure 5.3 Vials with a particle concentration of 2 wt% (upper section). Emulsion samples were collected from vials containing different volume fractions (10 vol% (a), 20 vol% (b), 30 vol% (c), 4 0vol% (d), 50 vol% (e), and 55 vol% (f) (lower section)) corresponding to the PVM® images of volume fractions identical to those in the vials. ... 61
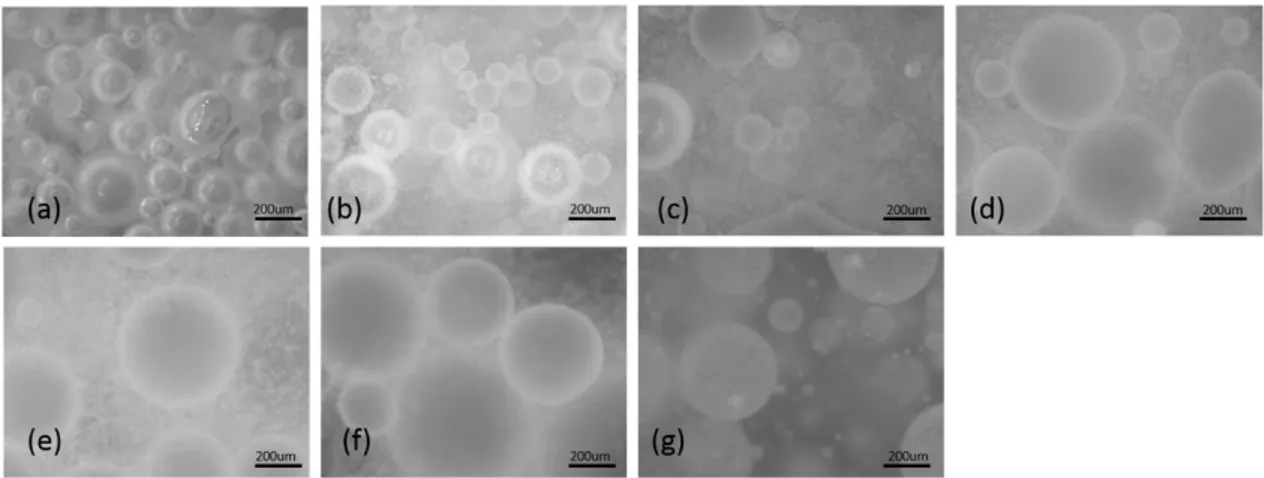
Figure 5.4 Images of emulsions obtained at a particle concentration of 8 wt% and oil volume fractions of (a) 20, (b) 30, (c) 40, (d) 50, (e) 60, (f) 65, and (g) 70 vol%. ... 62 Figure 5.5 Volume fractions of oil required for phase inversion at particle concentrations ranging from 2 to 16 wt%. ... 63 Figure 5.6 Evolution of droplet size before phase inversion at different particle concentrations (2, 4, 6 , 8, and 10 wt%). ... 64
Figure 5.7 Droplets prepared with different volume fractions of 50cSt silicone oil ranging from 30 vol% to 65 vol% plotted as a function of the hydrophilic particle concentration. ... 65 Figure 5.8 Median droplet diameter (left hand ordinate, filled points) as a function of the aqueous concentration of hydrophobic silica particles (25 nm in diameter) in a PDMS-in-water emulsion. Also shown is the ratio of the total number of particles available to the number required to produce a monolayer around all the droplets (right hand ordinate, open points) (adapted from Aveyard et al. (2003). ... 65 Figure 5.9 Equivalent surface area at the phase inversion points as a function of particle masses ranging from 1 g to 7 g. ... 66 Figure 5.10 Schematic description of two different stabilization mechanisms in a
solid-stabilized emulsion (adapted from reference (Tsabet et al., 2015a)). ... 67 Figure 5.11 Evolution in mean droplet size following the addition of the 40 vol% dispersed oil phase. The droplet sizes were tracked as a function of time for three different conditions: ... 69 Figure 5.12 PVM® images of a 40 vol% oil dispersed phase with no particles. Morphologies of
the droplets following the addition of the oil phase: (a) 5 min, (b) 20 min, (c) 40 min. .. 69 Figure 5.13 Droplet radius as a function of time for an emulsion stabilized with phosphatidylglycerol. From top to bottom, the emulsifier concentrations are 0.08, 0.2, 0.4, 0.8, and 1.6 wt% respectively (adapted from Henry et al. (2010)). ... 70 Figure 6.1 Schematic drawing of the capillary rise setup ... 77 Figure 6.2 Colloidal probe setup (Tsabet et al., 2016) ... 80 Figure 6.3 Microscope images of an O/W emulsion (10 vol% oil fraction) stabilized by different successively added particles. (a) RefEm_1; (b) addition of 35 μm white particles; (c) addition of 35 μm green particles. ... 80 Figure 6.4 Evolution of the Sauter mean diameter when 35 μm uncoated particles are added to RefEm_2 compared to an emulsion stabilized with 35 μm uncoated particles alone. ... 82 Figure 6.5 Evolution of the Sauter mean diameter when 3 μm uncoated particles are added to RefEm_3, which was stabilized with 35 μm uncoated particles, compared to an emulsion stabilized with 3 μm uncoated particles alone. ... 82
Figure 6.6 PVM® images showing particles attached at interface when fresh 35 μm particles are
progressively added to RefEm_2 (a) and when fresh 3 μm uncoated particles are progressively added to RefEm_3 (b). ... 83 Figure 6.7 Evolution of the Sauter mean diameter when fresh 3 μm modified hydrophobic particles are added to RefEm_2 compared to an emulsion stabilized with 3 μm uncoated particles alone. ... 84 Figure 6.8 Photographs of emulsions stabilized with increasing amounts of 3 µm modified hydrophobic particles added to RefEm_2 ... 85 Figure 6.9 Evolution of a destabilized RefEm_2 as a function of the type of particle added .. 86 Figure 6.10 Evolution of emulsion behavior, Sauter mean diameter, and the destabilized oil fraction when very hydrophilic 3 μm particles are added to RefEm_2 ... 86 Figure 6.11 Emulsion behavior when hydrophobic 113 μm red particles (𝜃𝑜𝑤 = 114 ± 3°) are added to RefEm_2 ... 87 Figure 6.12 Microscopic images of the droplets obtained in cases (a), (b), and (d) in Figure 11 when hydrophobic 113 μm red particles (𝜃𝑜𝑤 = 114 ± 3°) are added to RefEm_2 ... 88 Figure 6.13 Estimated attachment and detachment forces ... 89 Figure 6.14 Impact of attaching and detaching the same particle at the oil-water interface .... 90 Figure 6.15 Impact of attaching and detaching the same particle at the oil-water interface of a 1000 cSt silicone oil-in-water emulsion stabilized with 600 g of 35 µm modified particles (𝜃𝑜𝑤 = 90 ± 4°) and mixed at an agitation rate of 560 RPM ... 91 Figure 6.16 Impact of attaching and detaching the same particles at the oil-water interface .. 91
LIST OF SYMBOLS AND ABBREVIATIONS
AbbreviationsAFM Atomic force microscopy CMC Critical micelle concentration DSD Droplet size distribution DSD Droplet size distribution O/W Oil-in-water
O/W/O Oil-in-water-in-oil PSD Particle size distribution PVM® Particle vision microscope
RPM Revolution per minute SSE Solid-stabilized emulsion TPC Three-phase contact W/O Water-in-oil
W/O/W Water-in-oil-in-water
Roman letters
Acov Particle coverage potential
Af Area of the drainage film
Agen System generated interface
at Acceleration in the flow field
Ca Capillary number
D Droplet diameter
D Impeller diameter
d10 10% population below this size
d3,2 Surface mean diameter (Sauter mean diameter)
d50 50% population below this size
d90 90% population below this size
dmax Maximum droplet size
dp Particle diameter
E Free energy
Ecoal Coalescence frequency
Fatt Attachment force of particles
Fcol Collision force
Fg Particle weight
Fhyro Hydrodynamic force
Flap Laplace force exerted on particles
g Gravity force
hcr Critical thickness of the drainage film
hi Initial thickness of the drainage film
lcric Circulation between the droplet interface and the zero velocity into the droplets
Lm Molecular characteristic length
mp Mass of particles
mt Thetotal mass of water, oil and particles in the system
N Impeller speed
np Number of particles
Np Power number
P Power consumption
Pc Capillary pressure
RcrTPC Critical Radius of the three-phase-contact line
Rd Droplet radius
Re Reynolds number
Rm Macroscopic characteristic length
Rp Particle radius
RTPC Radius of three-phase contact line
S Available surface area
S0 Surface area without particles in the system
Sf Droplet surface covered by per unit mass of particles
T Temperature
tA Particle adsorption time
tc Droplet contact time
td Film drainage time
tdef Droplet deformation time
ut Settling or creaming velocity
Vd Volume of dispersed phase
vol% Volume fraction We Weber number wt% Weight percentage Pc Capillary pressure
Greek letters
µd Dynamic viscosity of the dispersed phase
ɛ Energy dissipation rate
ɛavr Average energy dissipation rate
θao Contact angle between air and oil phase
θaw Contact angle between air and water phase
θow Contact angle between oil and water phase
λ Kolmogorov length scale
ν Kinetic viscosity
π Pi
ρc Density of the continuous phase
ρd Density of the dispersed phase
ρp Particle density
σ Interfacial tension
τc Force acting on the droplet from the continuous phase
τd Viscous stress within the droplets (if the dispersed phase is of high viscosity)
τs Cohesive force acting on the droplet from the interfacial tension
ϒow Interfacial tension between oil and water
Φd Dispersed phase volume fraction
CHAPTER 1 INTRODUCTION
1.1 Background
More than a century ago, the phenomenon of particles stabilization was introduced by Ramsden. A solid-stabilized emulsion (SSE), as known as Pickering emulsion, was named after Pickering, who published the first report on the paraffin oil in water emulsion stabilized by finely divided particles (Pickering, 1907). In this report, they provided evidence for the particle adsorption and the improved stability of SSEs (Pickering, 1907). Despite its well-explained advantages, the conventional emulsion stabilized by surfactant was still the preferred choice for industries due to its various application. It is not until a few decades ago did the SSEs attract attention from the scientific field worldwide.
SSEs are encountered in petroleum production and refining process. Water and brine are accompanied by crude oil during recovery from the reservoir. The water in crude oil emulsion stabilized by naturally existing fine particles is subsequently formed under the application of high shear stresses at the wellhead and choke valves (Sullivan et al., 2002). Additionally, the water in oil emulsion can also be found during the desalting of crude oil when more water is added (Yan et al., 1997). The content of sediment and water (BS&W) are limited below 1% (often 0.5%) before it is acceptable for future transportation. Crude oil, as a non-conducting electrolyte, will not prompt corrosion. However, in response to the flow conditions, the solid particles entrapped by a layer of water may sediment to the pipeline surface, and hence causing the internal corrosion of pipeline (Larsen, 2013). Moreover, an oxidation reaction may take place when the oxygen contained in the brine water is in contact with the metal. Therefore, it is of notable importance to remove the stabilized water droplets inside.
Considering the technological challenges appears in all phases of operations (including reservoir production, transportation, and refining), controlling and understanding the destabilization is crucial. Indeed, separation of water and oil phases by gravity is usually a slow process, especially in the case of viscous oil being the external phase. If aggregated and coalesced, the water droplets can be gravitationally separated from the oil phase. For this reason, the industries aim at inducing coalescence of the water droplets by the following approaches:
1) Addition of chemical demulsifier: the demulsifier displaces the natural surfactant at the interface and influences the droplet coalescence through enhanced film drainage. The
performance of the demulsifier can be improved by increasing pH which helps in destabilizing water-in-oil emulsions. (Bonakdar et al., 2001; Mercado et al., 2014)
2) Heating the emulsions: the high temperature reduces the oil viscosity to elevate the water droplets collision, coalescence, and settling rate (Martinez-Palou et al., 2013; Salager et al, 2001).
3) Application of electrostatic field: the electrostatic field promotes the movement of conductive droplets toward the electrodes, which facilitates droplet collision and hence coalescence (Xu, 2017; Yang et al., 2015)
.
4) Diluting the continuous oil phase with light oil: the lower the oil viscosity aids in accelerating water droplets settling rate (Feng et al., 2015; Slager et al, 2001)
.
5) Addition of mineral aggregate: the hetero flocculation is augmented to facilitate the droplet settling rate (Mercado et al., 2012).
The most common method of emulsion treatment is the combination of the above approaches: heating the emulsion coupled with adding appropriate chemical demulsifier to promote destabilization, followed by using electrostatic grids to improve the gravitational separation process. Nevertheless, such combination frequently leads to a relatively high operating cost, for this reason, the industries are seeking inexpensive and environmentally friendly alternatives for crude oil dewatering. It remains a challenge to enhance the coalescence of undesired emulsions with particles present, owing to the lack of understanding of the droplets behavior during the emulsification and demulsification process.
1.2 Structure of the thesis
This thesis is mainly composed of three articles which have been published in or submitted to scientific journals, and the detailed chapters are organized as follows:
§ Chapter 1 gives a brief overview about the background and problems. § Chapter 2 presents a literature review regarding this project.
§ Chapter 3 corresponds to the first article, which involves addressing the role of particles in the breakage and coalescence processes separately.
§ Chapter 4 refers to the second article, which discusses the impact of particles in the catastrophic phase inversion processes.
§ Chapter 5 regards the third article, which presents an approach of destabilizing solid-stabilized emulsion with the aid of particles.
§ Chapter 6 provides a general discussion over the work.
CHAPTER 2
LITERATURE REVIEW
2.1 Features of solid-stabilized emulsions
Pickering emulsions offer advantages over the conventional emulsions (surfactant-stabilized emulsions) in various aspects. For example, they exhibit high resistance to droplet coalescence due to the irreversibly adsorbed particles (Binks & Whitby, 2005). In contrast, the stability of the conventional emulsions is extremely sensitive to the parameters such as system pH, salinity concentration, temperature, and oil nature (Chevalier et al., 2013). Besides, the SSEs is also known for its “surfactant-free” characteristic, allowing it to access to the potential applications such as food, pharmaceutical, cosmetic industry, where the surfactant often shows side effect.
2.1.1 Stabilization mechanism
The primary stabilization mechanism of the solid-stabilized emulsion is quite straightforward. The particles adsorb at the oil-water interface and form a densely packed particle layer, acting as a steric barrier around the droplets, which contributes to resisting coalescence (Binks et al., 2002). Apart from this, other mechanisms are proposed to explain the notable stability of solid-stabilized emulsion.
2.1.1.1 Adhesion energy and the thermal free energy
The energy ∆𝐸 required to remove a single spherical particle from the interface depends on the particle radius 𝑅+, interfacial tension 𝛾-. and three-phase contact angle 𝜃-. (Levine et al.,
1989)
∆𝐸 = 𝜋𝛾-.𝑅+0(1 ± 𝑐𝑜𝑠𝜃
-.)0 … (2.1)
Inspection of the formula gives that the adsorption free energy is proportional to the square of the particle radius. Hence, ∆𝐸 elevates dramatically with a larger particle. The most stabilized emulsion is formed when the contact angle is equal to 90°, yet, on either side of the contact angle will lead to relatively smaller adsorption energy (Aveyard et al., 2003). Given that the desorption energy of one single nanoparticle (thousands of of KBT) is far greater compared to
the thermal energy (order of KBT), the particle coating presents a high barrier against
coalescence (Aveyard et al., 2003).
2.1.1.2 Rheological property of 3D network formation in the continuous phase
The deformation of liquid around the particles give rise to the lateral capillary interaction between the particles (in Figure 2.1) and hence causing the particle adsorption at the fluid
interface. The force required to lateral displace the particles along the interface is much smaller than to remove a single particle from the interface (Tambe et al., 1994). Thus, the particles are prone to aggregating together rather than being detached from the interface (Danov et al., 2010).
Figure 2.1 The capillary forces between two particles in the liquid-liquid interface. The particle concentration at the interface is believed to enhance the viscoelasticity of the interface, and thus reducing the film drainage rate and promoting the emulsion stability (Tambe et al., 1994). Additionally, the aggregated particle attaches to the droplet interface and extends themselves into the continuous liquid phase, behaving as 3D particle network via particle-particle interaction as illustrated in Figure 2.2 (Abend et al., 1998).
Figure 2.2 3D network formation in SSE (Nesterenko et al., 2014).
2.1.1.3 Particle bridging
Particle bridging is referred to the case when a single particle is absorbed into two droplets simultaneously. Horozov et al. (2006) and Horozov et al. (2005) attributed the generation of the bridge at the contact area to the long-range Coulomb repulsion between particles, induced by the very hydrophobic particles. Apart from the particle affinity, French et al. (2015) observed the particle bridge in the case, where there is insufficient particle to cover the generated interface (as displayed in Figure 2.3). One of the illustrations being an extremely stable emulsion obtained with particle coverage fraction as low as 5%, in the presence of the particle bridge at the contact region (Vignati et al., 2003). In fact, several researchers demonstrated the superior stability of the emulsion exerted by the bridged droplets. For instance, Walker et al. (2011) and Moghimi et al. (2014) proposed the inhibition of the coalescence under the aggregation of clustered droplets connected by the bridged particles. Similar behaviour was
found in the polymer blends (Nagarkar et al., 2012), where the solid-like rheology of the blends was discovered in the presence of the particle bridge.
Figure 2.3 Schematic representation of closely packed monolayer (left) and dilute monolayer with bridge (right) (French et al., 2015).
2.1.2
Effective particle types
A wide range of organic and inorganic particles are proved to be able to fulfill the wetting conditions for various oil types, including calcium carbonate, clays, barium, sulphate, morillonite, laponite, carbon black, latex, magnetic particles, carbon nanotubes, and block copolymer micelles (Chevalier et al., 2013). Recent findings revealed several functional/ stimuli-response particles stabilizer, whose wettability could be modified corresponding to given external stimuli (pH-sensitive, thermal-sensitive, ionic-sensitive particles, etc.). In addition, some odd particles are known to be potential stabilizers, such as cationic nanocrystals, spores, and bacteria.
2.1.3 Emulsion types
As shown in Figure 2.4, oil-in-water emulsion (O/W) consists of oil droplet suspended in the continuous water phase whereas water-in-oil (W/O) emulsion is of the opposite. An emulsion in the emulsion is defined as a double emulsion or multiple emulsion, including water-in-oil-in-water emulsion (W/O/W) and oil-water-in-oil-in-water-in-oil emulsion (O/W/O). Phase inversion is a process of switching the emulsion type from O/W to W/O or vice versa, which could be achieved either via transitional inversion or catastrophic inversion.
2.1.4 The relationship between particle contact angle and emulsion type
2.1.4.1 One type of particle present
If the oil and water phase are of equal volume fraction, the monolayer curvature of the particle coating, to some extent, determines the resulting emulsion type. Specifically, the particle monolayer tends to curve the way such that a greater fraction of particle surface remains on the external phase. In the case of the hydrophilic particle ( 𝜃-. < 90°), the majority part of the
particle resides in the aqueous phase, vice versa for ( θ:; > 90°) which is displayed in Figure
2.5. A comprehensive study of the particle wettability and corresponding emulsion type was summarized by Aveyard et al. (2003) as shown in Table 2.1. This table shows that the water-wet hydrophilic particles would stabilize O/W emulsion whereas the oil-water-wet hydrophobic particles favors forming W/O emulsion. Not fully agree with the above opinion, Kaptay (2006) proposed the dependence of emulsion type on the number of particle layers and revealed that the double particle layers with contact angle of 15° < 𝜃
-. < 129° could stabilize O/W
emulsion while particles with contact angle of 51°< θ
:; < 165° produces W/O emulsion.
Figure 2.5 The particle position between oil and water phase and the corresponding resulting emulsion type (Aveyard et al., 2003).
Table 2.1 The link between particle contact angle and final emulsion type (Aveyard et al., 2003).
Solid Oil ϴow Emulsion types
Hydrophilic silica Dodecane 38 o/w
Cyclohexane 37 o/w
PDMS 50cS 81 o/w
Unedecanol 38 o/w
Partially hydrophobic silica
Dodecane 83 o/w
Cyclohexane 87 o/w
Isopropyl myristate 101 w/o
Undecanol 110 w/o
Hydrophobic silica Dodecane 135 w/o
Cyclohexane 135 w/o
PDMS 50cS 172 w/o
Isopropyl myristate 175 w/o
Undecanol 151 w/o
The particles are unable to stabilize an emulsion if the particles are either too hydrophilic or too hydrophobic. Instead, they remain dispersed in the water (oil) phase. In order to meet the partial wetting conditions, the surface modification is essential to make the particles more hydrophobic or more hydrophilic, either from 1) adsorption of different types of molecules or from 2) chemical grafting of organic molecules. The latter one is preferred as the organic molecules are more tightly attached through a chemical bond. The grafting degrees can be tuned to control the particle wettability characteristics and the resulting emulsion types (Chevalier et al., 2013).
2.1.4.2 Two types of particle present
Several researchers showed the incapacity of forming a stable particle coating in the presence of two types of particles. Briggs (1921) attempted to produce a stable emulsion with the mixture of silica particle, favouring forming O/W emulsion, and carbon black, favouring producing W/O emulsion. However, the author was unable to produce a stable emulsion using such particle mixture.
In a similar fashion, Whitby et al. (2010) failed to stabilize a W/O emulsion with the mixture of particles (containing extremely hydrophilic silica nanoparticles and hydrophobic titania particles) that can stabilize different types of emulsions on their own. The authors attributed the instability of the final emulsion to a growing proportion of the hydrophilic silica particles, which could barely stabilize W/O emulsion. In contrast, Tarimala et al. (2004) demonstrated the possibility of stabilizing emulsion in the presence of both hydrophobic (~117°) and hydrophilic (~59°) solid particles with a diameter of 1μm. These particles were observed to
simultaneously segregate to the same interface as reported in Figure 2.6, resulting from the amphiphilic nature of the oil-water interface.
Figure 2.6 Droplet interface of simultaneously self-assembled mixing of green hydrophobic (~117°) and red hydrophilic (~59°) particles with diameters of 1 μm. The scale bar is 5 μm
(Tarimala et al., 2004).
2.1.5 Factors affecting the stability of the emulsion
2.1.5.1 Particle concentration
In the conventional emulsion system, the droplet size falls with the surfactant concentration owing to the lowered interfacial tension, till reaching the critical micelle concentration (CMC). (Gelot et al. (1984) observed the same trend in the SSEs system. The authors pointed out the dependence of emulsion stability on the particle concentration, evidenced by the notably improved emulsion stability with an increasing amount of silica particles or carbon graphite. Later, Binks et al. (2004) established the same relationship between emulsion stability and particles concentration, in the emulsification of silicone oil and water with partially hydrophobic nanoparticles. Tcholakova et al. (2008) proposed two regimes of emulsification process based on the emulsifier concentration shown in Figure 2.12 (right). In the “insufficient emulsifier” zone, the droplet size falls dramatically with the particle concentration. As the available particles are unable to cover all the interface generated from breakage, the droplet size mainly depends on the coalescence process. In the “sufficient emulsifier” zone, however, the droplet size remains the same regardless of the emulsifier concentration. Indeed, Frelichowska et al. (2010) confirmed the presence of excess particles from the vial and the small peak in the droplet size distribution in the “sufficient particles regime” as shown in Figure 2.7. Thus, they further attribute the pronounced stability to the excess particles, which exhibits as a gel in the continuous phase.
Figure 2.7 The effect of HDK® H30 hydrophobic silica concentration on the mean droplet diameter of o/w SSEs of 2-Ethylhexyl stearate oil (Frelichowska et al., 2010).
2.1.5.2 Oil-water ratio
Chen et al. (2005) achieved the maximum stability of O/W emulsion at an equal oil-water ratio. Binks et al., (2004) reported a dramatically elevated uniformity of oil droplet distribution and droplet size upon increasing of the oil-water ratio. Arditty et al. (2003) validated the limited coalescence phenomena under various mixing conditions and dispersed phase volume fraction, which allows for obtaining a narrow size distribution. Using a high volume fraction of the dispersed phase along with insufficient particles to cover the interface, they successfully produced a monodispersed emulsion. In fact, in given conditions, an elevated oil-water ratio could result in catastrophic phase inversion (explained in detail in the “catastrophic phase inversion” section) (Binks et al., 2004).
2.1.5.3 Emulsification time
Verbich et al. (1997) observed a reduction of droplet size with longer emulsification time. They attribute this observation to the enhanced effectiveness of emulsifier over time. However, Chen et al. (2005) argued that a longer duration is not necessary to result in a more stable emulsion. Instead, they claimed that 15mins of emulsification (in Figure 2.8) is optimal for excellent stability even after standing for 24 hours. Beyond 15mins, the stability weakened as a result of the migration of the emulsifier. Binks et al. (2004) proposed the dependence of emulsification time on the dispersed phase volume regime. At a lower volume fraction, i.e. Фd= 33 vol%, the
decline of droplet size is observed, along with improved stability, over the emulsification time until insufficient energy is supplied for overcoming further deformation. However, the coalescence dominates at a higher volume fraction (i.e. 60 vol%) close to the phase inversion points, resulting in intensified collision and coalescence events. Thus, continuous agitation could yield phase inversion in this case (in Figure 2.9).
Figure 2.8 The effect of emulsification time on the stability of emulsion (Chen et al., 2005).
Figure 2.9 The effect of emulsification time on the mean diameter in different oil volume fraction at 350 cS PDMS in 10-2 M NaCl emulsion stabilized by 0.7 wt % hydrophobic silica
in the aqueous phase : left: 33 vol %; the right one: 60 vol% (Binks et al., 2004).
2.1.5.4 Electrolyte concentration
Yang et al. (2006) attempted to produce a paraffin O/W emulsion with positively charged LDHs particles. A stable emulsion is obtained under salt condition, while they are unable to produce an emulsion with the removal of salt. Accordingly, the salt promotes the particle aggregation and network formation at the interface, which is confirmed by a declined zeta potential. This structure contributes to the particle adsorption into the interface, resulting in a stable emulsion. Binks et al. (1999) revealed the correspondence of the initiation of the improved emulsion stability to the point where the particles start to flocculate. In both cases, the salt enhances the emulsion stability by varying the particle flocculation conditions. In contrast with the above discussions, Lucassen-Reynders et al. (1963) argued that the particles are rendered more hydrophobic by the salt, altering the extent of particle immersion at the interface.
2.1.6 Novel applications
The unique features of the SSE that do not share with the surfactant-stabilized emulsion allow it to applies to various promising field. The replacement of surfactant with particles brings about
numerous advantages regarding its stability against storage, oxidational, temperature and digestion. Frelichowska et al. (2009) used SSE as an encapsulation for controlled drug release, wherein silica particles coating behaves as a barrier to prevent the transfer of materials. A three-fold higher penetration rate was observed in the SSEs, which is attributed in part to the higher adhesion forces between the particles and the skin. Recently, a wide array of novel stimuli-responsive Pickering capsules have been proposed in the literatures. Exploiting pH- sensitive chitosan coated particles stabilized emulsion as a template, Xu et al. (2005) prepared a colloidosome encapsulated with insulin, which can be released at a controlled rate via pH adjustment. Shah et al. (2010) adopted poly (N-isopropylacrylamide) (PNIPAm) nanoparticles as a thermos-sensitive capsule shell, where the drug is released from the capsule under the shrinkage of the particles at high temperature.
Apart from the drug delivery, SSE could also be encountered in the fabrication of novel materials. With SSEs templates, the researchers are able to prepare materials with desired porosity through polymerization, such as TiO2-stabilized hybrid hollow spheres (Chen et al.,
2007), highly porous nanocomposite polymer foams (Blaker et al., 2009) (in the Figure 2.10 right), macroporous polymers (Ikem et al., 2010; Menner et al., 2007; Zheng et al., 2013) and core-shell structured microsphere (Zhang et al., 2009). The structure of the resulting material was proved to possess high mechanical strength, interfacial area, and permeability (Xu et al., 2005). Generally, the polymerization process is followed to support the structure formed by the SSE. Given that the coating of solid particles resists the further deformation and remain the desired structure, the droplet is then emoved by evaporation, dissolution, drying or freezing. To illustrate, Figure 2.10 (left) gives an example of the 3-steps procedure to obtain a hierarchical porous TiO2-based
material using high internal dispersed phase Pickering emulsion as a template.
Figure 2.10 Left: 3 steps process for obtaining hierarchical porous TIO2-based materials using high internal dispersed phase SSE as a template (Li et al., 2014). Right: polymer foams,
2.2 Emulsification of solid-stabilized emulsions
Figure 2.11 illustrated the droplet passage during the emulsification process in the mixing tank (Tsabet et al., 2015b). Accordingly, the emulsification process starts by generating the oil/water interface in the high shear zone near the impeller, followed by the particle adsorption in the stabilization zone. If the droplets are not fully covered by the particles, they merge in the coalescence zone which is far from the impeller. Subsequently, they will go back to the impeller zone and completes one circulation (Tsabet et al., 2015b). Tcholakova et al. (2008) presented emulsification process as steps including the deformation, breakage, collision of the droplets and the occurrence of coalescence providing that the adsorption time is longer than the contact time and deformation time (in Figure 2.12).
Figure 2.11 The schematic presentation of the emulsification process in the tank (Tsabet et al., 2015b).
Figure 2.12 The schematic presentation of the emulsification process (A) to (B) deformation; (B) to (C) breakage; (C) to (D) collision; (D) to (A) coalescence (Tcholakova et al., 2008).
2.2.1 Characteristic time
Characteristic times are compared to estimate the probability of a given process during the emulsification. For example, Tcholakova et al. (2008) deduced the coalescence possibility by
comparing the particle adsorption time and droplet deformation time and contact time. Numerous researchers correlated the characteristic time scales (particle adsorption time, droplet deformation time, film drainage time, droplet contact time) involved in the emulsification. In the turbulent regime, particle adsorption time 𝑡A is identified as the mass of particles adsorption at the interface versus the particle flux towards the interface ΓC in the following equation (Tcholakova et al., 2008):
𝑡A ≈ EF GHI(JK) L M…(2.2) ΓC ≈NOPQRQ S …(2.3)
From these equations, we can find that the adsorption time extends linearly with the particle size 𝑟+. Thus, one can expect that the particles with higher weight require longer time to adsorb at the interface. The droplet deformation is controlled by the synergic impact of droplet stretching in the flow, along with the droplet shape relaxation resulting from the interfacial tension (Cristini et al., 2003). The time for low viscous droplets in turbulent flow to deform is proposed by linking the sufficiently elongated droplet length over the stretching rate of the droplet in the turbulent flow (Cristini et al., 2003):
𝑡KUV ≈K W M
JLM
…(2.4)
Where 𝑑 is the droplet size and 𝜀 is the energy dissipation rate. Levich (1962) derived the contact time 𝑡Z between particle and droplet from a dimensional analysis in the turbulent system: 𝑡Z ∽(KH\K) J]^_ L M W M …(2.5)
Where 𝑑+ is the particle size. Drainage time 𝑡K is defined as the time duration required for the thin film between droplets to be ruptured. The deformability and mobility of the interfacial colloidal particles are believed to be the major driving forces for the drainage process. The relationship between film drainage time 𝑡K and the film thickness is derived from the Reynolds equation: 𝑡K ∽ `abS cIAdW eIfg ( ` hI_W− ` hjW)…(2.6)
Where 𝜂Z is the dynamic viscosity of the continuous phase; 𝐴V = π𝑅V0 is the area of the film at
t=0 when hop=hq; 𝑅V refers to the radius of the film; 𝐹Z-s is the collision force exerted on the
droplets; hop is the critical film thickness and hq is the initial film thickness. Jeelani et al. (1994)
proposed the film drainage time 𝑡K equation under the condition of immobilized film, where they assumed zero interfacial tangential velocity to the sphere surfaces at the particle boundary:
𝑡K = SbtducI
NhI_WeIfg[`\(MwIgI_jIWxjwy )]
…(2.7)
Here, 𝜂K is the dynamic viscosity of the droplet, lopqo is the circulation distance between the droplet interface and the zero velocity into the droplets.
2.2.2 Interface generation
The droplet size, interfacial tension, viscosity of both phases and hold up fraction play essential roles in the deformation of droplets (Coulaloglou, 1977). Under the mechanic energy, the interfaces are deformed and generate some large droplets, which proceed to break into smaller ones. In general, the extent of fragmentation is determined by the amount of energy supply during the emulsification. An elevation of the local dissipation energy ε}~p was reported to be the most effective way of reducing droplet size (Graillat et al., 1990).The breakage ceases when the generated energy is insufficient for further droplet deformation (Whitesides et al., 1995). In turbulent flow, the force generated by the eddies containing in the turbulent flow is able to deform the droplets. However, if the eddy size is larger than the droplets, it will carry the droplets rather than breaking them.
Within the smallest scale of turbulent (Kolmogorov length), the viscosity is the dominant effect due to the conversion of the kinetic energy to the heat. In this case, the Capillary number 𝐶𝑎, defined as the interplay between viscous stresses to interfacial tension (capillary pressure) and controls the droplet deformation and shape, is used to determine the droplet breakage. Above the Kolmogorov scale λ, however, the droplet ruptures at high turbulent kinetics over the interfacial tension, depending on the Weber number We.
Weber number We =P„…W†M
‡ … (2.8)
Reynolds Number Re =P„‰†W
Capillary number 𝐶𝑎 =ŠUtU …(2.10) Kolmogorov length scale λ = (Œ‹M
•ŽR) L
u … (2.11) Power consumption P = N‘ρoNSD”… (2.12)
Energy dissipation rate ε}~p = •‘
– … (2.13)
Where ρo is the density of the continuous phase; N is the rotation speed; D is the diameter of the impeller; σ is the interfacial tension; ν is the kinetic viscosity; 𝜂 is the dynamic viscosity; N‘ is the power number and mš is the total mass of the system.
In fact, two forces are acting on the droplet in the turbulent regime: one is a disruptive force 𝜏Z derived from the turbulence velocity fluctuation in the hydrodynamic, while the other one is cohesive force 𝜏œ, arising from the interfacial tension, which opposes the droplet deformation
(Tsabet, 2014). Kolmogorov et al. presented the first successful theory in droplet breakage in turbulent flow. The authors correlated the maximum stable droplet size d•}ž in given turbulent flow by equating the disruptive with the cohesive forces. If the dispersed phase is of high viscosity, the viscous stress 𝜏K within the droplets must be taken into account to the cohesive
forces. 𝜏Z ≈ 𝜌Z𝜀WM𝑑 W M…(2. 14) 𝜏œ ≈K …(2. 15) d•}ž= C`(P‡ „) M ¢ε •}ž -W
¢ (low viscous dispersed phase) …(2. 16)
𝜏K ≈ 𝜇K(¥I/§y) L W
K …(2.17)
2.2.3 Particle adsorption at the interface
In the flotation process, the bubble-particle interaction was first divided into three main steps: 1) collision: contacting between the bubble and the particles 2) attachment: drainage and rupture of the continuous film and the contact line movement. 3) stability: the occurrence of detachment in the case of unstable bubble-particle aggregate (Derjaguin et al., 1993). In parallel to the flotation system, particle adsorption onto a liquid-liquid interface involves the collision between particles and the droplets, driven by the hydrodynamic force, the stabilization of particles at the interface, and the detachment of the adsorbed particles by shear (Tsabet, 2014).
The particles will only be stabilized at the interface under these two conditions: 1) the film between the particle and interface has to be ruptured; 2) the formation of the three-phase contact line. The particle adsorption possibility at the interface is estimated from a comparison between the contact time versus the film drainage time, which is similar to the widely-studied coalescence efficiency 𝐸Z-¨s between two droplets.
𝐸Z-¨s ≈ exp(−««y
I)…(2.18)
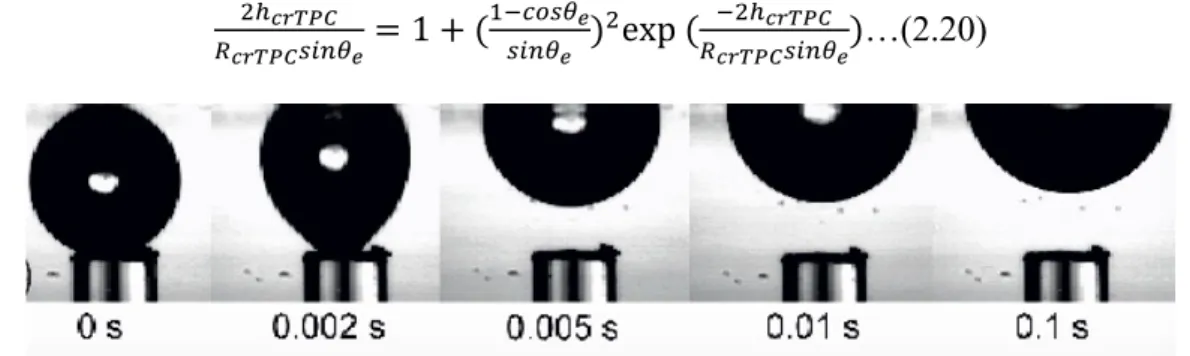
Theadsorption takes place if the drainage time is shorter than the contact time, which signifies that the film could be drained during the contact. The formation of a three-phase-contact line (TPC line) is also responsible for the stable meniscus around the particles after the collision. Minimum TPC line radius has to be achieved during the collision of particle and droplet, to obtain the TPC line expansion. The expansion of TPC line is very rapid for only a few milliseconds, Vachova et al. (2013) recorded the whole process with the high-speed digital camera, as shown in Figure 2.13 and estimated the expansion velocity of the TPC line 𝜐-®G by:
𝜐-®G =Kt¯°±
K« =
²f³
´µ¶ (t·/¸·)c(𝜃U
S− 𝜃S(𝑡))…(2.19)
Where 𝑅¹ refers to the macroscopic characteristic length ( particle radius 𝑅+); 𝐿¹ is the molecular characteristic length; 𝜃U is the equilibrium contact angle; 𝑅-®G is the radius of the TPC line; The theoretical critical TPC line thickness 𝑅Z»-®G is assessed based on the
thermodynamic balance of the free energy of the film before rupture and after the formation of TPC line: 0hI_¯°± tI_¯°±œ¼½¾¿ = 1 + ( `ÁZ-œ¾¿ œ¼½¾¿ ) 0exp ( Á0hI_¯°± tI_¯°±œ¼½¾¿)…(2.20)
Figure 2.13 Sequence of photos showing the bubble adhesion on a horizontal plane: the evolution of TPC line as a function of time (Vachova et al., 2013).
There is a high chance that the particle could be sheared off from the interface in the high shear zone, where it has the highest energy dissipation rate (40-120 times of the average). To determine if the particles could be detached, the force balance must be taken into consideration
within the circulation time. Attachment force of the spherical particles in the liquid interface is defined as (Scheludko et al., 1976):
𝐹¨«« = 2𝜋𝛾-.𝑅+(cos žf³
0 Æ)0…(2.21)
𝛾-. and 𝜃-. are the interfacial tension and contact angle between oil and water respectively; 𝑅+ is the particle radius. On the other hand, the detachment force of a spherical particle at the interface is mainly stem from the sum force of hydrodynamic, Laplace pressure and particle self-weight. The Laplace pressure force 𝐹s¨+ exerted on each particle would be (Tsabet et al., 2015b):
𝐹s¨+ = (𝜋𝑅+0𝑠𝑖𝑛0𝜃
-.)0²tf³
y …(2.22) moreover, the particle weight 𝐹É is presented as:
𝐹É = NS𝜋𝑅+S𝜌
+𝑔…(2.23)
Scheulze et al. (1993) proposed the hydrodynamic force 𝐹hËK exerting on the particle at the
oil-water interface:
𝐹hËK = NS𝜋𝑅+S𝜌+𝑎«…(2.24)
Where the acceleration 𝑎« in the flow field is given as (Scheulze et al., 1993): 𝑎« = `.´J]^_ W M (ty\tH) L M…(2.25)
Here, 𝑅K is the droplet radius. This collision of the large particle contributes to the detachment, which should be taken into account as part of detachment force.
2.2.4 Limited coalescence
The coalescence involves two steps, collision of the partially covered droplets and a subsequent film drainage process. The coalescence will take place if the film drainage time is shorter than the drop contact time. Otherwise, the two droplets would repulse from each other. For the conventional emulsion, the surfactant plays a pronounced role in lowering the interfacial tension and suppressing the coalescence. Jeffreys et al. (1971) explained that the enhanced droplet deformation is arising from the diminished interfacial tension and results in a larger drainage area and longer drainage time. Alternatively, Hodgson et al. (1969) attributed the inhibited coalescence to the reduced interfacial mobility.
Pickering (1907) first found that the aggregation of fine surface-active particles hinders the coalescence process. Ata (2008) visualized and recorded the coalescence dynamics between air bubbles covered with particles (displayed in Figure 2.14) and highlighted the impact of particles in coalescence. The notable difference in the coalescence dynamic between the uncoated-uncoated bubbles and between the particle-coated bubbles again confirms the resistance of coalescence exerted by the particle coating. Whitesides et al. (1995) claimed the coalescence starts after the droplet fragmentation until the particle coverage at the drop interfaces is sufficient to prevent further coalescence. Following the pioneering work, Arditty et al. (2003) termed such unique behaviour as limited coalescence and established a linear relationship between average droplet size and the mass of particles 𝑚+ at a given degree of particle
coverage.
` K = 𝑠V
¹H
aÎy…(2. 26)
Here, 𝑠V is the droplet surface area covered by per unit mass of particles, 𝑉K is the volume of the dispersed phase, d is the droplet diameter. In the absence of particles, the interfacial area is reducing gradually to seek for the lower thermal condition. As indicated in the correlation, the final droplet size falls with particle concentration, while particle density at the interface remains constant (Arditty et al., 2003). In line with this theory, Tsabet et al. (2015a) reported a sharp reduction in droplet size with particle until reaching the plateau, beyond which the drop size is governed by the system breakage capacity. Exploiting the limited coalescence model, Pauchard et al. (2014) successfully predict the size of W/O emulsion stabilized with asphaltenes. Likewise, Daware et al. (2015) validated the model in predicting the droplet size of an emulsion stabilized by micron sized silica rods. In contrast, Gautier et al. (2007) argued that the coalescence cease further before the closely-packed particle interface in the presence of particle bridges, for this reason, they insisted that inter particle attractive interaction could also prevent the droplet against further coalescence.