HAL Id: hal-00296288
https://hal.archives-ouvertes.fr/hal-00296288
Submitted on 16 Jul 2007
HAL is a multi-disciplinary open access
archive for the deposit and dissemination of
sci-entific research documents, whether they are
pub-lished or not. The documents may come from
teaching and research institutions in France or
abroad, or from public or private research centers.
L’archive ouverte pluridisciplinaire HAL, est
destinée au dépôt et à la diffusion de documents
scientifiques de niveau recherche, publiés ou non,
émanant des établissements d’enseignement et de
recherche français ou étrangers, des laboratoires
publics ou privés.
LAPBIAT measurement campaign at Värriö field station
T. M. Ruuskanen, M. Kaasik, P. P. Aalto, U. Hõrrak, M. Vana, M.
Mårtensson, Y. J. Yoon, P. Keronen, G. Mordas, D. Ceburnis, et al.
To cite this version:
T. M. Ruuskanen, M. Kaasik, P. P. Aalto, U. Hõrrak, M. Vana, et al.. Concentrations and fluxes of
aerosol particles during the LAPBIAT measurement campaign at Värriö field station. Atmospheric
Chemistry and Physics, European Geosciences Union, 2007, 7 (14), pp.3683-3700. �hal-00296288�
www.atmos-chem-phys.net/7/3683/2007/ © Author(s) 2007. This work is licensed under a Creative Commons License.
Chemistry
and Physics
Concentrations and fluxes of aerosol particles during the LAPBIAT
measurement campaign at V¨arri¨o field station
T. M. Ruuskanen1, M. Kaasik2, P. P. Aalto1, U. H˜orrak7, M. Vana1,7, M. M˚artensson3, Y. J. Yoon4, P. Keronen1, G. Mordas1, D. Ceburnis4, E. D. Nilsson3, C. O’Dowd4, M. Noppel7, T. Alliksaar5, J. Ivask5, M. Sofiev6, M. Prank2, and M. Kulmala1
1University of Helsinki, Dept. of Physical Sciences, P.O. Box 64, 00014 University of Helsinki, Finland 2Institute of Environmental Physics, University of Tartu, Tartu, Estonia
3Department of Applied Environmental Science, Stockholm University, Stockholm, Sweden 4Department of Experimental Physics, National University of Ireland, Galway, Ireland 5Institute of Geology, Tallinn University of Technology, Tallinn, Estonia
6Air Quality Research, Finnish Meteorological Institute, Finland 7Institute of Physics, University of Tartu, Tartu, Estonia
Received: 21 November 2006 – Published in Atmos. Chem. Phys. Discuss.: 17 January 2007 Revised: 25 April 2007 – Accepted: 3 June 2007 – Published: 16 July 2007
Abstract. The LAPBIAT measurement campaign took place
in the V¨arri¨o SMEAR I measurement station located in East-ern Lapland in the spring of 2003 between 26 April and 11 May. In this paper we describe the measurement campaign, concentrations and fluxes of aerosol particles, air ions and trace gases, paying special attention to an aerosol particle formation event broken by a air mass change from a clean Arctic air mass with new particle formation to polluted one approaching from industrial areas of Kola Peninsula, Rus-sia, lacking new particle formation. Aerosol particle number flux measurements show strong downward fluxes during that time. Concentrations of coarse aerosol particles were high for 1–2 days before the nucleation event (i.e. 28–29 April), very low immediately before and during the observed aerosol particle formation event (30 April) and increased moderately from the moment of sudden break of the event. In general particle deposition measurements based on snow samples show the same changes. Measurements of the mobility dis-tribution of air ions showed elevated concentrations of inter-mediate air ions during the particle formation event. We esti-mated the growth rates in the nucleation mode size range. For particles <10 nm, the growth rate increases with size on 30 April. Dispersion modelling made with model SILAM sup-port the conclusion that the nucleation event was interrupted by an outbreak of sulphate-rich air mass in the evening of 30 April that originated from the industry at Kola Peninsula,
Correspondence to: T. M. Ruuskanen
(taina.ruuskanen@helsinki.fi)
Russia. The results of this campaign highlight the need for detailed research in atmospheric transport of air constituents for understanding the aerosol dynamics.
1 Introduction
Atmospheric aerosols have a large impact on the radiative balance and climate both directly, by scattering sun light back to space, and indirectly, by acting as cloud condensa-tion nuclei (CCN) and changing the albedo and life time of clouds (Charlson and Wigley, 1994). Estimating the impact of aerosols on climate is especially difficult since the effect of aerosol depends on properties e.g. concentration, size and composition of aerosols and aerosol properties vary signifi-cantly in space and time. New aerosol particle formation has been observed in different types of environments in the free troposphere (Clarke, 1992; Schr¨oder and Str¨om, 1997), in the marine boundary layer (O’Dowd, 2002a), in Arctic areas (Pirjola et al., 1998), in urban areas (Kerminen and Wexler, 1996), in boreal forest (M¨akel¨a et al., 1997; Tunved et al., 2003) and in relation to air ion formation events (Vana et al., 2004). A recent overview (Kulmala et al., 2004a) summarise observations.
Formation of new aerosol particles is observed 60–120 times a year in southern (Kulmala et al., 2001; Dal Maso et al., 2005) and 25–60 times in northern Finland (Komp-pula et al., 2003, 2006; Vehkam¨aki et al., 2004). It has been
suggested that formation and growth are two separate pro-cesses and involve different gas phase species taking part in them. Formation of new aerosol particles has been suggested to result from binary nucleation of H2SO4 and H2O (Kul-mala et al., 1998) or ternary nucleation of H2SO4, NH3and H2O (Korhonen et al., 1999). Modelling and experimental results show that ion-induced nucleation can also be consid-ered as a possible mechanism for particle generation (Laakso et al., 2004a, b). In many cases, sulphuric acid plays a role in new particle formation (Kulmala et al., 2006a). However, in some special cases, such as in deep convective clouds, at-mospheric nucleation can occur without sulphuric acid (Kul-mala et al., 2006b). Kul(Kul-mala et al. (2000) suggested that nucleation occurs almost everywhere in the atmosphere dur-ing daytime but, as it results in aerosol particles smaller than the detectable size, we cannot observe it without subsequent growth. Growth of newly formed aerosol particles in boreal forest has been suggested to be due to heterogeneous nucle-ation and condensnucle-ation from the emitted biogenic volatile or-ganic compounds (BVOC’s) or their oxidation products. Bo-real forests are one possible source of BVOC’s that can be oxidized to less volatile species. For example terpenoids are emitted from coniferous forests, especially in the spring and summer (Hakola et al., 2003). In the Northern Hemisphere solar radiation is high in spring and there is a spring time maximum in the ozone concentration in unpolluted northern areas (Logan et al., 1985) that is also observed in Finnish Lapland (Ruuskanen et al., 2003) leading to effectively oxi-dizing conditions. Oxidation products of several terpenoids have been identified from aerosols, of e.g. isoprene (Clayes et al., 2004, Kourtchev et al., 2005), monoterpenes (O’Dowd et al., 2002), and sesquiterpenes (Bonn and Mootgard, 2003). O’Dowd et al. (2002b) state that compounds, such as cis-pinonic acid and pinic acid, that are oxidation products of monoterpenes, participate in the growth of new aerosol par-ticles.
A lot of research has focused on characterising the aerosol particle formation events and the parameters that control ob-served new aerosol particle formation (Kulmala et al., 1998; M¨akel¨a et al., 2000; Buzorius et al., 2001; Boy et al., 2002). Several field studies have concentrated on observations of the formation and growth of newly formed aerosol particles in Southern Finland (Kulmala et al., 2001). Also involvement of air ions in new aerosol particle events has been studied (Laakso et al., 2004b). The understanding of aerosol particle formation events has increased, but the processes involved are still not fully understood. Chemical conditions are more confined in Northern Finland. There are less anthropogenic sources and these are easy to identify, the contribution from local diffuse background sources is negligible and often well-defined plumes are formed. In fact, three different influenc-ing source areas can be defined for Finnish Lapland: Kola Peninsula, continental Europe and marine. The effect can be seen in trace gas concentrations as well as aerosol number concentration (Ruuskanen et al., 2003) and scattering
coeffi-cient (Virkkula et al., 1997). Also a recent modelling study (Komppula et al., 2006) has focussed on those effects.
LAPBIAT (Lapland Atmosphere-Biosphere facility) surement campaign took place in the V¨arri¨o SMEAR I mea-surement station located in Eastern Lapland in the spring of 2003 between 26 April and 11 May. LAPBIAT is an EU programs and its goal is to enhance the international sci-entific co-operation at the Finnish Arctic research stations involved in the program. During this LAPBIAT campaign the variation of the concentration of aged aerosols of anthro-pogenic origin as well as formation and growth of aerosol particles in sub-arctic boreal area was studied with versatile aerosol particle and air ion size distribution measurements supported by deposition studies based on aerosol fluxes and snow chemistry. Trace gases (SO2 and O3), aerosol parti-cle concentration and meteorological parameters were con-tinuously measured since 1992 in SMEAR I-station (Station for Measuring Forest Ecosystem – Atmosphere Relation) lo-cated in Northern Lapland. Several other measurements like NOxand aerosol size distribution, to name a few, were started later. The aim of this work is to study closely two weeks dur-ing sprdur-ing, when the aerosol particle formation events occur most frequently and to look at a specific aerosol particle for-mation event, which was interrupted by a pollution event, in detail.
2 Experimental
2.1 Location
The SMEAR I (Station for Measuring Forest Ecosystem – Atmosphere Relation) station (67◦46′N, 29◦35′E) (Hari et al., 1994) is located in V¨arri¨o nature park in eastern Lap-land, less than ten kilometres from the border of Russia. The measurements were made from different heights of a mea-surement tower located on top of a hill 390 m above sea level (a.s.l.). The station is located below the alpine tim-berline (400 m a.s.l.) but it is surrounded by the range of V¨arri¨o fjelds above the timberline that continue from north to south. Most of the trees in the surrounding areas are about 50-years-old Scots pines (Pinus Sylvestris L.) and the height of the trees is about eight metres and the mean diameter ap-proximately eight centimetres. The distance from the nearest small road to the station is approximately eight kilometres and from the nearest major road about 100 km. There are no towns or industry close by. Having practically no local pollution gives an opportunity to observe background con-centrations and mid- to long-range transport of long-lived pollutants. The nearest major pollution sources are met-allurgy factories of Montchegorsk located 150 km east and Nikel located 190 km north from the station. Since anthro-pogenic emissions come from well-defined sources and of-ten in well-defined plumes, namely from Kola Peninsula, we have a great opportunity to study aerosol formation events,
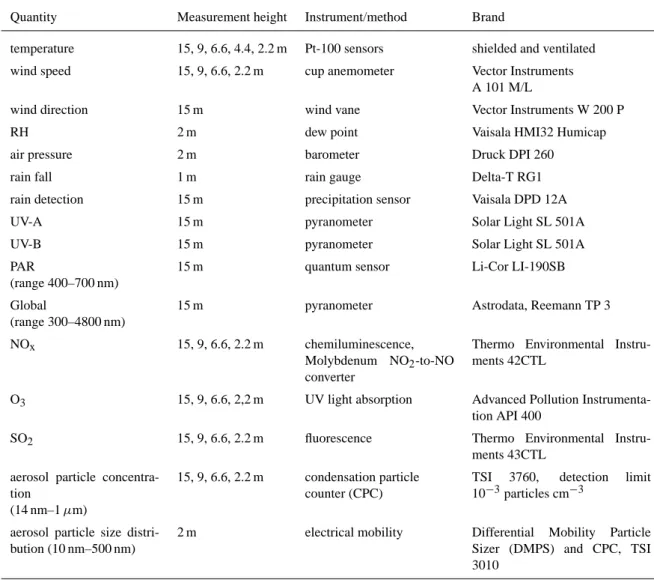
Table 1. The list of continuous measurements in SMEAR I station, during LAPBIAT campaign.
Quantity Measurement height Instrument/method Brand
temperature 15, 9, 6.6, 4.4, 2.2 m Pt-100 sensors shielded and ventilated
wind speed 15, 9, 6.6, 2.2 m cup anemometer Vector Instruments
A 101 M/L
wind direction 15 m wind vane Vector Instruments W 200 P
RH 2 m dew point Vaisala HMI32 Humicap
air pressure 2 m barometer Druck DPI 260
rain fall 1 m rain gauge Delta-T RG1
rain detection 15 m precipitation sensor Vaisala DPD 12A
UV-A 15 m pyranometer Solar Light SL 501A
UV-B 15 m pyranometer Solar Light SL 501A
PAR
(range 400–700 nm)
15 m quantum sensor Li-Cor LI-190SB
Global
(range 300–4800 nm)
15 m pyranometer Astrodata, Reemann TP 3
NOx 15, 9, 6.6, 2.2 m chemiluminescence,
Molybdenum NO2-to-NO converter
Thermo Environmental Instru-ments 42CTL
O3 15, 9, 6.6, 2,2 m UV light absorption Advanced Pollution
Instrumenta-tion API 400
SO2 15, 9, 6.6, 2.2 m fluorescence Thermo Environmental
Instru-ments 43CTL aerosol particle
concentra-tion
(14 nm–1 µm)
15, 9, 6.6, 2.2 m condensation particle counter (CPC)
TSI 3760, detection limit 10−3particles cm−3
aerosol particle size distri-bution (10 nm–500 nm)
2 m electrical mobility Differential Mobility Particle
Sizer (DMPS) and CPC, TSI 3010
aerosol and air ion dynamics and atmospheric chemistry in clean and polluted air masses.
2.2 Physical and chemical measurements from air
The continuous trace gas (SO2, NOx, O3), aerosol particle size distribution (DMPS, 8 nm–0.45 µm) and number con-centration of aerosol particles (CPC, 14 nm–3 µm) alongside with meteorological measurements are described in more de-tail by Ruuskanen et al. (2003) and Hari et al. (1994). De-tails of continuous measurements are shown in Table 1. More detail aerosol measurements were made during the measure-ment campaign. Positive and negative air ions were mea-sured with an Air Ion Spectrometer (AIS) from size range of 0.46 nm to 41 nm. Aerosol particles were also mea-sured with an Aerodynamic Particle Sizer (APS), Electrical Aerosol Spectrometer (EAS), a Pulse Height Analyser
con-nected to a CPC (PHAUCPC) (Marti et al., 1996; O’Dowd et al., 2005) and different CPCs (e.g. LICPCs) (Mordas et al., 2005). Campaign measurements are summed up in Table 2. Backward trajectories (96 h) were calculated using FNL data on the HYSPLIT4 model (Draxler and Rolph, 2003) for the levels of 500, 1200 and 2000 m.
Size segregated aerosol mass and inorganic composition was measured using a Micro-Orifice Uniform Deposit Im-pactor (MOUDI). The MOUDI uses circular jets to sep-arate particles aerodynamically onto ten impaction stages plus an inlet stage within a range of 0.056–18 µm (flow rate 1.8 m3h−1, equivalent aerodynamic cut-off diameters at 50% efficiency: 0.056; 0.10; 0.18; 0.32; 0.56; 1.0; 1.8; 3.2; 5.6; 10; 18 µm). The instrument was located in ambient environ-ment with only inlet protected from rain. The inlet of the MOUDI was about 1 m above ground. The MOUDI sam-ple was approximately one week long in order to collect
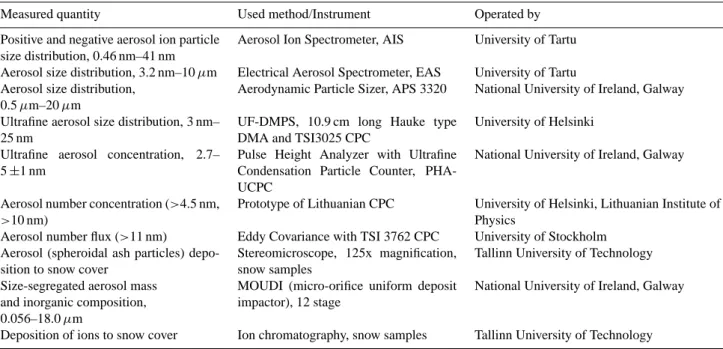
Table 2. The list of instruments used in measurements during the LAPBIAT measurement campaign at SMEAR I station.
Measured quantity Used method/Instrument Operated by
Positive and negative aerosol ion particle size distribution, 0.46 nm–41 nm
Aerosol Ion Spectrometer, AIS University of Tartu Aerosol size distribution, 3.2 nm–10 µm Electrical Aerosol Spectrometer, EAS University of Tartu Aerosol size distribution,
0.5 µm–20 µm
Aerodynamic Particle Sizer, APS 3320 National University of Ireland, Galway Ultrafine aerosol size distribution, 3 nm–
25 nm
UF-DMPS, 10.9 cm long Hauke type DMA and TSI3025 CPC
University of Helsinki Ultrafine aerosol concentration, 2.7–
5 ±1 nm
Pulse Height Analyzer with Ultrafine Condensation Particle Counter, PHA-UCPC
National University of Ireland, Galway
Aerosol number concentration (>4.5 nm, >10 nm)
Prototype of Lithuanian CPC University of Helsinki, Lithuanian Institute of Physics
Aerosol number flux (>11 nm) Eddy Covariance with TSI 3762 CPC University of Stockholm Aerosol (spheroidal ash particles)
depo-sition to snow cover
Stereomicroscope, 125x magnification, snow samples
Tallinn University of Technology Size-segregated aerosol mass
and inorganic composition, 0.056–18.0 µm
MOUDI (micro-orifice uniform deposit impactor), 12 stage
National University of Ireland, Galway
Deposition of ions to snow cover Ion chromatography, snow samples Tallinn University of Technology
sufficient particulate matter to make accurate gravimetric analysis, owing to low particulate mass in remote arctic at-mosphere. The MOUDI impactor was mounted with Al foils, which were preconditioned for 24 h at 35–40% relative hu-midity and 20◦C and weighed with a Mettler Toledo micro-balance (1 µg sensitivity). After sampling, the Al foils were conditioned again for 24 h and weighed. Fortnightly sam-ples were obtained over the LAPBIAT campaign. As the ac-cumulation and coarse modes were clearly revealed, no in-version technique was used to produce continuous spectra. Inorganic ions (SO2−4 , NO−3, NH+4, Cl−, Na+, K+, Ca2+) were determined by ion chromatography (Dionex 2010i, neg-ative ions), atomic emission spectrometry (positive ions) and indophenol-spectrometry for the determination of NH+4. More details could be found in Sopauskiene and Jasinevi-ciene (2006). Each impactor sample set included a blank Al foil, which was treated as a real sample including handling protocols. Blank values of chemical species were subtracted from samples.
2.3 Eddy covariance flux measurements
An eddy covariance (EC) flux measurement system from Stockholm University was operated in the SMEAR I mea-surement tower. The EC system consisted of an ultrasonic anemometer (Gill, model R3) and a CPC (TSI, model 3762) with a lower cut at 11 nm diameter. The CPC pulses were counted by a pulse counter, and logged over two analogue voltage channels on the ultrasonic anemometer interface at 20 Hz together with the vertical wind data. The vertical
turbulent aerosol number flux <N‘w’> was then calculated from the aerosol number (N) and the vertical wind (w). The experimental set up and the data treatment was identical to that followed by M˚artensson et al. (2006), except that we used an improved pulse-analogue converter and did not cor-rect for the limited response time of the CPC. The experi-mental set up is similar to that used at SMEAR II station in Hyyti¨al¨a, Southern Finland (see e.g. Buzorius et al., 2001), except for a more modern anemometer version and a CPC model with larger sampling flow and hence smaller counting error. The aerosol was sampled through a 4.40 m long 1/4 inch stainless steel tube at a flow of about 8 L min−1 (lami-nar) with the inlet just below the sonic head. The centre of the sonic head was at 16.40 m above the ground, which is to be considered the measurement height of the fluxes.
2.4 Deposition measurements from snow samples
Deposition measurements were based on the accumulation of chemical and particulate tracers in the natural snow layer. The first series of five samples (representing both forest and open land and hills and valleys) was taken in the morning and early afternoon of 27 April from the thin layer of fresh snow. The second series at same sites, plus one extra site, was taken in the morning of 1 May from the clearly distinguish-able layer formed during the snowfall of 28–29 April. Thus, both washout and dry deposition during the snowfall up to the sampling time were caught in the same volume. One ad-ditional sample close to the SMEAR I station was taken at the afternoon of 29 April, i.e. in the end of the intense snowfall.
The snow samples were melted in plastic bags and stored in plastic bottles for a few weeks until the analysis. Con-centrations of anions and cations were measured using ion chromatography. Number concentrations of spheroidal fly-ash particles (larger than 5 µm) were determined using a light microscope. Spheroidal fly-ash particles are specific and chemically inert markers of high-temperature combus-tion of fossil fuels (Alliksaar et al., 1998), thus originating from anthropogenic sources: energy production, metal pro-cessing and other industrial processes consuming fuels. The snow samples were filtered and particles larger than 5 µm were counted.
3 Results
3.1 Local and synoptic weather
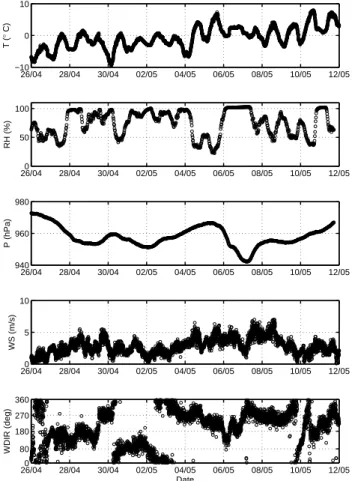
The campaign took place during typical Lapland late win-ter weather: alwin-ternating sunny and cloudy days, frost dur-ing nights and temperatures above zero durdur-ing days (Fig. 1). A few days before the beginning of campaign, 20–21 April, heavy thawing occurred, which left a 20–30 cm thick hard snow cover on the ground. The next days until 27 April were frosty with minimum of nearly –10◦C at night and maxi-mum temperatures of some 0◦C during midday. Winds at 10–1500 m heights blew permanently from Arctic Ocean, as seen from four day backward trajectories that were calculated using FNL data on the HYSPLIT4 model for several heights (not shown here). During this time, slight sporadic snowfalls formed a thin (2–3 cm) soft snow layer on the hard crust.
On 27–28 April a low pressure system passed over North-ern Finland. The Arctic air masses started dipping into south-ern Finland and later down to St. Petersburg region before arriving at the SMEAR I station. At night of 28 April an in-tense snowfall begun and continued with short breaks until the evening of the next day.
After this last snowfall the daily temperatures got grad-ually warmer towards the end of the campaign, night min-imum was –3◦C and day maximum +9◦C (Fig. 1). On 3 May the wind direction changed to westerly and the Arctic air toured over Scandinavia and on 7–10 May the air arrived again mainly from the Arctic.
3.2 Conditions of the surface layer
Observed upward sensible heat fluxes were highest at daytime of 30 April, about 200 W m−2 and more than 100 W m−2at 3–5, 8 and 10 May. Night-time fluxes were downward, usually up to 50 W m−2, only a few short-time fluctuations exceeded that value. The Monin-Obukhov length (Fig. 2) was under –100 m or over 100 m most of time, thus near-surface stratification was slightly stable at night and slightly unstable at daytime. Remarkable exclusions were 30 April and 10 May, when the stratification changed from strongly stable to strongly unstable. Relatively strong
26/040 28/04 30/04 02/05 04/05 06/05 08/05 10/05 12/05 5 10 WS (m/s) 26/04 28/04 30/04 02/05 04/05 06/05 08/05 10/05 12/05 −10 0 10 T ( ° C) 26/040 28/04 30/04 02/05 04/05 06/05 08/05 10/05 12/05 80 180 270 360 WDIR (deg) Date 26/040 28/04 30/04 02/05 04/05 06/05 08/05 10/05 12/05 50 100 RH (%) 26/04 28/04 30/04 02/05 04/05 06/05 08/05 10/05 12/05 940 960 980 P (hPa)
Fig. 1. Meteorological parameters measured at the SMEAR I
sta-tion during the LAPBIAT measurement campaign.
instability occurred at daytime on 2 May and strong instabil-ity at night before 5 May.
3.3 Trace gas and aerosol concentrations
In general, concentrations of SO2and NOx, that are mainly of anthropogenic origin, were below detection limit and 0.5 ppb, respectively (Fig. 3). High concentrations, over 4 ppb of SO2and 2 ppb of NOx, were observed on 30 April and 1 May. Elevated SO2 and NOx concentration of some 1 ppb were observed around 28–29 April and 10 May. In ad-dition SO2concentration was 5–10 ppb on 3 May and NOx concentration was elevated up to 2 ppb on 1 and 6 May. Ozone concentration was around 40 ppb, except on 29–30 April when it increased up to 60–50 ppb.
Concentrations of aerosol particles over 3 nm diameter ranged from minimum of a few hundred particles cm−3 be-fore nucleation events to 10 000 particles cm−3during one of the three observed aerosol particle nucleation events (Fig. 3). In general, the aerosol particle concentrations were in the order of some thousands particles cm−3. The total aerosol particle concentrations of all used instruments followed each other, showing pretty consistent results even in the rapidly
-0.10 -0.08 -0.06 -0.04 -0.02 0.00 0.02 0.04 0.06 0.08 0.10 28/04 29/04 30/04 01/05 02/05 03/05 04/05 05/05 06/05 07/05 08/05 09/05 10/05 11/05 12/05 Date L -1 (m -1)
Fig. 2. Reverse value of Monin-Obukhov length at the SMEAR I station during the LAPBIAT measurement campaign.
26/04 28/04 30/04 02/05 04/05 06/05 08/05 10/05 12/05 40 60 O3 (ppb) 26/04 28/04 30/04 02/05 04/05 06/05 08/05 10/05 12/05 0 10 20 SO 2 (ppb) 26/040 28/04 30/04 02/05 04/05 06/05 08/05 10/05 12/05 1 2 3 NO and NO x (ppb) 26/040 28/04 30/04 02/05 04/05 06/05 08/05 10/05 12/05 2000 4000 6000 8000 10000 12000 14000 16000 Date Particle concentration (cm −3 ) NO NO x DMPS Dp>3nm EAS Dp>3nm LICPC1 D p > 10 nm LICPC2 Dp>4.5 nm LICPC3 Dp>4.5 nm CPC D p>16 nm PHAUCPC Dp>3nm
Fig. 3. Measured trace gas and aerosol number (for used aerosol measurement instruments see Table 2) concentrations at the SMEAR I station during the LAPBIAT measurement campaign.
10-10 10-9 10-8 10-7 10-6 10-5 10-4 10-4 10-2 100 102 104 Diameter (m) d N /d lo g Dp ( c m -3) 08-May-2003 DMPS AIS-AIS+ APS EAS
Fig. 4. Comparison of size distribution measurements performed
using 4 different instruments at SMEAR I station. Air ion spec-trometer measured only air ions all other measured total aerosol concentration.
changing meteorological conditions, e.g. in temperature and pressure, of Northern spring.
The aerosol particle and air ion size distributions measured using four different instruments are shown in Fig. 4. Also dif-ferent size distribution measurements agreed with each other at overlapping sizes. APS was calibrated using MOUDI im-pactor as part of the campaign objectives. A comparison exercise revealed that APS was undercounting in submicron
Spheroidal particles 0 500 1000 1500 2000 2500 F lu x , # m -2 p e r d a y
April 22-27 April 28 - May 1
Ca2+ 0.00 0.10 0.20 0.30 0.40 0.50 0.60 0.70 0.80 0.90 F lu x , m g m -2 p e r d a y
April 22-27 April 28 - May 1
SO4 2-0.00 0.20 0.40 0.60 0.80 1.00 1.20 F lu x , m g m -2 p e r d a y
April 22-27 April 28 - May 1
NO3 -0.00 1.00 2.00 3.00 4.00 5.00 6.00 7.00 F lu x , m g m -2 p e r d a y
April 22-27 April 28 - May 1
Cl -0.00 0.05 0.10 0.15 0.20 0.25 0.30 0.35 0.40 0.45 F lu x , m g m -2 p e r d a y
April 22-27 April 28 - May 1
NH4 + 0.00 0.05 0.10 0.15 0.20 F lu x , m g m -2 p e r d a y
April 22-27 April 28 - May 1
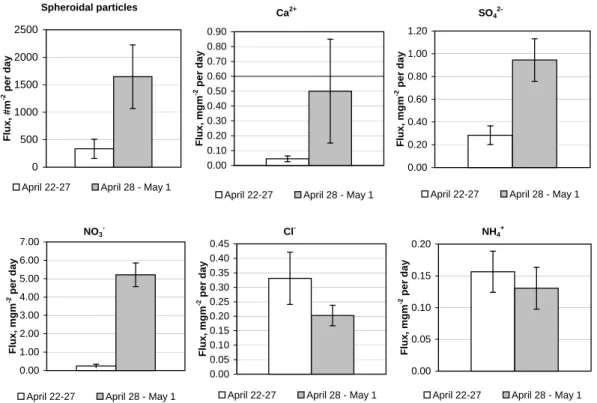
Fig. 5. Average deposition fluxes with error bars of inorganic compounds and spheroidal particles of two sampling periods during the
LAPBIAT measurement campaign, in # m−2per day for spheroidal particles and mg m−2per day for other species. The fluxes are based on snow samples that were collected from several locations close to SMEAR I station.
range and over counted in over µm size range (Fig. 4). In fact APS model 3320 is not capable of reliably measuring aerosol concentration above 10 µm due to recirculation of particles inside instrument (Stein et al., 2002). The used instruments, altogether, measured sizes from 0.4 nm to 20 000 nm. This is the widest size range measured so far at subarctic conditions. 3.4 Coarse aerosol deposition by and to snow
Total snow-sample-based deposition fluxes of major ions and spheroidal particles were clearly higher during the second sample period of 28 April–1 May than during the first pe-riod of 22–27 April (Table 3). Consequently, their diurnal deposition was the even much smaller for the first than for the second period (Fig. 5). The diurnal comparisons show that deposition of chloride (Cl−)is the only strong exception, while ammonium (NH+4)does not show significant differ-ence. Concentrations of sodium (Na+)and potassium (K+) in the snow water were close to the detection limit in all snow samples.
Only one sample (No 5) represents the short intense snow accumulation period on 28–29 April. The sample shows that most of deposition (except Ca and spheroidal particles) dur-ing 28 April–1 May may have occurred already durdur-ing the first day.
The deposition of large (presumably mineral) aerosol par-ticles was calculated based on the coarse-parpar-ticles
mea-sured by EAS. According to the lower size limit of detect-ing the spheroidal particles in snow samples, the concen-trations of aerosol particles in two and a half largest frac-tions of EAS spectra (5–10 µm) were taken into account. In this size range, gravitation is the dominant deposition mechanism. The gravitational settling velocities were calcu-lated from Stokes’ law, assuming spherical shape of aerosol particles and density of 2800 kg m−3 for particulate matter. These selected properties are rather typical for mineral mat-ter, e.g. silicate-rich fly ash.
The first snow sampling period (22–27 April) was from a period before the beginning of the campaign and the start of EAS measurements. We can only compare the later snow samples with the measured aerosol fluxes. The later snow sampling period was assumed to begin nearly at midnight right before 28 April, but EAS measurements are not avail-able until early afternoon of the same day. Thus we used the average of the first 8 h as an approximation the aerosol par-ticle size spectra for the previous night and forenoon hours, which count about 30% of the accumulation time of snow sample from site 5, 28–29 April sample, and for about 15% for the other snow samples between 28 April–1 May. This way, we estimate the accumulated gravitational deposition from the EAS measurements was 7.5×10⁶aerosol particles during 28-29 April and 9.7×10⁶aerosol particles during 28 April–1 May. We estimated the mass deposition fluxes of
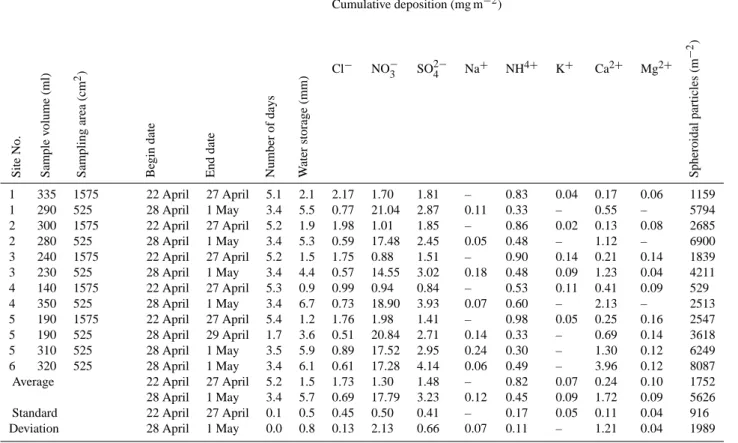
Table 3. Results of snow-based deposition measurements from 6 locations (Site: No 1 at 67◦45′04′′N, 29◦35′36′′E; No 2 at 67◦45′9′′N, 29◦32′56′′E; No 3 at 67◦45′12′′N, 29◦33′10′′E; No 4 at 67◦45′26′′N, 29◦36′10′′E; No 5 at 67◦45′26′′N, 29◦36′47′′E; No 6 at 67◦45′30′′N, 29◦36′9′′E). Cumulative deposition (mg m−2) Site No. Sample v olume (ml) Sampling area (cm 2) Be gin date End date Number of days W ater storage (mm) Cl− NO−3 SO2−4 Na+ NH4+ K+ Ca2+ Mg2+ Spheroidal particles (m − 2) 1 335 1575 22 April 27 April 5.1 2.1 2.17 1.70 1.81 – 0.83 0.04 0.17 0.06 1159 1 290 525 28 April 1 May 3.4 5.5 0.77 21.04 2.87 0.11 0.33 – 0.55 – 5794 2 300 1575 22 April 27 April 5.2 1.9 1.98 1.01 1.85 – 0.86 0.02 0.13 0.08 2685 2 280 525 28 April 1 May 3.4 5.3 0.59 17.48 2.45 0.05 0.48 – 1.12 – 6900 3 240 1575 22 April 27 April 5.2 1.5 1.75 0.88 1.51 – 0.90 0.14 0.21 0.14 1839 3 230 525 28 April 1 May 3.4 4.4 0.57 14.55 3.02 0.18 0.48 0.09 1.23 0.04 4211 4 140 1575 22 April 27 April 5.3 0.9 0.99 0.94 0.84 – 0.53 0.11 0.41 0.09 529 4 350 525 28 April 1 May 3.4 6.7 0.73 18.90 3.93 0.07 0.60 – 2.13 – 2513 5 190 1575 22 April 27 April 5.4 1.2 1.76 1.98 1.41 – 0.98 0.05 0.25 0.16 2547 5 190 525 28 April 29 April 1.7 3.6 0.51 20.84 2.71 0.14 0.33 – 0.69 0.14 3618 5 310 525 28 April 1 May 3.5 5.9 0.89 17.52 2.95 0.24 0.30 – 1.30 0.12 6249 6 320 525 28 April 1 May 3.4 6.1 0.61 17.28 4.14 0.06 0.49 – 3.96 0.12 8087
Average 22 April 27 April 5.2 1.5 1.73 1.30 1.48 – 0.82 0.07 0.24 0.10 1752
28 April 1 May 3.4 5.7 0.69 17.79 3.23 0.12 0.45 0.09 1.72 0.09 5626
Standard 22 April 27 April 0.1 0.5 0.45 0.50 0.41 – 0.17 0.05 0.11 0.04 916
Deviation 28 April 1 May 0.0 0.8 0.13 2.13 0.66 0.07 0.11 – 1.21 0.04 1989
aerosol particles from the same EAS data (Fig. 6) and ob-tained deposition values between 0 to 500 ng m−2s−1. Our results show that the spheroidal particles constitute only a minor part (about 0.1%) of total number concentration of aerosol particles in coarse fractions. This is expected, since even oil-shale fly ash, that is characterized by spheroidal par-ticles, contains about 2×10⁵ to 2×10⁶ spheroidal particles per gram (Kaasik et al., 2005) which suggest that only 1% or less of aerosol particles are of this type.
3.5 Particle formation events
During the two-week campaign, three new aerosol particle formation events were observed. We will focus here on the event that we observed at SMEAR I station on 30 April, 2003. In the morning of that day, air masses arrived to V¨arri¨o from the Arctic Ocean. At noon the situation changed and while higher altitude (above 2000 m a.s.l.) air masses con-tinued to arrive straight from the Arctic the lower level (be-low 1200 m a.s.l.) air masses passed deeper through the Kola Peninsula (Fig. 7).
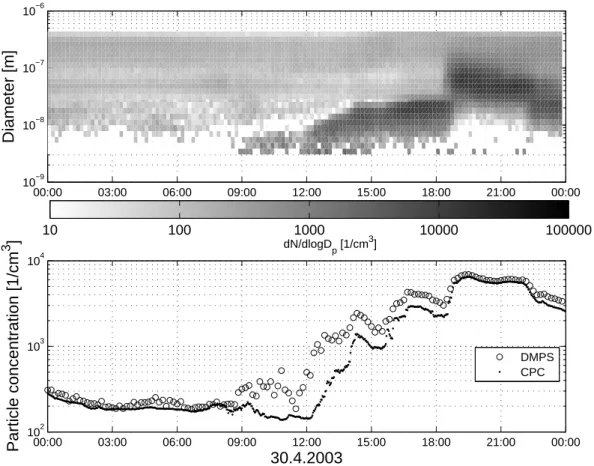
The aerosol particle formation event begun at noon and was finished around 06:30 p.m. by a sudden appearance of
larger aerosol particles in the size range of 20–200 nm as can be seen from aerosol particle size distributions measured with DMPS (Fig. 8) and EAS. This sudden change hap-pened because of the change in the air mass demonstrated in Sect. 3.7. The difference in number concentration be-tween aerosol particle size distribution measured by DMPS and number concentration measured by CPC TSI 3760 was largest between 09:00 to 12:00 a.m., which supports the sug-gestion that at that time there was aerosol particle forma-tion and growth of smaller than the 14 nm diameter aerosol particles that can be observed with the aerosol particle number concentration measurements. Small aerosol parti-cles were also observed from the ultrafine aerosol particle measurements made with the PHA-UCPC on from around 09:00 a.m. until 02:00 p.m., but not before or later (Fig. 3). The number concentrations from aerosol particle size distri-bution measured by DMPS and number concentration mea-surements by CPC TSI 3760 evened up at 06:15 p.m. At the same time around 06:30 p.m. the size distribution maximum moved to clearly towards larger-sized aerosol particles and there was a notable step up in the aerosol particle number concentration.
0 20 40 60 80 100 120 140 160 180 200 28/04 29/04 30/04 01/05 02/05 03/05 04/05 05/05 06/05 07/05 08/05 09/05 10/05 11/05 12/05 Date N u m b e r d e p o s iti o n fl u x (m -2s -1)
Fig. 6. Number deposition fluxes of coarse aerosol particles in size range 5–10 µm, based on EAS measurements and gravitational settling
assumption during the LAPBIAT measurement campaign at SMEAR I station.
(a)
75 ★ ▼ ▲ ▼ ▲ ▼ ▲ ▼ ▲ ★ ❏ ■ ❏ ■ ❏ ■ ❏ ■ ★ ❍ ● ❍ ● ❍ ● ❍ ● ★ ▼ ▲ ▼ ▲ ▼ ▲ ▼ ▲ ★ ❏ ■ ❏ ■ ❏ ■ ❏ ■ ★ ❍ ● ❍ ● ❍ ● ❍ ● 500 1000 1500 2000 2500 3000 3500 4000 500 1200 2000 00 04/30 12 04/2900 12 04/2800 12 04/2700 12NOAA HYSPLIT MODEL
Backward trajectories ending at 10 UTC 30 Apr 03
FNL Meteorological Data Source ★ at 67.77 N 29.58 E Meters AGL
(b)
75 ★▲ ▼ ▲ ▼ ▲ ▼ ▲ ▼ ★ ■ ❏ ■ ❏ ■ ❏ ■ ❏ ★ ● ❍ ● ❍ ● ❍ ● ❍ ★▲ ▼ ▲ ▼ ▲ ▼ ▲ ▼ ★■ ❏ ■ ❏ ■ ❏ ■ ❏ ★● ❍ ● ❍ ● ❍ ● ❍ 1000 2000 3000 500 1200 2000 12 00 04/30 12 00 04/29 12 00 04/28 12 00 04/27 NOAA HYSPLIT MODELBackward trajectories ending at 16 UTC 30 Apr 03
FNL Meteorological Data
Source
★
at 67.77 N 29.58 E
Meters AGL
Fig. 7. Backward trajectories calculated using FNL data on the HYSPLIT4 model for 500, 1200 and 2000 m level at (a) 12:00 a.m. and (b)
06:00 p.m. for SMEAR I station (UTC+2 h), 30 April 2003.
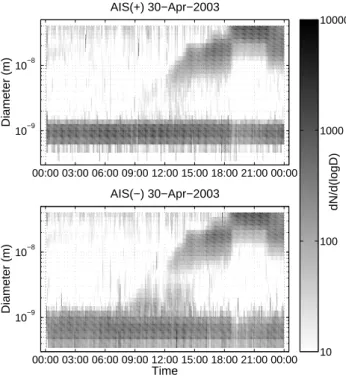
The evolution of the charged fraction of aerosol parti-cles, air ions in the size rage of 1.6–40 nm measured by AIS (Fig. 9), showed the same tendency as aerosol particles (Fig. 8). The generation of new particles followed by the intermediate ion (1.6–7.4 nm) measurements started at about 08:30 displaying the concentration maxima at 09:00 a.m. and 01:00 p.m. The concentration of negative light intermediate ions (1.6–3.3 nm) increases significantly during the
nucle-ation burst, while the positive light intermediate ions stayed nearly at the same low background level. The concentrations of negative and positive intermediate ion in the size range of 3.3–7.4 nm were nearly equal. The excess of the nega-tively charged fraction is probably a robust indicator of the ion-induced nucleation on negative small (cluster) ions. The diurnal variation in the concentration of small (cluster) ions (diameter 0.46–1.6 nm) displayed a slight maximum around
00:00 03:00 06:00 09:00 12:00 15:00 18:00 21:00 00:00 102 103 104
Particle concentration [1/cm
3]
30.4.2003
DMPS CPC 00:00 03:00 06:00 09:00 12:00 15:00 18:00 21:00 00:00 10−9 10−8 10−7 10−6Diameter [m]
dN/dlogD p [1/cm 3] 10 100 1000 10000 100000Fig. 8. Aerosol particle size distribution from DMPS measurements (a) and aerosol particle number concentrations from DMPS and CPC
measurements (b) in SMEAR I station, 30 April 2003.
midday. A considerable decrease in the concentration of small ions as a result of the scavenging of small ions by aerosol particles followed after a sudden increase in the num-ber concentration and the mean diameter of the aerosol par-ticles at 06:30 p.m.
In Fig. 10 we present the growth rates as a function of size of aerosol particles measured by DMPS and charged aerosol particles (air ions) measured by AIS. We estimated the growth rates as temporal changes of diameter correspond-ing to the maximum number concentration in the measured size distribution. We fitted the data points with a polynomial of degree 3 that fits the data in a least square sense. The Fig. 10 shows the rather steep increase of growth rate with size at smaller diameters that levels out at diameter of about 10 nm.
3.6 Fine aerosol number fluxes
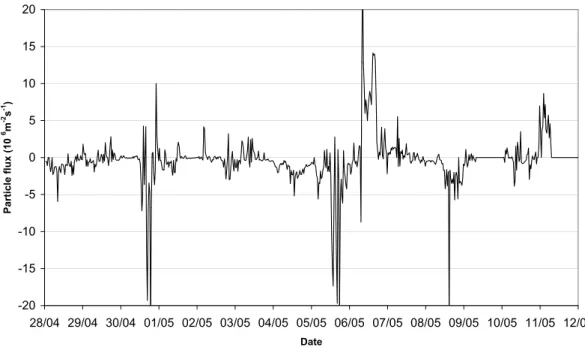
The turbulent aerosol number flux is shown in Fig. 11 (pos-itive is upward net fluxes, negative is downward fluxes or deposition). Many combined factors are needed in order to understand the changes between up and downward fluxes. Local emissions cannot be entirely excluded in order to ex-plain the upward fluxes, but they can also be caused by
non-stationary conditions when the eddy covariance method is not valid. What one must understand is that this is total aerosol number fluxes, dominated by the size range where both number concentrations and Brownian diffusion is the largest, at diameters <100 nm. Therefore, the coarse mode fluxes estimated and discussed in Sect. 3.4 have no connec-tion to the measured fluxes. Periods of high concentraconnec-tions of aerosol particles <100 nm diameter are interesting, though as they can explain large deposition fluxes (for particle num-ber concentration see Fig. 3). In Fig. 11 we can see several such periods, including the pollution episode like 3 May, and the aerosol formation events at 30 April, 5 May and 8 May. On all days when aerosol formation was observed, there were also large deposition fluxes, in agreement with previous ob-servations. However, during pollution episode (3 May), SO2 concentration was high and aerosol flux pretty small. When there is aerosol formation, the aerosol number flux is down-ward indicating large deposition fluxes of small particles that recently formed above the surface layer/canopy (Nilsson et al., 2001). Considering example of the 24 h period from the midnight of 30 April to midnight of 1 May (Fig. 12), we see that the vertical aerosol flux is almost ideally zero un-til the aerosol formation event begins. After 12:00 a.m. the aerosol flux fluctuated strongly, but was mainly towards the
00:00 03:00 06:00 09:00 12:00 15:00 18:00 21:00 00:00 10−9 10−8 Diameter (m) AIS(+) 30−Apr−2003 00:00 03:00 06:00 09:00 12:00 15:00 18:00 21:00 00:00 10−9 10−8 Time Diameter (m) AIS(−) 30−Apr−2003 10 100 1000 10000 dN/d(logD)
Fig. 9. Air ion size distribution from (AIS) for positive (upper
panel) and negative air ions in SMEAR I station, 30 April 2003.
surface. Strongest downward flux appeared just at the mo-ment of the outbreak of polluted air, but during the next hour the nearly-zero average flux was restored but strong fluctu-ations continued. The reoccurring varifluctu-ations in the vertical aerosol number flux may be due to presence of secondary circulations in the boundary layer, such as cloud streets (Bu-zorius et al., 2001). These circulations have a period near the 30 min averaging period of the flux calculations, which cause these fluctuations.
3.7 Simulation of 30 April particle formation event The rapid change from clean to polluted air mass during 30 April was simulated with a Lagrangian particle model SILAM (Finnish Meteorological Institute), for a detailed de-scription see Sofiev et al. (2005). The sulphate concentration in the air was used as an indicator of industrial pollution. EMEP data of industrial emissions from Central and North-ern Europe, including Kola Peninsula were applied. We in-cluded SO2emissions, and calculated its conversion into sul-phate within the SILAM model. Model results (Fig. 13) show only marginal concentrations of SO−42(below 0.1 ppb) dur-ing the nucleation event, but the SO−42increases to the order of ppbs just after the breakdown of aerosol particle forma-tion event. We also observed the same change in the mea-sured concentrations of SO2 and NOx. On 30 April, both measured concentrations were below the detection limit until they abruptly rose in the evening up to concentrations of over 4 ppb of SO2and 1 ppb of NOx(Fig. 3). 0 5 10 15 20 25 30 0 1 2 3 4 5 6 Particle diameter (nm)
Growth rate (nm/h) AIS 30.04.2003 AIS fitting DMPS 30.04.2003 DMPS fitting
Fig. 10. The new particle and air ion growth rates as a function of
size on 30 April 2003 at SMEAR I station.
3.8 Aerosol mass and size-segregated inorganic composi-tion
A size-segregated aerosol mass concentration along with an unresolved mass is presented in Fig. 14. The first week of the campaign was generally clean with only a brief pollution outbreak. The second week was generally polluted bring-ing aged air masses from east and west. Accumulation and coarse modes are clearly revealed and there was little differ-ence between two samples from aerosol mass point of view. The accumulation mode was centred around 0.4 µm and the coarse mode mean diameter was around 2 µm. One can also see the upper shoulder of the Aitken mode, since the concen-tration of the first stage did not follow a decreasing pattern. However, the unresolved mass (difference between gravimet-ric mass and sum of analyzed inorganic species) showed sig-nificant difference between the samples, especially in the ac-cumulation mode, where the unresolved mass was relatively small during the second week of the campaign. During the first week of the campaign there was large unresolved mass across all the sizes. Figure 15 presents the detailed contribu-tion of each of inorganic species to the analyzed mass.
Most of the unresolved aerosol mass according to Fig. 14b can be attributed to organic matter, especially as long as the accumulation mode is concerned. Hence, organic mat-ter contributed very significantly to the Aitken mode mass in both samples and the accumulation mode mass only in the first week sample. Figure 15a shows large contribution of sulphate to the Aitken mode mass and large contribution of ammonium to the accumulation mode. At the same time there was a very significant ion imbalance with a significant lack of positive ions in the Aitken mode and negative – in the accumulation mode. A significant lack of negative ions in the accumulation mode is thought to be due to not ana-lyzed organic carbon species, e.g. organic acids or humic-like substances. Organic acid ions are humic-likely contributing
-20 -15 -10 -5 0 5 10 15 20 28/04 29/04 30/04 01/05 02/05 03/05 04/05 05/05 06/05 07/05 08/05 09/05 10/05 11/05 12/05 Date Pa rt ic le f lu x ( 1 0 6m -2s -1)
Fig. 11. Number deposition fluxes of aerosol particles measured by eddy covariance technique in SMEAR I station.
-25 -20 -15 -10 -5 0 5 10 15 0:00 3:00 6:00 9:00 12:00 15:00 18:00 21:00 0:00 Time (hours) Pa rt ic le f lu x ( 1 0 6m -2s -1)
Fig. 12. Number deposition fluxes of aerosol particles measured using eddy covariance technique in SMEAR I station, closer view of 30
April.
to lacking negative ions and owing to their large molecular mass to significantly unresolved particulate mass in the first week sample. Another common anion not measured in this study is carbonate, but it is not quite common in accumula-tion mode and considering its relatively low molecular mass not quite capable of balancing the mass. In the aged polluted second week sample the ion balance was generally uniform
across all the sizes with sulphate and ammonium dominating the accumulation mode. Owing to significant differences in concentration, mode and ion balance it is likely that the first week sample was a mixture of nucleation process and pollu-tion outbreak. Therefore, it is likely that nucleapollu-tion events involved sulphuric acid and organics, while during pollu-tion outbreak the accumulapollu-tion mode was only enriched in
(a)
(b)
Fig. 13. SILAM model results for concentrations of sulphate ion in the air on 30 April: (a) average for 10:30–13:30 local time, in beginning
of an observed aerosol formation event; (b) average for 19:30–22:30, shortly after the formation event was interrupted.
ammonium, but not sulphate, thus confirming that pollution source was likely not very distant, only as far as Kola penin-sula. However, coarse size resolution of MOUDI impactor and lack of analyzed organics does not allow firm conclu-sions. It is becoming obvious that a high resolution aerosol mass spectrometer capable of high resolution aerosol mass and chemical measurements is needed to advance a link be-tween chemical composition and atmospheric processes.
4 Discussion
4.1 Coarse aerosol deposition
Looking at the aerosol particle deposition (snow-based de-position measurements) data (Table 3, Fig. 5), it is obvious that the air was much cleaner, regarding mineral matter and main anthropogenic pollutants, before 28 April than after-wards. The only exception, chloride, is in agreement with the assumption of clean Arctic air mass: Cl in the snow sam-ples probably originated from the seawater droplets blown up from the open Arctic Ocean a few hundred kilometres to north and northwest from the SMEAR I station. Also, re-sults from the SILAM model as well as the SO2 and NOx measurements support these concepts.
Extremely large difference between the sample periods in deposition fluxes of nitrate seem to be related to the outbreak of more polluted air mass together with the snowfall. On the other hand, the deposition fluxes based on the sample of 28–
29 April suggest that nearly entire deposition of most species during 28 April to 1 May occurred in first one and a half days of that period. However, this is not the case for the fluxes of Ca and spheroidal particles (i.e. presumably mineral matter in coarse particles): nearly a half of these species deposited after the evening of 29 April, possibly simultaneously with the outbreak of polluted air from Kola Peninsula.
The coarse aerosol particle (5–10 µm) number flux es-timations based on the EAS measurements (Fig. 6) result in total mass deposition of 25 mg m−2for 28–29 April and 32 mg m−2for a longer time 28 April–1 May. On the other hand, estimations based on snow samples (Table 3) suggest deposition of about 25 mg m−2 for 28–29 April and nearly zero for the rest of the longer time, i.e. 30 April–1 May. This is in fair agreement regarding the numerous assump-tions made in the aerosol particle flux estimaassump-tions based on the EAS measurements, limited statistics and probably non-comprehensive set of analysed chemical species. Both es-timations of aerosol particle flux indicated that major part of the aerosol particle mass was deposited at 28 April and morning of 29 April. Then an outbreak of clean air mass followed, enabling the nucleation event at 30 April. Despite the notable number concentration of the newly formed par-ticles, their mass concentration remained negligible. In the evening of 30 April and the following night some aerosol particle mass deposition occurred again from the industrially polluted air.
(a)
a)
p 0.1 1 10 0.01 0.1 1 10 100 dp (µm) d M /d lo g dp (µ g m -3) 24/04-06/05 06/05-11/05 (b)b)
0 0.1 0.2 0.3 0.4 0.5 0.6 0.7 0.8 0.9 1 0.01 0.1 1 10 100 u n re so lv e d ma s s (% ) 24/04-06/05 06/05-11/05 dp (µm)Fig. 14. (a) Size-segregated mass distribution and (b) unresolved
mass (gravimetric mass – sum of inorganics) determined from MOUDI samples in SMEAR I station.
It is possible that nitrates and sulphates originated from the aged pollution in the form of fine aerosol, scavenged at the cloud level and washed out during the snowfall. A re-markable part of Ca (coupled with carbonate or other ions that were not analysed) and aerosol particles may have been carried by the air mass from industrial areas of Kola and dry deposited on the snow cover, as there was no snowfall dur-ing the aerosol pollution event at 30 April. From our es-timations that the wind velocity at 500 m height was about 10 m s−1and velocity of gravitational fall for 5–10 µm min-eral aerosol particles was in order of 5 mm s−1, we noticed that this diameter aerosol particles descended about 0.5 mm per meter of passing air, equalling to only 70–100 m dur-ing the atmospheric transport from Monchegorsk or Nikel. Thus, as stack height plus initial rise of buoyant plume for large industrial releases is typically a few hundreds of me-ters, spheroidal particles from these sources can easily reach V¨arri¨o and in dry weather a certain part of them pass well over that distance. However, cloud condensation processes can dramatically change the transportation distance.
(a)
a)
0% 20% 40% 60% 80% 100% p re -s ta g e 9 .9 -1 8 .0 6 .2 -9 .9 2 .5 -6 .2 1 .8 -2 .5 1 .0 -1 .8 0 .5 6 0 -1 .0 0 .3 1 0 -0 .5 6 0 0 .1 8 0 -0 .3 1 0 0 .1 0 0 -0 .1 8 0 0 .0 5 6 -0 .1 0 0D50 stage diam eters, µm
nss SO4 NH4 NO3 Cl Na K Ca µ (b) µ
b)
0% 20% 40% 60% 80% 100% p re -s ta g e 9 .9 -1 8 .0 6 .2 -9 .9 2 .5 -6 .2 1 .8 -2 .5 1 .0 -1 .8 0 .5 6 0 -1 .0 0 .3 1 0 -0 .5 6 0 0 .1 8 0 -0 .3 1 0 0 .1 0 0 -0 .1 8 0 0 .0 5 6 -0 .1 0 0D50 stage diam eters, µm
nss SO4 NH4 NO3 Cl Na K Ca
Fig. 15. Size-segregated aerosol inorganic composition as mass
fractions determined from MOUDI samples in SMEAR I station
(a) 24 April–6 May 2003 and (b) 6–11 May 2003.
Snow-based deposition measurements have been earlier successfully used to measure deposition loads, distinguish different periods of deposition and validate the air quality models in the conditions of Northern Europe (Kaasik et al., 2000; Sofiev et al., 2003). However, this is the first time they were coupled with extensive aerosol particle measure-ments. The results from this campaign suggest that coordi-nated aerosol and deposition measurements open new possi-bilities for interpreting the results.
4.2 Fine mode aerosol fluxes and formation
Our campaign results are consistent with the previous ob-servation that aerosol particle formation and growth events occur typically during clear sky conditions (Vehkam¨aki et al., 2004). Prior the formation event the condensation sink decreased, the same has been observed by Vehkam¨aki et al. (2004), in about half of formation events observed in
V¨arri¨o. This was explained by Nilsson et al. (2001) as dilu-tion caused by entrainment of clean air from above the mixed layer.
Higher ozone concentrations have also been observed dur-ing event days, which could be explained by photochemi-cal reaction cycles (Seinfeld and Pandis, 1998). The same could explain the observed lower NOxconcentrations. In ad-dition, biogenic activity could be higher on sunny days and emissions of biogenic VOCs of e.g. monoterpenes could be higher and once oxidized these compounds may contribute to the aerosol particle growth (see also Tunved et al., 2006). These findings are similar to the recent observation made in Hyyti¨al¨a at SMEAR II station (Kulmala et al., 2004b; Lyubotseva et al., 2005).
The aerosol fluxes measured by eddy covariance method in the beginning of all three observed nucleation events (30 April, 5 May and 8 May) were downwards (clear peaks in Fig. 5), indicating that the main process of formation of new aerosol particles was going on above the canopy. This is in agreement with the conclusions of Nilsson et al. (2001) and Buzorius et al. (2001) for SMEAR II station observations in Hyyti¨al¨a.
The particle growth rates were estimated for the observed nucleation events, fitting the concentration maximums for AIS, DMPS and EAS spectral fractions as described by Hir-sikko et al. (2005). The basic concept of two linear sections fitting to the maximums of different particle size intervals was found valid (Table 4). The event No 2, gives too high growth rate, in comparison with others, and this is associated with change of air masses. Otherwise the observed growth rates are in agreement with those described elsewhere (Kul-mala et al., 2004a, 2005; Komppula et al., 2006).
5 Summary and conclusions
The LAPBIAT measurement campaign took place in the SMEAR I measurement station located in Eastern Lapland in the spring of 2003 between 26 April and 11 May. LAPBIAT (Lapland Atmosphere-Biosphere) facilitys’ goal is to en-hance the international scientific co-operation at the Finnish Arctic research stations involved in the program. In this pa-per we have described the measurement campaign, concen-trations and fluxes of aerosol particles and air ions, paying special attention to an aerosol particle formation event bro-ken by a polluted air mass approaching from industrial areas of Kola Peninsula, Russia. Besides this we have also reported trace gas concentrations and used snow samples to verify de-position processes.
The main aim of the study is to find out different features of new particle formation using various experimental meth-ods. During the campaign three aerosol particle formation events were observed. The events were characterised mea-suring air ion and aerosol particles size distributions, size-segregated aerosol composition, number and mass fluxes,
Table 4. Particle growth rates during observed nucleation events at
SMEAR I station.
Nucleation event Size interval Growth rate (nm h−1) of particles (nm) AIS DMPS EAS Event 1 (30 April) 3–7 2.0 2.2 1.7 7–20 3.3 3.7 3.3 Event 2 (5 May) 3–7 – – – 7–20 15.6 13.0 14.2 Event 3 (8 May) 3–7 – 1.5 1.8 7–20 1.4 1.3 1.4
deposition to snow and trace gas concentrations. The new particle formation events are typically related to clean Arc-tic air. The cleaness of the air mass is seen from size dis-tribution measurements and also from the results of size-segregated impactor measurements and snow samples. In clean air masses the main component is sea salt, an in pol-luted air masses the concentration of other inorganic com-pounds were significantly larger.
During and just before events, the concentrations of pre-existing aerosols, larger than nucleation mode sizes were at their lowest concentration. During the events the concentra-tion of intermediate ions increased indicating that ions are particpating in new particle formation. However, their con-tribution is not dominating one. Correspondingly, the ob-served foramtion and growth rates are in agreement with val-ues observed in other continental environments (see Kulmala et al., 2004a) and also the increase of the growth rate as a function of particle size was observed (see Hirsikko et al., 2005). The strong downward aerosol (number concentra-tion) fluxes during all three observed nucleation events sug-gest that new aerosol particles are formed above the canopy and transported down into the canopy layer.
If the Arctic air mass changed its route (like in 30 April) and passed trough industrial area in Kola Peninsula, the trace gas and aerosol concentrations increased and the aerosol composition changed. Due to this strong anthropogenic in-fluence the new particle formation was not possible in that air mass, and the formation event seen at the site was inter-rupted.
This event was a good proof of dramatic influence of high pre-existing aerosol concentrations to the new particle forma-tion and their subsequent growth by condensaforma-tion (conden-sation growth). The rapid increase of pre-existing aerosol concentration prevents further aerosol formation. Another proof was found in low aerosol concentrations before nucle-ation events. Both of those findings support recent theoretical findings (e.g. Kerminen and Kulmala, 2002; Kulmala et al., 2006).
Snow sampling is shown to be a fruitful additional mea-sure to aerosol size distribution meamea-surements. Chemical and microscopic analyses of snow provide valuable information on the pollution of air mass at the coarse end of the aerosol particle spectrum. Reciprocal verification of measurements from air and from snow is possible and enhances the relia-bility of both measurements. Transport modelling based on atmospheric dynamics is also a useful tool for aerosol re-search, indicating the precise locations of aerosol sources. Closer coupling of atmospheric and aerosol models is sug-gested for the future.
Acknowledgements. This work was supported by Nordic Centre of Excellence BACCI, by the EU-project LAPBIAT, by the Swedish Research Council and by the Estonian Science Foundation, grants no. 4622, 5387 and 5002. Authors would like to thank D. Jasinevi-ciene in Institute of Physics, Lithuania for inorganic analysis of MOUDI samples. The authors gratefully acknowledge the NOAA Air Resources Laboratory (ARL) for the provision of the HYSPLIT transport and dispersion model used in this publication.
Edited by: R. Cohen
References
Alliksaar, T., H¨orstedt, P., and Renberg, I.: Characteristic fly-ash particles from oil-shale combustion found in lake sediments, Wa-ter, Air, Soil Pollut., 104, 149–160, 1998.
Bonn, B. and Mootgard, G. K.: Sesquiterpene Ozonolysis: Origin of Atmospheric New Particle Formation from Bio-genic Hydrocarbons, Geophys. Res. Lett., 30(11), 1585, doi:10.1027/2003GL017000, 2003.
Boy, M. and Kulmala, M.: Nucleation Events in the Continental Boundary Layer: Influences of Physical and Meteorological Pa-rameters, Atmos. Chem. Phys., 2, 1–16, 2002,
http://www.atmos-chem-phys.net/2/1/2002/.
Buzorius, G., Rannik, ¨U., Nilsson, D., and Kulmala, M.: Vertical Fluxes and micrometeorology during aerosol particle formation events, Tellus B, 53, 394–405, 2001.
Charlson R. J. and Wigley, T. M. L.: Sulphate aerosol and climate change, Scientific American, 207, 48–57, 1994.
Claeys M., Wu Wang, Ion, A. C., Kourtchev, I., Gelencser, A., and Maenhaut, W.: Formation of secondary organic aerosols from isoprene and its gas-phase oxidation products through reaction with hydrogen peroxide, Atmos. Environ., 38(25), 4093–4098, 2004.
Clarke, A. D.: Atmospheric Nuclei in the remote free troposphere, J. Atmos. Chem., 14, 479–488, 1992.
Dal Maso, M., Kulmala, M., Riipinen, I., Wagner, R., Hussein, T, Aalto, P. P., and Lehtinen, K. E. J.: Formation and growth rates of fresh atmospheric aerosols: eight years of aerosol size distri-bution data from SMEAR II, Hyyti¨al¨a, Finland, Boreal Environ. Res., 10, 323–336, 2005.
Draxler, R. R. and Rolph, G. D.: HYSPLIT (HYbrid Single-Particle Lagrangian Integrated Trajectory) Model access via NOAA ARL READY Website (http://www.arl.noaa.gov/ready/hysplit4.html), NOAA Air Resources Laboratory, Silver Spring, MD, 2003.
Hakola, H., Tarvainen, V., Laurila, T., Hiltunen, V., Hellen, H., and Keronen, P.: Seasonal Variation of VOC Concentrations over a Boreal Forest, Atmos. Environ., 37(12), 1623–1634, 2003. Hari, P., Kulmala, M., Pohja, T., Lahti, T., Siivola, E., Palva, L.,
Aalto, P., H¨ameri, K., Vesala, T., Luoma, S., and Pulliainen, E.: Air pollution in Eastern Lapland: challenge for an environmental measurement station, Silva Fennica, 28, 29–39, 1994.
Hirsikko, A., Laakso, L., H˜orrak, U., Aalto, P. P., Kerminen, V. M., and Kulmala, M.: Annual and size dependent variations of growth rates and ion concentrations in boreal forest, Boreal Env-iron. Res., 10, 375–369, 2005.
Kaasik, M., R˜o˜om, R., Røyset, O., Vadset, M., S˜oukand, ¨U., T˜ougu, K., and Kaasik, H.: Elemental and base anions deposition in the snow cover of north-eastern Estonia. The impact of industrial emissions, Water, Air, Soil Pollut., 121, 349–366, 2000. Kaasik, M., Alliksaar, T., Ivask, J., and Loosaar, J.: Spheroidal
fly ash particles from oil-shale-fired power plants in atmospheric precipitations. Possibilities of quantitative tracing, Oil Shale, 22, 547–562, 2005.
Kerminen, V.-M. and Wexler, A. S.: The occurrance of sulphuric acid-water nucleation in plumes: Urban Environment, Tellus B, 48, 65–82, 1996.
Kerminen, V.-M. and Kulmala, M.: Analytical formulae connecting the “real” and the “apparent” nucleation rate and the nuclei num-ber concentration for atmospheric nucleation events, J. Aerosol Sci., 33, 609–622, 2002.
Komppula, M., Lihavainen, H., Hatakka, J., Paatero, J., Aalto, P., Kulmala, M., and Viisanen, Y.: Observations of new particle formation and size distributions at two different heights and sur-roundings in subarctic area in northern Finland, J. Geophys. Res., 108(D9), 4295, doi:10.1029/2002JD002939, 2003.
Komppula, M., Sihto, S.-L., Korhonen, H., Lihavainen, H., Kermi-nen, V.-M., Kulmala, M., and ViisaKermi-nen, Y.: New particle forma-tion in air mass transported between two measurement sites in Northern Finland, Atmos. Chem. Phys., 6, 2811–2824, 2006, http://www.atmos-chem-phys.net/6/2811/2006/.
Korhonen, P., Kulmala, M., Laaksonen, A., Viisanen, Y., McGraw, R., and Seinfeld, J. H.: Ternary nucleation of H2SO4, NH3, and H2O in the atmosphere, J. Geophys. Res., 104, 26 349–26 353, 1999.
Kourtchev, I., Ruuskanen, T., Maenhaut, W., Kulmala, M., and Claeys, M.: Observation of 2-methyltetrols and related photo-oxidation products of isoprene in boreal forest aerosols from Hyyti¨al¨a, Finland, Atmos. Chem. Phys., 5, 2761–2770, 2005, http://www.atmos-chem-phys.net/5/2761/2005/.
Kulmala, M., Toivonen, A., M¨akel¨a, J., and Laaksonen, A.: Analy-sis of Nucleation Mode Particles Observed in Boreal Forest, Tel-lus B, 50, 449–462, 1998.
Kulmala, M., Pirjola, L., and M¨akel¨a, J. M.: Stable Sulphate Clus-ters as a Source of New Atmospheric Particles, Nature, 404, 66– 69, 2000.
Kulmala, M., H¨ameri, K., Aalto, P. P., M¨akel¨a, J. M., Pirjola, L., Nilsson, D. E., Buzorius, G,, Rannik, ¨U., Dal Maso, M., Seidl, W., Hoffman, T., Janson, R., Hansson, H.-C., Viisanen, Y., Laak-sonen, A., and O’Dowd, C. D.: Overview of the international project on biogenic aerosol formation in the boreal forest (BIO-FOR), Tellus B, 53, 324–343, 2001.
Kulmala, M., Vehkam¨aki, H., Pet¨aj¨a, T., Dal Maso, M., Lauri, A., Kerminen, V.-M., Birmili, W., and McMurry, P. H.: Formation
and growth rates of ultrafine atmospheric particles: A review of observations, J. Aerosol Sci., 35, 143–176, 2004a.
Kulmala, M., Suni, T., Lehtinen, K. E. J., Dal Maso, M., Boy, M., Reissell, A., Rannik, ¨U., Aalto, P., Keronen, P., Hakola, H., B¨ack, J., Hoffmann, T., Vesala, T., and Hari, P.: A new feedback mechanism linking forests, aerosols, and climate, Atmos. Chem. Phys., 4, 557–562, 2004b.
Kulmala, M., Pet¨aj¨a, T., M¨onkk¨onen, P, Koponen, I. K., Dal Maso, M., Aalto, P. P., Lehtinen, K. E. J., and Kerminen, V.-M.: On the growth of nucleation mode particles: source rates of condensable vapour in polluted and clean environments, Atmos. Chem. Phys., 5, 409–416, 2005,
http://www.atmos-chem-phys.net/5/409/2005/.
Kulmala, M., Lehtinen, K. E. J., and Laaksonen, A.: Cluster activa-tion theory as an explanaactiva-tion of the linear dependence between formation rate of 3 nm particles and sulphuric acid concentration, Atmos. Chem. Phys., 6, 787–793, 2006a.
Kulmala, M., Reissell, A., Sipil¨a, M., Bonn, B., Ruuskanen, T. M., Lehtinen, K. E. J., Kerminen, V.–M., and Str¨om, J.: Deep convective clouds as aerosol production engines: Role of insoluble organics, J. Geophys. Res., 111, D17202, doi:10.1029/2005JD006963, 2006b.
Laakso, L., Anttila, T., Lehtinen, K. E. J., Aalto, P. P., Kulmala, M., H˜orrak, U., Paatero, J., Hanke, M., and Arnold, F.: Kinetic nucle-ation and ions in boreal forest particle formnucle-ation events, Atmos. Chem. Phys., 4, 2353–2366, 2004a.
Laakso, L., Pet¨aj¨a, T., Lehtinen, K. E. J., Kulmala, M., Paatero, J., H˜orrak, U., Tammet, H., and Joutsensaari, J.: Ion production rate in a boreal forest based on ion, particle and radiation mea-surements, Atmos. Chem. Phys., 4, 1933–1943, 2004b. Logan, J. A.: Tropospheric ozone: Seasonal behavior, trends and
anthropogenic influence, J. Geophys. Res., 90, 10 463–10 482, 1985.
Lyubovtseva, Y. S., Sogacheva, L., Dal Maso, M., Bonn, B., Kero-nen, P., and Kulmala, M.: Seasonal variations of trace gases, meteorological parameters, and formation of aerosols in boreal forests, Boreal Environ. Res., 10, 493–510, 2005.
Marti, J. J., Weber, R. J., Saros, M. T., and McMurry, P. H.: Mod-ification of the TSI 3025 condensation particle counter for pulse height analysis, Aerosol Sci. Technol., 25, 214–218, 1996. Mordas, M., Kulmala, M., Pet¨aj¨a, T., Aalto, P. P., Matuleviˇcius,
V., Grigoraitis, V., Uleviˇcius, V., Grauslys, V., Ukkonen, A., and H¨ameri, K.: Design abd performance characteristics of a con-densation particle counter UF-02proto, Boreal Environ. Res., 10, 543–552, 2005.
M¨akel¨a, J. M., Aalto, P., Jokinen, V., Pohja, T., Nissinen, A., Palm-roth, S., Markkanen, T., Seitsonen, K., Lihavainen, H., and Kul-mala, M.: Observations of ultrafine aerosol particle formation and growth in boreal forest, Geophys. Res. Lett., 24, 1219–1222, 1997.
M¨akel¨a, J. M., Dal Maso, M., Pirjola, L., Keronen, P., Laakso, L., Kulmala, M., and Laaksonen, A.: Characteristics of the At-mospheric Particle Fomation Events Observed at a Boreal For-est Site in Southern Finland, Boreal Environ. Res., 5, 299–313, 2000.
M˚artensson, E. M., Nilsson E. D., Buzorius G., and Johansson, C.: Eddy correlation measurements and parameterisation of particle emissions in an urban environment, Atmos. Chem. Phys., 769– 785, 2006.
Nilsson, E. D., Rannik, ¨U., Buzorius, G., Kulmala, M., and O’Dowd, C.: Effects of the continental boundary layer evolu-tion, convecevolu-tion, turbulence and entrainment on aerosol forma-tion, Tellus B, 53, 441–461, 2001.
O’Dowd, C. D., H¨ameri, K., M¨akel¨a, J. M., Pirjola, L., Kul-mala, M., Jennings, S. G., Berresheim, H., Hansson, H.-C., de Leeuw, G., Kunz, G. J., Allen, A. G., Hewitt, C. N., Jackson, A., Viisanen, Y., and Hoffmann, T.: A dedicated study of new particle formation and fate in the coastal environment (PAR-FORCE): overview of objectives and achievements, J. Geophys. Res., 107(D19), 8108, doi:10.1029/2001JD000555, 2002a. O’Dowd, C., Aalto, P., H¨ameri, K., Kulmala, M., and Hoffmann, T.:
Atmospheric particles from organic vapours, Nature, 416, 497– 1798, 2002b.
O’Dowd, C. D., Aalto, P. P., Yoon, Y. J., and H¨ameri, K.: The use of the pulse height analyser ultrafine condensation particle counter (PHA-UCPC) technique applied to sizing of nucleation mode particles of differing chemical composition, J. Aerosol Sci., 35, 205–216, 2004.
Pirjola, L., Laaksonen, A., Aalto, P., and Kulmala, M.: Sulphate Aerosol Formation in the Arctic Boundary Layer, J. Geophys. Res., 103, 8309–8322, 1998.
Ruuskanen, T. M., Reissell, A., Keronen, P., Aalto, P. P., Laakso, L., Gr¨onholm, T., Hari, P., and Kulmala, M.: Atmospheric trace gas and aerosol particle concentration measurements in Eastern Lapland, Finland 1992–2001, Boreal Environ. Res., 8, 335–349, 2003.
Schr¨oder, F. and Str¨om, J.: Aircraft Measurements of submicrom-eter particles (>7 nm) in the midlatitude free troposphere and tropopause region, Atmos. Res., 44, 333–356, 1997.
Seinfeld, J. H. and Pandis, S. N.: Atmospheric Chemistry and Physics, Wiley, N. Y., 1236–1237, 1998.
Sofiev, M., Siljamo, P., Valkama, I., Ivonen, M., and Kukkonen, J.: A dispersion modelling system SILAM and its evaluation against ETEX data, Atmos. Environ., 40, 674–685, 2005.
Sofiev, M., Kaasik, M., and Hongisto, M.: Distribution of alkaline particles over the Baltic Sea basin, Water, Air, Soil Pollut., 146, 211–223, 2003.
Sopauskiene, D. and Jasineviciene, D.: Changes in precipitation chemistry in Lithuania for 1981–2004, J. Environ. Monitoring, 8, 347–352, 2006.
Stein, S. W., Gabrio, B. J., Oberreit, D., Hairston, P., Myrdal, P.,B., and Beck, T. J.: An evaluation of mass-weighted size distribution measurements with the Model 3320 aerodynamic particle sizer, Aerosol Sci. Technol., 36, 845–854, 2002
Tunved, T., Hansson, H.-C., Kulmala, M., Aalto, P., Viisanen, Y., Karlsson, H., Kristensson, A., Swietlicki, E., Dal Maso, M., Str¨om, J., and Komppula, M.: One year boundary layer aerosol size distribution data from five Nordic background stations, At-mos. Chem. Phys., 3, 2183–2205, 2003,
http://www.atmos-chem-phys.net/3/2183/2003/.
Tunved, P., Hansson, H.-C., Kerminen, V.-M., Str¨om, J., Dal Maso, M., Lihavainen, H., Viisanen, Y., Aalto, P. P., Komppula, M., and Kulmala, M.: High natural aerosol loading over boreal forests. Science, 312, 261–263, 2006.
Vana, M., Kulmala, M., Dal Maso, M. H˜orrak, U., and Tamm, E.: Comparative study of nucleation mode aerosol particles and in-termediate air ions formation events at three sites, J. Geophys. Res., 109, D17201, doi:10.1029/2003JD004413, 2004.
Vehkam¨aki, H., Dal Maso, M., Hussein, T., Flanagan, R., Hyv¨arinen, A., Lauros, J., Merikanto, J., M¨onkk¨onen, P., Pih-latie, M., Salminen, K., Sogacheva, L., Thum, T., Ruuskanen, T., Keronen, P., Aalto, P. P., Hari, P., Lehtinen, K. E. J., Rannik,
¨
U., and Kulmala, M.: Atmospheric Particle Formation Events At V¨arri¨o Measurement Station In Finnish Lapland 1998–2002, At-mos. Chem. Phys., 4, 2015–2023, 2004,
http://www.atmos-chem-phys.net/4/2015/2004/.
Virkkula, A., Hillamo, R. E., Kerminen, V.-M., and Stohl, A.: The influence of Kola Peninsula, continental European and marine sources on the number concentrations and scattering coefficients of the atmospheric aerosol in Finnish Lapland, Boreal Environ. Res., 2(4), 317–336, 1997.