HAL Id: hal-00327988
https://hal.archives-ouvertes.fr/hal-00327988
Submitted on 29 Nov 2005HAL is a multi-disciplinary open access
archive for the deposit and dissemination of sci-entific research documents, whether they are pub-lished or not. The documents may come from teaching and research institutions in France or abroad, or from public or private research centers.
L’archive ouverte pluridisciplinaire HAL, est destinée au dépôt et à la diffusion de documents scientifiques de niveau recherche, publiés ou non, émanant des établissements d’enseignement et de recherche français ou étrangers, des laboratoires publics ou privés.
Stratosphere-troposphere exchange in a summertime
extratropical low: analysis
Jérôme Brioude, Jean-Pierre Cammas, O. R. Cooper
To cite this version:
Jérôme Brioude, Jean-Pierre Cammas, O. R. Cooper. Stratosphere-troposphere exchange in a sum-mertime extratropical low: analysis. Atmospheric Chemistry and Physics Discussions, European Geosciences Union, 2005, 5 (6), pp.12465-12503. �hal-00327988�
ACPD
5, 12465–12503, 2005 Stratosphere-troposphere exchange in a summertime extratropical low J. Brioude et al. Title Page Abstract Introduction Conclusions References Tables Figures J I J I Back Close Full Screen / EscPrint Version Interactive Discussion
Atmos. Chem. Phys. Discuss., 5, 12465–12503, 2005 www.atmos-chem-phys.org/acpd/5/12465/
SRef-ID: 1680-7375/acpd/2005-5-12465 European Geosciences Union
Atmospheric Chemistry and Physics Discussions
Stratosphere-troposphere exchange in a
summertime extratropical low: analysis
J. Brioude1, J.-P. Cammas1, and O. R. Cooper2
1
Laboratoire d’A ´erologie, UMR5560, Observatoire Midi-Pyr ´en ´ees, Toulouse, France
2
Cooperative Institute for Research in Environmental Sciences (CIRES), University of Colorado/NOAA Aeronomy Laboratory, Boulder, USA
Received: 16 September 2005 – Accepted: 20 October 2005 – Published: 29 November 2005 Correspondence to: J. Brioude (brij@aero.obs-mip.fr)
ACPD
5, 12465–12503, 2005 Stratosphere-troposphere exchange in a summertime extratropical low J. Brioude et al. Title Page Abstract Introduction Conclusions References Tables Figures J I J I Back Close Full Screen / EscPrint Version Interactive Discussion
Abstract
Ozone and carbone monoxide measurements sampled during two commercial flights in airstreams of a summertime midlatitude cyclone are analysed with a lagrangian-based study (backward trajectories and a Reverse Domain Filling technique) to gain a com-prehensive understanding of transport effects on trace gas distributions. The study 5
demonstrates that summertime cyclones can be associated with deep stratosphere-troposphere transport. A tropopause fold is sampled twice in its life cycle, once in the lower troposphere (O3'100 ppbv; CO'90 ppbv) in the dry airstream of the cyclone, and again in the upper troposphere (O3'200 ppbv; CO'90 ppbv) on the northern side of the large scale potential vorticity feature associated with baroclinic development. 10
In agreement to the maritime development of the cyclone, the chemical composition of the anticyclonic part outflow of the warm conveyor belt (O3'40 ppbv; CO'85 ppbv) corresponds to the lowest mixing ratios of both ozone and carbone monoxide in up-per tropospheric airborne observations. The uncertain degree of confidence of the Lagrangian-based technique applied to a 100 km segment of upper level airborne ob-15
servations with high ozone (200 ppbv) and relatively low CO (80 ppbv) observed north-west of the cyclone prevents to identify the ozone enrichment process of air parcels embedded in the cyclonic part of the upper level outflow of the warm conveyor belt. Different hypotheses of stratosphere-troposphere exchange are discussed.
1. Introduction
20
Stratosphere-to-troposphere transport processes associated with tropopause folding are known from pioneer observational studies (e.g. Danielsen, 1968) to be major con-tributors to the tropospheric ozone budget at mid-latitudes. An accurate knowledge of transport processes is of great importance in quantifying the relative roles of transport and chemistry in the budgets of trace gas as diagnosed by global chemistry-transport 25
ACPD
5, 12465–12503, 2005 Stratosphere-troposphere exchange in a summertime extratropical low J. Brioude et al. Title Page Abstract Introduction Conclusions References Tables Figures J I J I Back Close Full Screen / EscPrint Version Interactive Discussion
information to policy makers and industry. An updated survey of global tropospheric CTM O3 budgets (Intergovernmental Panel on Climate Changes, Third Assessment Report, Chapter 4, 2001) shows that the individual components vary greatly. Large dif-ferences in the stratospheric source, from 400 Tg(O3) yr−1 (Hauglustaine et al., 1998) to 1000 Tg(O3) yr−1 (Crutzen et al., 1999), were apparently the driving force behind 5
whether a model calculates a chemical source or sink of tropospheric O3. A more recent study od individual CTMs (Stevenson et al., 2005) gives tropospheric ozone budgets with an ensemble mean and standard deviation. Mean chemical production, chemical loss, surface deposition fluxes and the stratospheric source are 5060, 4560, 1010, and 520 Tg(O3) yr−1respectively, with inter-model standard deviations of 11, 16, 10
22 and 38%. Still, the stratospheric source has a large standard deviation and fur-thermore it is an inferred input term that closes the budget. The reproduction of the inter-annual variability of upper tropospheric (UT) O3 is a challenging task for CTMs, especially for the summer seasonal peak maximum that possibly accumulates O3from photochemical and stratospheric sources. Furthermore, except from a few examples, 15
like the NARE experiment (Cooper et al., 2002) which was devoted to the determination of the chemical composition of the major airstreams in extratropical lows, stratosphere-troposphere exchange observations are lacking during the summertime period. Im-provements of modeling tools should come with further knowledge of stratosphere-troposphere exchange processes as revealed by case studies. Heretofore, the general 20
term STE will refer to stratosphere-troposphere exchanges in both directions, while specific terms STT and TST will refer to stratosphere-troposphere and troposphere-stratosphere transport, respectively.
Recent progress in 4D-VAR assimilation techniques has enhanced the quality and the dynamical coherence of operational global-scales analyses, individually and in time 25
series (Rabier et al., 2000; Mahfouf and Rabier, 2000). As a consequence, the rel-evance of Lagrangian-based analyses is less hampered by problems of spatial and temporal interpolations of analysed parameters to compute advection terms. Progress in developing Lagrangian tools to diagnose STE with modeled analyses (Stohl, 2001;
ACPD
5, 12465–12503, 2005 Stratosphere-troposphere exchange in a summertime extratropical low J. Brioude et al. Title Page Abstract Introduction Conclusions References Tables Figures J I J I Back Close Full Screen / EscPrint Version Interactive Discussion
Wernli and Bourqui, 2003; James et al., 2003a, b; Sprenger et al., 2003) has demon-strated the necessity to investigate air streams crossing the tropopause with regards to the impact of stratospheric intrusions on the chemistry of the upper troposphere (UT). To have a large impact on the seasonal cycle of UT O3, cross-tropopause fluxes should be associated with irreversible exchange. According to James et al. (2003b), 90% of air 5
parcels in cross-tropopause transport may return to their initial reservoir within 6 h. A large sensitivity of such results should be expected, depending on the scales of motion described and the technique used to build modeled analyses.
The reconstruction of 2-D sections of potential vorticity (PV) using a technique will be a major tool of investigation to interpret in-situ aircraft measurements in this paper. 10
This paper presents the results of a Lagrangian-based reverse domain filling (RDF) analysis of STE among the airstreams in a midlatitude cyclone. Specifically, the cy-clone developed a split cold front, a phenomenon that evolves from the classical front when dry air aloft overruns the layer of warm, moist air ahead of the surface cold front. Examples of split cold fronts are discussed in Browning and Monk (1982), Hobbs et 15
al. (1990) and Bader et al. (1995). This combination of warm, moist air at low levels (called the shallow moist zone) and dry air aloft renders the air potentially instable. In a trajectory analysis combined with a satellite imagery of a wintertime split front, Parrish et al. (2000) show that the instability associated with a split cold front leads to convective mixing of the boundary layer air into the dry intrusion. Here, a summertime 20
split front is investigated. The synoptic setting involves the baroclinic development on 16–17 July 2002 over the Eastern Coast of the United States of a mid-latitude cyclone formed by an upper level disturbance coming from northern Canada and by a maritime tropical depression off-shore of the Eastern Coast. The dry airstream (DA) and the warm conveyor belt (WCB) of the storm were sampled by two commercial aircraft of 25
the MOZAIC program (Measurements of Ozone, Water Vapour, Nitrogen Oxides and Carbon Monoxide by Airbus In-service Aircraft, Marenco et al., 1998; Thouret et al., 1998,http://www.aero.obs-mip.fr/mozaic/). During descent to landing to New York City the first MOZAIC aircraft transected a tropopause fold in the lower troposphere. While
ACPD
5, 12465–12503, 2005 Stratosphere-troposphere exchange in a summertime extratropical low J. Brioude et al. Title Page Abstract Introduction Conclusions References Tables Figures J I J I Back Close Full Screen / EscPrint Version Interactive Discussion
above northeastern Canada and heading towards Boston, the second MOZAIC aircaft flew through the cloud head and the upper level divergent outflow portion of the system and captured air masses processed by the WCB and by the DA. Section 2 presents the case study of the summertime extratropical low and the aircraft measurements. Section3 presents the Lagrangian analysis of airborne observations and details the 5
structures of coherent airstreams in the storm. The section ends with a discussion on convective and turbulent mixing processes possibly involved in the case study. Sec-tion4concludes.
2. Presentation of the case study
2.1. Synoptic situation 10
The surface synoptic situation on 16 July 2002, 00:00 UTC (Fig.1a) involves a train of surface lows stretching across the Western Atlantic. At the southernmost position, a tropical storm (TS) Arthur contains deep convective cells with cold upper tropospheric cloud tops (Fig.2a – left). Over the northeastern USA, a cold front (noted C1) asso-ciated with shallower clouds is moving towards the eastcoast. On 17 July, 00:00 UTC 15
(Fig.1b) the TS has evolved into an extratropical low with a well-developed warm front (noted W2) and a cold front (noted C2) southeast of Newfoundland. A secondary sur-face low is leading the cold front C1 over the Western Atlantic. On 17 July, 12:00 UTC (Fig.2a – right), deep convective cells are embedded along the WCB ahead of cold front C2. East of Newfoundland, extended clouds develop over the warm front at the 20
place where conceptual models (e.g., Carlson, 1980) indicate that the divergent out-flow of the WCB rotates anticyclonically. Further northeastward over Newfoundland, other high level clouds revolve cyclonically and form a hook cloud pattern. West of the cold front C2, shallower clouds associated with the cold front C1 enter the main extratropical low.
25
ACPD
5, 12465–12503, 2005 Stratosphere-troposphere exchange in a summertime extratropical low J. Brioude et al. Title Page Abstract Introduction Conclusions References Tables Figures J I J I Back Close Full Screen / EscPrint Version Interactive Discussion
about 300–400 hPa further information on the upper level dynamics is revealed by a sequence of water vapor images (Fig. 2b–c). Two bands of dry air with brightness temperatures in excess of 240 K, noted PJ and SJ, are associated with stratospheric air along the tropopause break on the cyclonic-shear side of the upper-level polar and subtropical jet-front systems, respectively. The PJ and SJ bands delimit upper-level 5
potential vorticity disturbances, vertically tilted to the west of the secondary surface low and of the main extratropical low respectively, that likely trigger and govern their baroclinic development. South of Newfoundland on 16 July, 18:00 UTC (Fig.2b – right), the SJ band overlaps the cold surface front C2, and further extends northeastwards to the north of the warm front W2 on 17 July, 12:00 UTC (Fig.2c – right). To the south, 10
the PJ and SJ bands merge together on 17 July, 06:00 UTC and form a broad dry airstream (DA) west of the cold front C2 in good agreement with conceptual models (Carlson, 1980, Fig. 9; Bader et al., 1995, Figs. 3.1.24 and 3.1.27b; and Cooper et al., 2001, Fig. 12). Meanwhile, the northern part of the PJ band has merged with another dry feature east of Newfoundland on 16 July, 00:00 UTC (Fig.2b – left) leading 15
(Fig.2c – right) to the formation of a filament (noted UC) that cyclonicaly wraps up from south of Greenland to south of Newfoundland on 17 July, 12:00 UTC. Heretofore the latter filament will be termed the umbilical cord with regards to its connection to a large stratospheric reservoir over the eastern Atlantic.
The overlapping of the surface cold front by the upper-level front seen on GOES WV 20
channel was also captured by MODIS (Moderate Resolution Imaging Spectroradiome-ter) on board the Terra and Aqua satellites on 16 July 15:00 UTC (Fig.3). Based on the reflective and radiative properties of small liquid water drops, snow and small ice crystals in the visible and short-wave infrared parts of the spectrum, the combination of bands 3, 6 and 7 (479 nm, 1652 nm, 2155 nm) distinguishes low level clouds (liquid 25
water, white) from high level clouds (ice crystals, peach). Along the southern part of the cold front, the band of high level cirrus clouds piles up over the low level clouds. Northward, it narrows and reveals low level frontal clouds to the west. This indicates that the dry airstream (free of cirrus) overlaps the lower portions of the WCB and forms
ACPD
5, 12465–12503, 2005 Stratosphere-troposphere exchange in a summertime extratropical low J. Brioude et al. Title Page Abstract Introduction Conclusions References Tables Figures J I J I Back Close Full Screen / EscPrint Version Interactive Discussion
a shallow moist zone in the lower troposphere, like in the conceptual model of the split front described by Browning and Monk (1982). As a result, deep convective cells may be triggered in the edge of the shallow moist zone by the release of potential instability. 2.2. MOZAIC observations
Evidence of a stratospheric intrusion in this case study is shown by anticorrelations 5
between ozone and relative humidity, and between ozone and carbon monoxide, along the vertical profiles measured by a MOZAIC aircraft descending into New York City (NYC) on 16 July 2002, at about 18:00 UTC (Fig.4). A very dry and ozone-rich layer lies between 700 hPa and 600 hPa ; relative humidity decreases to a few percent, while ozone mixing ratio exceeds 100 ppbv. Carbon monoxide is only 85–90 ppbv in this 10
layer, the lowest values sampled between the surface and approximately 400 hPa. The tropopause fold observed over NYC forms the bottom part of the dry intrusion airstream, the upper part of which is depicted on water vapor images (Fig.2a–b). This case study is of particular importance because tropopause folds observed below 4 km altitude during summer are not documented and because forward trajectories initialised 15
in the fold (not shown) involve irreversible STT.
Observations by a second MOZAIC aircraft flying west over the northeast Atlantic and Canada on 17 July 2002, are shown on Fig.5(see airpath on Fig.7). The aircraft samples three stratospheric air masses with ozone mixing ratio exceeding 200 ppbv and denoted S1 (at about 46◦W and flight level 215 hPa), S2 (at about 58.5◦W when 20
ascending to the flight level 205 hPa), and S3 (at about 61.5◦W when ascending to the flight level 195 hPa). In the three stratospheric air masses carbon monoxide mixing ratios decrease below 70 ppbv. Consistent with the tracer observations, potential vor-ticity values (Fig.5c) at the end of 48-h backtrajectories initialized in S1, S2 and S3 are typical stratospheric values in excess of 2 pvu (see Sect. 3 for detailed explanations 25
on trajectory calculations). Of interest is the portion from group 2 (50◦W) to group C (56◦W) in which ozone mixing ratios steadily increase from 40 to 200 ppbv while carbon monoxide also increases from 80 to 100 ppbv. An objective of the study is to explain
ACPD
5, 12465–12503, 2005 Stratosphere-troposphere exchange in a summertime extratropical low J. Brioude et al. Title Page Abstract Introduction Conclusions References Tables Figures J I J I Back Close Full Screen / EscPrint Version Interactive Discussion
this apparent positive correlation of ozone and carbon monoxide from groups 2 to C. Is it related to photochemical production of ozone in a polluted air mass, or to the mixing of stratospheric with tropospheric ambient air? Another puzzling feature of this set of observations is the sudden decrease of ozone down to 200 ppbv in group 3 at about 59◦W while the aircraft remains at the 205 hPa level west of the S2 stratospheric-origin 5
air mass. What could be the origin of air parcels in group 3?
The wind direction measurements (Fig.5b) show southwesterly winds at longitudes 48◦W–52◦W and southeasterly winds at longitudes 54◦W–58◦W, which confirms that the aircraft has flown along the deformation axis of the wind field from the eastern outflow region to the western hook cloud (see Figs.2a–c – right). The southwesterly 10
winds carry low concentrations of ozone and CO. In the latter airstream, air masses noted 1 and 2 may have been transported along the WCB and would therefore origi-nate from the lowermost troposphere as suggested by parameters at the end of 48-h backward trajectories (Fig. 5c); namely PV values below 2 pvu and pressure levels of 950 hPa. However, the higher PV and lower pressure values along back trajecto-15
ries from airmass A, imply a partial stratospheric origin. This contradiction between measurements and trajectories shows that the accuracy of back trajectories needs to be critically examined. Southeasterly winds carry more and more O3 and CO as the easterly component strengthens. Particles embedded within airmasses B and C may belong to the dry airstream and may have stratospheric origin as suggested by large 20
PV values for B and large variability of PV values for C. One notes that trajectories from airmass 3 come from the lowermost troposphere with similar characteristics as group 1 and 2. But how could this airmass contain 200 ppbv of ozone? Again, this is where the validity of backward trajectories will be examined.
The O3-CO scatterplot (Fig.6) provides a characterization of the chemical composi-25
tion of stratospheric and tropospheric reservoirs involved in the case study. The back-ground (grey color) gathers all UTLS MOZAIC observations during July 2002 between 30◦W and 100◦W to emphasize the envelope of the chemical composition of the UTLS in the North America/North Atlantic region. Air parcels of groups 1, 2, 3 and A, B, C of
ACPD
5, 12465–12503, 2005 Stratosphere-troposphere exchange in a summertime extratropical low J. Brioude et al. Title Page Abstract Introduction Conclusions References Tables Figures J I J I Back Close Full Screen / EscPrint Version Interactive Discussion
the second MOZAIC flight and of the tropopause fold (noted TF) in the first MOZAIC flight are displayed at the coordinates of their mean O3 and CO mixing ratios. Data sampled in cross-tropopause gradients on the eastern (E) and western (W) edges of stratospheric air masses S1 to S3 (colored stars) display linear mixing lines connecting the stratospheric and tropospheric reservoirs (Hoor et al., 2002). The O3-CO scatter-5
plot does not support the hypothesis that the aircraft is sampling a single atmospheric airmass from group 2 to group C at different levels of photochemical ozone production with CO as a precursor. Indeed, the slope of O3 versus CO between groups 2 and C is too large, about 10, i.e. one order of magnitude larger than slopes observed in pollution transport events (e.g. Parrish et al., 1998). Furthermore, the airmass would 10
shear apart from atmospheric motion before an appreciable amount of ozone could result from the slow production from CO. The O3-enrichment from group 2 to C is more likely due to a sequence of air masses gradually mixing with stratospheric-origin air while the background value of CO slightly increases. Supporting evidence is derived from the position of the tropopause fold (TF) near the line joining groups B and C on 15
the scatterplot. A tropospheric reservoir contains groups B, TF, marked by a gradual influence of the stratosphere towards C, with C connected to the stratospheric reservoir by the mixing line S2E. A second tropospheric reservoir involves groups 1 and 2, con-nected to the stratosphere by the mixing lines S1W and S2W. With the position of group 3 along these lines, we suggest that group 3 is a mixture of air from the stratosphere 20
and the second tropospheric reservoir.
MOZAIC observations (Figs. 4and 5) in the outflow region of this extratropical low challenge our basic knowledge of the composition of principal airstreams associated with summer cyclogenesis and of the possible impact of stratosphere-troposphere ex-changes in this season. It will be interesting to see how results of this study agree with 25
the seasonal composition of airstreams observed by Cooper et al. (2002) in the NARE experiment.
ACPD
5, 12465–12503, 2005 Stratosphere-troposphere exchange in a summertime extratropical low J. Brioude et al. Title Page Abstract Introduction Conclusions References Tables Figures J I J I Back Close Full Screen / EscPrint Version Interactive Discussion
3. Lagrangian analysis
3.1. Reverse Domain Filling
We use a lagrangian technique to retrieve the origin of air parcels, either using back tra-jectories started along the aircraft path with the LAGRANTO model (Wernli and Davies, 1997) or using a Reverse Domain Filling (RDF) technique to reconstruct 2-D fields. 5
The RDF technique enhances the representation of mesoscale features in large scale analyses based on the coherence of four-dimensional analysed wind fields. The RDF technique was used for the first time by Sutton et al. (1994) and by Schoeberl and Newman (1995) to study the dynamics of the polar vortex and the formation of fila-ments along its edge. In this technique PV is used as a conservative tracer. Its field 10
at a time t is reconstructed with values taken at a time t – δt by a set of back trajecto-ries launched on a regular grid. The large-scale deformation accompanying the wind fields and the non-diffusive character of the advection scheme in the trajectory model (in our case Lagranto uses a conservative and positively defined fourth-order Runge-Kutta scheme) reveals fine scale structures in the reconstructed PV (RPV) field. In this 15
paper the grid resolution used is 0.05◦in latitude and longitude and 5 hPa on the verti-cal. We choose the backward integration time δt for trajectories equal to 30 h, except for Fig.13for which δt is 18 h. We found that no additional useful information on the RPV field was gained from longer time periods. Using additional retrieved parameters like the pressure of air parcels, other recent applications of the RDF technique have fo-20
cused on stratosphere-troposhere exchange (Morgenstern and Carver, 2001; Hegglin et al., 2004; D’Aulerio et al., 2005), on airstream identification (Hannan et al., 2003; Purvis et al., 2003) and on mixing processes (Methven et al., 2003).
3.2. Backward trajectories
Using 3-hourly wind fields with the best available resolution (about 0.5◦ latitude-25
ACPD
5, 12465–12503, 2005 Stratosphere-troposphere exchange in a summertime extratropical low J. Brioude et al. Title Page Abstract Introduction Conclusions References Tables Figures J I J I Back Close Full Screen / EscPrint Version Interactive Discussion
1998). Sequences of three-dimensional wind field from ECMWF analyses with a 0.5◦ latitude-longitude grid are used for the calculation of the trajectories with the La-grangian Analysis Tool (LAGRANTO) (Wernli and Davies, 1997). Intermediate fields, valid at 03:00 UTC and 09:00 UTC (issued from forecasts started on the analysis at 00:00 UTC) and at 15:00 UTC and 21:00 UTC (issued from forecasts started on the 5
analysis at 12:00 UTC) are added between the 6 hourly analyses at 00:00, 06:00, 12:00, and 18:00 UTC. Archived ECMWF fields are used to characterize the physical properties of air parcels along the trajectory paths. A set of 5-day back trajectories initialized along the flight track at 1-km intervals (approximately corresponding to the spatial resolution of the MOZAIC data) was calculated. To initialize backward trajec-10
tories at the exact location and time along the aircraft path, the wind fields were in-terpolated linearly in space and time using the two nearest ECMWF fields, namely 17 July, 12:00 UTC and 15:00 UTC for the MOZAIC measurements of Fig.5. This method assumes that the advection speed of features varies linearly in time. The degree of accuracy of the wind fields in either time (a few minutes) or in space (a few tenths of a 15
degree in latitude or longitude) may impact the interpretation. Back trajectories of air parcels for the groups defined in Fig.5 are displayed on Fig.7. Table 1sums up the associated origins and our degree of confidence.
Most air parcels in groups 1 and 2 come from the lowermost troposphere at about 950 hPa over the eastern Atlantic. These air parcels travel along the WCB ahead of 20
the cold front of the maritime cyclone, then rapidly rise into the upper level troposphere south of Newfoundland (between 15:00 UTC and 18:00 UTC on 16 July), and finally diverge in the outflow region aloft. Groups 1 and 2 follow the anticyclonic upper level flow to join the eastern part of the aircraft path. Group 3 has a similar origin in the lowermost troposphere, but it follows the cyclonic upper level flow to join the western 25
part of the aircraft path. However, the lack of evidence of stratospheric influence in the origin of group 3, which would be suitable to high ozone measurements, weakens the degree of confidence in backward trajectories of this group.
ACPD
5, 12465–12503, 2005 Stratosphere-troposphere exchange in a summertime extratropical low J. Brioude et al. Title Page Abstract Introduction Conclusions References Tables Figures J I J I Back Close Full Screen / EscPrint Version Interactive Discussion
located between groups 1 and 2. All three groups have very similar ozone and CO mixing ratios but the backward trajectories show group A has a source region along the subtropical jet (see Sect.2.1and Fig.2b) with PV values reaching as high as 2 pvu (Fig. 5) which indicates some stratospheric influence. Yet the ozone values are no higher than in Groups 1 and 2.
5
Air parcels of group C travel around an upper level high over Hudson Bay in the low-ermost stratosphere (above 250 hPa, PV values in excess of 4 pvu, not shown). Then, they enter the flow associated with the upper level disturbance seen on water-vapour channel images (Fig.2) and take a cyclonic curved trajectory from NYC to Newfound-land. The air parcels subside below 300 hPa during transport from the high to the 10
trough and then converge as they are pulled into the upper level frontogenesis on the western part of upper level disturbances. On the eastern side of the trough, air parcels ascend and diverge before reaching the aircraft path at 215 hPa. Their association with tropopause folding will be discussed in the following section. Notably, the RDF tech-nique will be used to reconstruct the PV field in the vertical cross-section displayed 15
northeast of the Great Lakes when air parcels of group C have the strongest descent rate. The reconstructed PV field will be interpretated with regards to the observation of the tropopause fold over NYC (Fig.4). Air parcels of group B have similar dynamics to group C, but with a stronger stratospheric origin that does not match the moderate ozone mixing ratio observed in group B (about 100 ppbv) if compared to group C (about 20
200 ppbv). A strong sensitivity for the initialisation of air parcels trajectories has been found for group B. An example is shown on Fig. 7-B and -B+0.15◦ which compares backward trajectories of group B and of group B shifted northward of 0.15◦ latitude, respectively. Such an error of position is small compared to the grid resolution (0.5◦) of the analyses and much smaller than the distance representative of observations used 25
to transform the guess field into the analysis field. Yet, B+0.15◦ backward trajectories no longer share the same dynamics, they originate from the upper troposphere with lower PV values (not shown) in the region south of Hudson Bay. As confirmed in the following section, the history of B+0.15◦ air parcels is more consistent than the B air
ACPD
5, 12465–12503, 2005 Stratosphere-troposphere exchange in a summertime extratropical low J. Brioude et al. Title Page Abstract Introduction Conclusions References Tables Figures J I J I Back Close Full Screen / EscPrint Version Interactive Discussion
parcels with regards to their moderate ozone mixing ratio. 3.3. Reconstruted potential vorticity structures
The RDF technique is first applied to the tropopause fold observed over NYC at about 650 hPa (Fig.4). PV and RPV fields are displayed at 650 hPa and in a vertical cross-section across the tropopause fold (Fig.8). The 650-hPa PV field (Fig.8a) does not 5
show any feature of interest in the vicinity of the aircraft path. In contrast, the 650-hPa RPV field (Fig.8b) shows a fine-scale filament of high PV values (in excess of 2 pvu) close to the aircraft path near NYC, and corresponding to the lower part of the tropopause fold. The vertical cross section of PV (Fig.8c) outlines a typical structure of a tropopause fold above 400 hPa. However, the fold does not extend down to the 10
level of the descending aircraft path. In contrast, the RPV field (Fig.8d) extends the stratospheric intrusion roughly along isentropic surfaces down to the aircraft path at 650 hPa. The RDF technique is therefore able to trace back the stratospheric origin of ozone-rich air parcels observed by the MOZAIC aircraft in the lower troposphere. The circumstances of the case study are interesting because forward trajectories of 15
air parcels initialized in the fold do not return to the stratosphere (not shown), i.e. the transport from stratosphere to troposphere in this case is irreversible.
With regards to the observations by the second MOZAIC aircraft, Fig.9a shows the PV field interpolated to the flight level pressure (215 hPa) and to the beginning of the MOZAIC measurements (14:00 UTC). The upper-level disturbance associated with the 20
cyclogenesis is clearly visible over Nova Scotia and Newfoundland. This disturbance is linked to the stratospheric reservoir further east by the umbilical cord (Hoskins et al., 1985). The convex shape of the umbilical cord follows the leading edge of the divergent outflow (see Fig.2a – right) associated with strong latent heat release above the warm front. Stratospheric ozone maxima S1 and S3 (Fig.5) correspond to the crossings of 25
the umbilical cord over the Atlantic and Canada, respectively. Between S1 and S3, the aircraft follows the northern edge of the upper level disturbance and samples the second stratospheric ozone maximum S2 during the ascent from 215 hPa to 205 hPa.
ACPD
5, 12465–12503, 2005 Stratosphere-troposphere exchange in a summertime extratropical low J. Brioude et al. Title Page Abstract Introduction Conclusions References Tables Figures J I J I Back Close Full Screen / EscPrint Version Interactive Discussion
Figure 9a suggests that the relative ozone minimum observed in group 3 is associ-ated with the western tip of the band of relatively low PV values (≤2.5 pvu) locassoci-ated between the umbilical cord and the upper level disturbance. The RPV field (Fig. 9b) displays comparable large-scale structures, but two fine-scale features of interest have emerged. First, the band of air situated between the umbilical cord and the upper level 5
disturbance has a clear tropospheric origin with low PV values (≤0.5 pvu) and extends further south towards Nova Scotia. This result is comparable to the conclusion drawn from individual backward trajectories associated with group 3 that we granted a weak degree of confidence. However, the GOES water vapor image on 17 July, 12:00 UTC (Fig.2c) indicates that this air-band is relatively moist, which still allows a tropospheric 10
contribution for group 3 to exist. The second small-scale structure of interest is the con-siderably modified northern part of the upper level disturbance along the aircraft path. A fine scale filament of high PV appears just south of the aircraft path and is separated from the main body of the upper level disturbance. With the RDF technique, the steady increase of ozone from group B to C (Fig.5) is attributed to the proximity of the aircraft 15
path to a fine scale RPV filament rather than its proximity to the northern gradient of PV of the main upper level disturbance as indicated by the ECMWF analysis. S2 coincides with the ascent of the aircraft into the western tip of the fine-scale RPV filament. Below we show that the fine scale filament of RPV belongs to the tropopause fold captured at an earlier point in its life cycle by the first MOZAIC aircraft over NYC.
20
The structure of PV and RPV fields in a vertical cross-section phased in time with the aircraft motion is now examined. Figure10a shows that aircraft path is very close to the dynamical tropopause (2–3 pvu) and that the tropopause is locally depressed along the umbilical cord in S1 and S3. The RPV structure (Fig.10b) differs considerably with regards to mesocale features. The tropopause is far above the aircraft in the middle 25
part of the cross section. The umbilical cord in S1 and S3 has a rich structure with folds hanging down to 350 hPa. An upper tropospheric RPV anomaly appears below the elevated tropopause, with the aircraft crossing it in region B and flying above it in region C. The sandwich of air masses coming from the subtropical jet (group A) and
ACPD
5, 12465–12503, 2005 Stratosphere-troposphere exchange in a summertime extratropical low J. Brioude et al. Title Page Abstract Introduction Conclusions References Tables Figures J I J I Back Close Full Screen / EscPrint Version Interactive Discussion
from the lowermost troposphere (groups 1 and 2) is reconstructed as well. The verti-cal RPV structure in the vicinity of groups 3 and S3 mirrors the one described in the regions of groups 1 and S1. This symmetry adds credit to the scenario of the common formation of these mesoscale structures by deformation in the outflow region. Like for Fig.5there is an inconsistency between the moderate ozone mixing ratio sampled 5
in group B (about 100 ppbv) and the high PV values retrieved with back trajectories. As previously detailed (see Sect.3.2), the strongest sensitivity to interpolation uncer-tainties using back trajectories has been found for air parcels in group B. A modified vertical RPV structure taking into account this sensitivity for group B is calculated by starting back trajectories on the two-dimensional longitudinal band taken by group B 10
on new gridpoints shifted 0.15◦ further north, as was done for back trajectories along the aircraft path (see Fig. 7). As expected, this results (Fig.10c) in the suppression of the RPV anomaly visible in Fig.10b in region B near the flight level. The new RPV structure now extends all along the segment from group B to S2 just below the air-craft. Therefore, the major difference of interpretation brought by the RDF technique 15
comparing Figs.10a and c is that the steady increase of ozone mixing ratio in regions B and C should be associated with the decreasing distance between the aircraft path and the RPV structure below, rather than the vertical vicinity of the lower stratosphere above.
A proof that the RPV structure just below the aircraft in regions B and C is associated 20
with the tropopause fold is now given by looking at the history of air parcels of group C. The structure of the RPV is examined in a vertical cross section at a date when the tropopause folding occurred and at a location where air parcels of group C are present. As discussed with Fig.7, air parcels of group C experience confluence and subsidence before entering the circulation associated with the polar upper level disturbance. The 25
location of the vertical cross section is chosen along the vertical line drawn on Fig.7
(see plot for group C) at the beginning of this time period of upper level frontogenesis, on 16 July, 03:00 UTC, i.e. 36 h before interception by the aircraft. Rather than be-ing exactly parallel to the track of air parcels of group C, the orientation of the vertical
ACPD
5, 12465–12503, 2005 Stratosphere-troposphere exchange in a summertime extratropical low J. Brioude et al. Title Page Abstract Introduction Conclusions References Tables Figures J I J I Back Close Full Screen / EscPrint Version Interactive Discussion
cross section is chosen to be transverse to the synoptic flow to be consistent with clas-sical two-dimensional views of tropopause folds. We proceed with a two step process: (i) back trajectories starting from the aircraft path are used to choose the location of the vertical cross section upstream of the upper level trough, (ii) the RDF technique is applied with back trajectories starting from the chosen vertical cross section. This 5
procedure gives a much clearer picture of the stratospheric origin of group C than other methods that apply the RDF technique with back trajectories starting from the aircraft path or downstream of the upper level trough (not shown). The reason is that the relia-bility of the RDF technique deteriorates where PV conservation is uncertain, especially downstream of the upper level trough where cloud diabatic processes accompanying 10
the front are significant. Application of the RDF technique in this vertical cross sec-tion involves 30-h back trajectories which puts the retrieval date of the RPV at 14 July, 21:00 UTC, i.e. 66 h before sampling by the aircraft. With the vertical PV structure interpolated with ECMWF fields (Fig. 11a), the overall structure of a tropopause fold where air parcels of group C are embedded is distinguishable. The RPV field (Fig.11b) 15
identifies the tropopause fold much better and indicates that it could be much thinner than displayed by the ECMWF field. Most air parcels of group C are embedded in the fold, the other being in the vicinity of the fold or in the dry airstream.
3.4. Discussion
MOZAIC measurements over NYC and at cruise level over Canada (Figs. 4 and 5) 20
show that the tropopause fold (groups TF and C) contains large mixing ratio of ozone (160–200 ppbv) and relatively large CO mixing ratio (90–110 ppbv) in comparison with lowermost tropospheric origin air masses (groups 1 and 2) with low ozone mixing ratios (40–50 ppbv) and relatively low CO mixing ratios (80–90 ppbv). The RDF technique has individually identified all these airmasses in the deformation field of the outflow region. 25
It implies that the part of the tropopause fold that has been observed (air parcels of group C) has not yet been strongly mixed with lowermost troposphere-origin air. As a consequence, the CO enrichment of the air within the tropopause fold could have
oc-ACPD
5, 12465–12503, 2005 Stratosphere-troposphere exchange in a summertime extratropical low J. Brioude et al. Title Page Abstract Introduction Conclusions References Tables Figures J I J I Back Close Full Screen / EscPrint Version Interactive Discussion
curred over North America where the upper tropospheric CO background is enhanced by surface emissions. Turbulent-scale mixing (Shapiro, 1980) in the vicinity of the fold is a possible mechanism for the CO enrichment. The large fine-scale variability of ozone mixing ratio observed in group C supports the latter hypothesis. This case study challenges meso-scale chemistry models with state-of-the-art parameterization 5
of turbulence to reproduce the mixing of the tropopause fold with ambient upper level tropospheric air.
The remaining unresolved question of the origin of the large ozone mixing ratios in air parcels of group 3 compared to groups 1 and 2 is now examined, with regards to influence from the split frontal band and from upper level turbulence. To estimate the 10
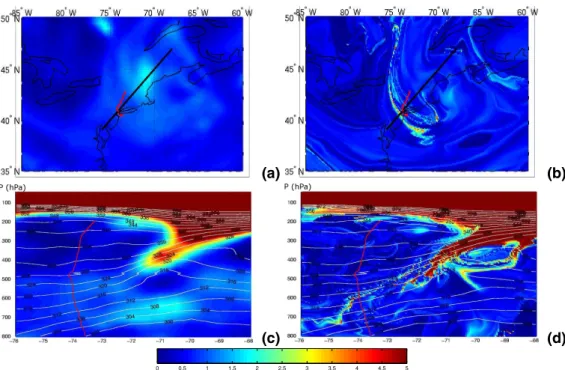
importance of mixing processes that the fold may experience in the region downstream of the upper level trough, the RDF technique is applied in a vertical cross section (Fig.12) where the dry intrusion comes close to the WCB (see Fig.7for location of the vertical cross section). The vertical cross section is not a single plane but is composed of two vertical sections in order to capture groups 1, 2, 3, A, B, and C. The structure of 15
the fold is represented by the RPV filament where group C lies at about 300 hPa. The broken aspect of the fold, compared to its continuous structure on the western side of the upper level trough (Fig. 11), may be due either to failures of the RDF technique to retrieve the stratospheric origin of air parcels in some places, or to strong explicit ascending vertical velocities along the WCB implying the disruption and mixing of the 20
fold. The fold overruns the ascending moist airstream of the WCB made visible by the envelope of air parcels with reconstructed pressures larger than 800 hPa (white area). The envelope of air processed in the WCB explicitly takes into account the transport by resolved ascending motions from ECMWF fields, but misses transport by sub-grid convective and turbulent vertical motions owing to the lack of corresponding 25
parameterisation schemes in the LAGRANTO tool. These processes may have a large importance with regards to mixing in this shallow moist zone where the air is potentially unstable.
ACPD
5, 12465–12503, 2005 Stratosphere-troposphere exchange in a summertime extratropical low J. Brioude et al. Title Page Abstract Introduction Conclusions References Tables Figures J I J I Back Close Full Screen / EscPrint Version Interactive Discussion
and Monk (1982) is further investigated. The northern part of the vertical cross section (Fig.12) captures air parcels of groups 1, 2 and 3. All these air parcels have been processed by the WCB (even if they are not all inside the white area in that particu-lar cross-section). Groups 1 and 3 are very close to each other at this time, though a noticeable difference is that group 3 is closer to the junction of the tropopause fold 5
to the lowermost stratosphere. With regards to the O3 enrichment of group 3, a first hypothesis is that it occurred before the time at which the cross section is valid. There-fore, group 3 would have been subject to mixing with the tropopause fold by turbulence and convection along the WCB in the shallow moist zone. A second hypothesis is that the enrichment occurred after this time, when group 3 followed the cyclonic branch 10
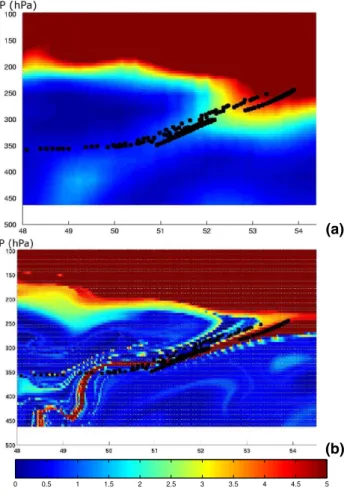
of the upper level outflow. In that case turbulent mixing between group 3 and either the tropopause fold or the tropopause disturbances S2 and S3 would explain the O3 enrichment. In support of the latter hypothesis is the structure of the RPV field in a vertical cross section transverse to the aircraft path (Fig.13, see location on Fig. 9). Differences between the PV and RPV structures are interpretated as signatures of 15
mesoscale three-dimensional movements of deformation near the tropopause. Here, we use a shorter time integration (18 h) to select deformation fields associated with vertical ascent and diverging winds in the upper level outflow. The PV structure offers a smoothed view of the tropopause for which some of the lowermost troposphere-origin air parcels, (group 3), are in the lowermost stratosphere. With the RPV structure, the 20
tropopause fits the arc-shaped print of lowermost troposphere-origin air parcels strik-ing the southern side of the umbilical cord S3. Here, group 3 is in a tropospheric-origin air mass below the tropopause and above the S2 disturbance, reinforcing the hypoth-esis of ozone enrichment by turbulent mixing processes nearby stratospheric features. Owing to the fine scale structure of the tropospheric-origin filament in which group 3 is 25
embedded and its deep intrusion into the upper level precursor (Fig.9), group 3 would serve as an example of irreversible TST. At this point, limitations of the trajectory anal-ysis prevent further speculation on the two hypotheses. A third hypothesis would also be that group 3 is an aged lower stratospheric air mass that had CO mixed in several
ACPD
5, 12465–12503, 2005 Stratosphere-troposphere exchange in a summertime extratropical low J. Brioude et al. Title Page Abstract Introduction Conclusions References Tables Figures J I J I Back Close Full Screen / EscPrint Version Interactive Discussion
days or weeks earlier and that the trajectories are probably in error.
4. Conclusions
Ozone and carbon monoxide measurements sampled during two commercial flights in airstreams of a summertime mid-latitude cyclone developing over the northeastern At-lantic have been investigated. The cyclone presented strong potential for stratosphere-5
troposphere exchange and the development of a split cold front like in the conceptual model of Browning and Monk (1982). A Lagrangian-based study based on backward trajectories, and a Reverse Domain Filling technique, has been conducted to gain a comprehensive understanding of transport effects on trace gas distributions. This tech-nique is successfully applied to identify the stratospheric-origin of relatively high O3 10
measurements associated with a tropopause fold. The fold is sampled twice in its life cycle. It is sampled once in the lower troposphere upstream of the upper level trough when embedded within upper level frontogenetic processes in the dry airstream of the cyclone. It is sampled again in the upper troposphere, downstream of the upper level trough on the northern side of the large scale potential vorticity feature associated 15
with baroclinic development. Besides the irreversible character of the stratosphere-troposphere transport associated with the fold, of interest is its chemical composition. Much larger ozone mixing ratios in the tropopause fold were found compared to late summer seasonal values in dry airstreams for the NARE experiment (Cooper et al., 2002), i.e. 100 ppbv versus 56 ppbv for NARE at mid-tropospheric levels, and 200 ppbv 20
versus 76 ppbv for NARE in the upper troposphere. CO mixing ratios observed in the fold range from 90 to 100 ppbv, similar to CO seasonal values of dry airstreams given by Cooper et al. (2002). In the larger context of other air masses sampled in the case study, CO mixing ratio in the fold are (i) equivalent to the background CO of the con-tinental mid-troposphere (90–110 ppbv), (ii) larger than typical CO mixing ratio of low-25
ermost troposphere-origin air in the WCB over the Atlantic (80–90 ppbv) and (iii) larger than typical CO mixing ratio in the lowermost stratosphere (≤80 ppbv). Turbulent-scale
ACPD
5, 12465–12503, 2005 Stratosphere-troposphere exchange in a summertime extratropical low J. Brioude et al. Title Page Abstract Introduction Conclusions References Tables Figures J I J I Back Close Full Screen / EscPrint Version Interactive Discussion
mixing (Shapiro, 1980) in the vicinity of the fold is suggested as a possible mechanism for the CO enrichment of the stratospheric-origin air of the fold up to the continental background value when crossing northeastern America.
The Lagrangian-based technique is also applied to analyse observations of the chemical composition of the outflow of the WCB. Despite the lack of a parameterisation 5
for sub-grid scale processes (convection, turbulence, ...) a good degree of confidence is given to trajectories that follow the anticyclonic part of the upper level outflow of the WCB. In agreement with the maritime development of the cyclone, this airstream corresponds to the lowest mixing ratios of both ozone (40 ppbv) and carbon monoxide (85 ppbv) in upper tropospheric airborne observations.
10
The Lagrangian-based technique fails to retrieve the origin of a 100-km segment of upper level airborne observations with high ozone (200 ppbv) and relatively low CO (80 ppbv) observed northwest of the cyclone. The airstream described by back trajec-tories initialised along this segment would be the cyclonic part of the upper level outflow of the WCB. Yet, the ozone enrichment process of such air parcels embedded in the 15
WCB was not identified. Speculation leads to the hypothesis of ozone enrichment by mixing processes, either associated with potential instability release where the upper level front runs ahead of the cold surface front (i.e. split frontal bands), or associated with turbulent mixing near the tropopause. It could also be that the air mass in question is an aged lower stratospheric air mass that had CO mixed in several days or weeks 20
earlier and that the trajectories are probably in error.
This case study is of particular interest because it shows that summertime cyclones can be associated with deep stratosphere-troposphere transport. Though less frequent than wintertime cyclones, for which the potential for stratosphere-troposphere transport has long been demonstrated, summertime cyclones may contribute significantly to the 25
upper tropospheric ozone budget and confuse the assessment of the chemical pro-duction in that season. Furthermore, the case study raises some interest to investigate the potential for STE associated with split frontal bands. Limitations reached with the Lagrangian-based technique used here may be removed with mesoscale modeling.
ACPD
5, 12465–12503, 2005 Stratosphere-troposphere exchange in a summertime extratropical low J. Brioude et al. Title Page Abstract Introduction Conclusions References Tables Figures J I J I Back Close Full Screen / EscPrint Version Interactive Discussion
Acknowledgements. We thank H. Wernli for providing the source code of LAGRANTO and for
helpful comments of an earlier version of the paper. We thank the support of Programme Na-tional de Chimie atmosph ´erique and Programme Atmosph `ere et Oc ´ean `a Moyenne Echelle. The authors acknowledge for their strong support the European Communities, EADS, Airbus and the airlines (Lufthansa, Austrian, Air France) who carry free of charge the MOZAIC
equip-5
ment and perform the maintenance since 1994.
References
D’Aulerio, P., Fierli, F., Congeduti, F., and Redaelli, G.: Analysis of water vapor LIDAR mea-surements during the MAP campaign: evidence of sub-structures of stratospheric intrusions, Atmos. Chem. Phys., 5, 1301–1310, 2005,
10
SRef-ID: 1680-7324/acp/2005-5-1301.
Bader, M. J., Forbes, G. S., Grant, J. R., Lilley, R. B. E., and Waters, A. J.: Images in weather forecasting, A practical guide for interpreting satellite and radar imagery, Cambridge Univer-sity Press, 1995.
Browning, K. A. and Monk, G. A.: A simple model for the synoptic analysis of cold fronts, Quart.
15
J. Roy. Meteor. Soc., 108, 435–452, 1982.
Carlson, T. N.: Airflow through mid-latitude cyclones and the comma cloud pattern, Mon. Wea. Rev., 108, 1498–1509, 1980.
Cooper, O. R., Moody, J. L., Parrish, D. D., Trainer, M., Holloway, J. S., Ryerson, T. B., H ¨ubler, G., Fehsenfeld, F. C., Oltmans, S. J., and Evans, M. J.: Trace gas signatures of the airstreams
20
within North Atlantic cyclones: Case studies from the NARE’97 aircraft intensive experiment, J. Geophys. Res., 106, 5437–5456, 2001.
Cooper, O. R., Moody, J. L., Parrish, D. D., Trainer, M., Holloway, J. S., H ¨ubler, G., Fehsen-feld, F. C., and Stohl, A.: Trace gas composition of midlatitudecyclones over the western
North Atlantic Ocean: A seasonal comparison of O3 and CO, J. Geophys. Res., 107(D7),
25
doi:10.1029/2001JD000902, 2002.
Crutzen, P., Lawrence, M., and P ¨oschl, U.: On the background photochemistry of tropospheric ozone, Tellus, 51, 123–146, 1999.
Danielsen, E. F.: Stratospheric-Tropospheric exchange based on radioactivity, ozone and po-tential vorticity, J. Atmos. Sci., 25, 502–518, 1968
ACPD
5, 12465–12503, 2005 Stratosphere-troposphere exchange in a summertime extratropical low J. Brioude et al. Title Page Abstract Introduction Conclusions References Tables Figures J I J I Back Close Full Screen / EscPrint Version Interactive Discussion Hannan, J. R., Fuelberg, H. E., Crawford, J. H., Sachse, G. W., and Blake, D. R.:
Role of wave cyclones in transporting boundary layer air to the free troposphere dur-ing the sprdur-ing 2001 NASA/TRACE-P experiment, J. Geophys. Res., 108(D20), 8785, doi:10.1029/2002JD003105, 2003.
Hauglustaine, D. A., Brasseur, G. P., Waters, S., Rasch, P. J., Muller, J.-F., Emons, L. K., and
5
Carroll, M. A.: MOZART, A global chemical transport model for ozone and related chemical tracers. Part 2: Model results and evaluation, J. Geophys. Res., 103, 28 291–28 335, 1998. Hegglin, M. I., Brunner, D., Wernli, H., Schwierz, C., Martius, O., Hoor, P., Fischer, H.,
Par-chatka, U., Spelten, N., Schiller, C., Krebsbach M., Weers, U., Staehelin, J., and Peter, Th.: Tracing troposphere-to-Stratosphere transport above a mid-latitude deep convective system,
10
Atmos. Chem. Phys., 4, 741–756, 2004,
SRef-ID: 1680-7324/acp/2004-4-741.
Hobbs, P. V., Locatelli, J. D., and Martin, J. E.: Cold fronts aloft and the forecasting of precipi-tation and severe weather east of the Rocky Mountains, Wea. and Forecasting, 5, 613–626, 1990.
15
Hoor, P., Fisher, H., Lange, L., Lelieveld, J., and Brunner, D.: Seasonal variation of a
mix-ing layer in the lowermost stratosphere as identified by the O3-CO correlation from in-situ
measurements, J. Geophys. Res., 107, 4044, doi:10.1029/2000JD000289, 2002.
Hoskins, B. J., McIntyre, M. E., and Robertson, A. W.: On the use and significance of isentropic potential vorticity maps, Quart. J. Roy. Meteor. Soc., 111, 877–946, 1985.
20
James, P., Stohl, A., Forster, C., Eckhardt, S., Seibert, P., and Frank, A.: A 15-year climatology of stratosphere-troposphere echange with a Lagrangian particle dispersion model, Part 1: Methodology and validation, J. Geophys. Res., 108(D12), 8519, doi:10.1029/2002JD002637, 2003a.
James, P., Stohl, A., Forster, C., Eckhardt, S., Seibert, P., and Frank, A.: A 15-year
25
climatology of stratosphere-troposphere echange with a Lagrangian particle dispersion model, Part 2: Mean climate and seasonal variability, J. Geophys. Res., 108(D12), 8522, doi:10.1029/2002JD002639, 2003b.
Mahfouf, J.-F. and Rabier, F.: The ECMWF operational implementation of four dimensional variational assimilation. Part II: Experimental results with improved physics, Quart. J. Roy.
30
Meteor. Soc., 126, 1171–1190, 2000.
Marenco, A., Thouret, V., N ´ed ´elec, P., Smit, H., Helten, M., Kley, D., Karcher, F., Simon, P., Law, K., Pyle, J., Poschmann, G., Von Wrede, R., Hume, C., and Cook, T.: Measurement of ozone
ACPD
5, 12465–12503, 2005 Stratosphere-troposphere exchange in a summertime extratropical low J. Brioude et al. Title Page Abstract Introduction Conclusions References Tables Figures J I J I Back Close Full Screen / EscPrint Version Interactive Discussion and water vapor by Airbus in-service aircraft: The MOZAIC airborne program, An overview,
J. Geophys. Res., 103, 25 631–25 642, 1998.
Methven, J., Arnold, S. R., O Connor, F. M., Barjat, H., Dewey, K., Kent, J., and Brough, N.: Estimating photochemically produced ozone throughout a domain using flight data and a Lagrangian model, J. Geophys. Res., 108(D9), 4271, doi:10.1029/2002JD002955, 2003.
5
Morgenstern, O. and Carver, G. D.: Comparison of cross-tropopause transport and ozone in the upper troposphere and lower stratosphere region, J. Geophys. Res., 106, 10 205–10 221, 2001.
Parrish, D. D., Trainer, M., Holloway, J. S., Yee, J. E., Warshawsky, M. S., Fehsenfeld, F. C., Forbes, G. L., and Moody, J. L.: Relationships between ozone and carbone monoxide at
10
surface sites in the North Atlantic region, J. Geophys. Res., 103, 13 357–13 376, 1998. Parrish, D. D., Holloway, J. S., Jakoubek, R., Trainer, M., Ryerson, T. B., H ¨ubler, G.,
Fehsen-feld, F. C., Moody, J. L., and Cooper, O. R.: Mixing of anthropogenic pollution with strato-spheric ozone: A case study from the North Atlantic wintertime troposphere, J. Geophys. Res., 105(D19), 24 363–24 374, 2000.
15
Purvis, R. M., Lewis, A. C., Carney, R. A., et al.: Rapid uplift of nonmethane
hy-drocarbons in a cold front over central Europe, J. Geophys. Res., 108(D7), 4224, doi:10.1029/2002JD002521, 2003.
Rabier, F., Jarvinen, H., Klinker, E., Mahfouf, J.-F., and Simmons, A.: The ECMWF operational implementation of four-dimensional variational assimilation. Part I: Experimental results with
20
simplified physics, Quart. J. Roy. Meteor. Soc., 126, 1143–1170, 2000.
Schoelberl, M. R. and Newman, P. A.: A multiple-level trajectory analysis of vortex filaments, J. Geophys. Res., 100, 25 801–25 815, 1995.
Shapiro, M. A.: Turbulent mixing within tropopause folds as a mechanism for the exchange of chemical constituents between the stratosphere and troposphere, J. Atmos. Sci., 37, 994–
25
1004, 1980.
Sprenger, M., Croci Maspoli, M., and Wernli, H.: Tropopause folds and cross-tropopause trans-port: A global investigation based upon ECMWF analyses for the time period March 2000 to February 2001, J. Geophys. Res., 108(D12), 8518, doi:10.1029/2002JD002587, 2003. Stevenson, D. S., Dentener, F. J., Schultz, M. G., et al.: Multi-model ensemble simulations of
30
present-day and near-future tropospheric ozone, J. Geophys. Res., accepted, 2005.
Stohl, A.: Computation, accuracy and application of trajectories-a review and bibliography, Atmos. Environ., 32, 947–966, 1998.
ACPD
5, 12465–12503, 2005 Stratosphere-troposphere exchange in a summertime extratropical low J. Brioude et al. Title Page Abstract Introduction Conclusions References Tables Figures J I J I Back Close Full Screen / EscPrint Version Interactive Discussion Stohl, A.: A 1-year Lagrangian climatology of airstreams in the Northern Hemisphere
tropo-sphere and lowermost stratotropo-sphere, J. Geophys. Res., 106, 7263–7279, 2001.
Stohl, A., Bonasoni, P., Cristofanelli, P., Collins, W., Feichter, J., Frank, A., Forster, C., Gera-sopoulos, E., Gaggeler, H., James, P., Kentarchos, T., Kreipl, S., Kromp-Kolb, H., Kruger, B., sopoulos, Land, C., Meloen, J., Papayannis, A., Priller, A., Seibert, P., Sprenger, M., Roelofs,
5
G. J., Scheel, E., Schnabel, C., Siegmund, P., Tobler, L., Trickl, T., Wernli, H., Wirth, V., Zanis, P., and Zerefos, C.: Stratosphere-troposphere exchange a review, and what we have learned from STACCATO, J. Geophys. Res., 108(D12), 8516, doi:10.1029/2002JD002490, 2003. Sutton, R. T., Maclean, H., Swinbank, R., O’Neill, A., and Taylor, F. W.: High resolution
strato-spheric tracer fields estimated from satellite observations using Lagrangian trajectory
calcu-10
lations, J. Atmos. Sci., 51, 2995–3005, 1994.
Thouret, V., Marenco, A., Logan, J., N ´ed ´elec, P., and Grouhel, C.: Comparisons of ozone measurements from the MOZAIC airborne program and the ozone sounding network at eight locations, J. Geophys. Res., 103, 25 695–25 720, 1998.
Wernli, H. and Davies, H. C.: A Lagrangian-based analysis of extratropical cyclones. I: The
15
method and some applications, Quart. J. Roy. Meteor. Soc., 123, 467–489, 1997.
Wernli, H. and Bourqui, M.: A Lagrangian 1-year climatolgy of (deep) cross-tropause ex-change in the extratropical Northern Hemisphere, J. Geophys. Res., 107(D2), 4021, doi:10.1029/2001JD000812, 2002.
ACPD
5, 12465–12503, 2005 Stratosphere-troposphere exchange in a summertime extratropical low J. Brioude et al. Title Page Abstract Introduction Conclusions References Tables Figures J I J I Back Close Full Screen / EscPrint Version Interactive Discussion Table 1. Sum up of the origin of each group defined in Fig.5.
Air Mass Origin Degree of confidence
1, 2 Lowermost Troposphere Good
A Subtropical Jet Uncertain
TF, C Tropopause Fold Good
B Lower Stratosphere Uncertain
S1, S3 Stratospheric Umbilical Cord Good
S2 Stratospheric Upper Level Precursor Good
ACPD
5, 12465–12503, 2005 Stratosphere-troposphere exchange in a summertime extratropical low J. Brioude et al. Title Page Abstract Introduction Conclusions References Tables Figures J I J I Back Close Full Screen / EscPrint Version Interactive Discussion (a)
(b)
Fig. 1. Surface synoptic analysis (NCEP) on: (a) 16 July 2002, 00:00 UTC; (b) 17 July 2002,
00:00 UTC. TS is for the Tropical Storm Arthur evolving to an extratropical low with cold front C2 and warm front W2. C1 is for the continental cold front that moves over Atlantic.
ACPD
5, 12465–12503, 2005 Stratosphere-troposphere exchange in a summertime extratropical low J. Brioude et al. Title Page Abstract Introduction Conclusions References Tables Figures J I J I Back Close Full Screen / EscPrint Version Interactive Discussion (a)
(b)
(c)
Fig. 2. GOES-East satellite radiance temperatures (K): (a) Infrared channel on 16 July 2002,
00:00 UTC (left) and 17 July, 12:00 UTC (right);(b) Water vapour channel on 16 July, 00:00 UTC
ACPD
5, 12465–12503, 2005 Stratosphere-troposphere exchange in a summertime extratropical low J. Brioude et al. Title Page Abstract Introduction Conclusions References Tables Figures J I J I Back Close Full Screen / EscPrint Version Interactive Discussion Fig. 3. MODIS satellite image with a combination of the bands 3, 6 and 7 on 16 July 14:50 UTC
(image courtesy of MODIS Rapid Response Project at NASA/GSFC, http://modis.gsfc.nasa.
gov/) It shows liquid water clouds (white) and ice clouds (peach). Near the developping
de-pression along the cold front the white area indicates that dry air of the upper level front is over running a shallow moist zone, like in the conceptual model of the split front (Browning and Monk, 1982).
ACPD
5, 12465–12503, 2005 Stratosphere-troposphere exchange in a summertime extratropical low J. Brioude et al. Title Page Abstract Introduction Conclusions References Tables Figures J I J I Back Close Full Screen / EscPrint Version Interactive Discussion 0 20 40 60 80 100 120 1000 900 800 700 600 500 400 300 200 Ozone (ppbv) Pressure (hPa) 60 80 100 120 140 160 180 1000 900 800 700 600 500 400 300 200 CO (ppbv) Pressure (hPa) CO RH O3
Fig. 4. MOZAIC vertical profile of ozone (blue line, ppbv), carbone monoxide (red line, ppbv)
and relative humidity (black line, %) over New-York on 16 July 2002, 18:00 UTC. The scale for relative humidity (%) is the botom axis.
ACPD
5, 12465–12503, 2005 Stratosphere-troposphere exchange in a summertime extratropical low J. Brioude et al. Title Page Abstract Introduction Conclusions References Tables Figures J I J I Back Close Full Screen / EscPrint Version Interactive Discussion Fig. 5. MOZAIC measurements of flight Frankfurt-Boston on 17 July 2002, from 13:30 UTC to
15:30 UTC. The abscissa is the longitude. Aircraft path is shown of Fig.7. (a) Ozone mixing
ratio (ppbv) color-coded with carbon monoxide mixing ratio (ppbv, colorbar).(b) Pressure level
of the flight (hPa) color-coded with wind direction (degrees, colorbar). (c) Potential vorticity
(pvu) color-coded by pressure levels (hPa, colorbar) of air parcels traced backward over 48-h by LAGRANTO with ECMWF fields (see text for details). The three stratospheric events are denoted S1, S2, and S3. Time intervals delimited by vertical dashed lines and corresponding with the six groups of parcels discussed in the text are denoted 1, 2, 3 and A, B, C.
ACPD
5, 12465–12503, 2005 Stratosphere-troposphere exchange in a summertime extratropical low J. Brioude et al. Title Page Abstract Introduction Conclusions References Tables Figures J I J I Back Close Full Screen / EscPrint Version Interactive Discussion Fig. 6. Scatterplot O3/CO (ppbv). Grey stars represent MOZAIC measurements in the UTLS
during July 2002 between 100◦W and 30◦W. Colored stars represent data sampled in
cross-tropopause gradients on the eastern (E) and western (W) edges of stratospheric air masses
S1 to S3 (Fig.5). Air parcels for groups 1, 2, 3, A, B, C and TF are represented by black full
ACPD
5, 12465–12503, 2005 Stratosphere-troposphere exchange in a summertime extratropical low J. Brioude et al. Title Page Abstract Introduction Conclusions References Tables Figures J I J I Back Close Full Screen / EscPrint Version Interactive Discussion 1 A 2 B 3 C B+0.15◦ Fig. 7.
ACPD
5, 12465–12503, 2005 Stratosphere-troposphere exchange in a summertime extratropical low J. Brioude et al. Title Page Abstract Introduction Conclusions References Tables Figures J I J I Back Close Full Screen / EscPrint Version Interactive Discussion Fig. 7. 72-h backward trajectories of air parcels in groups of Fig.5. Positions of air parcels
are reported every 3 h from the aircraft path (black line north of New-Foundland) and are color-coded with the pressure level (hPa, colorbar). Other black lines mark vertical cross sections
presented in Figs.11and12. The black line composed of two segments south of New-Foudland
is the vertical cross section displayed on Fig.12. The black line over Canada across positions
of air parcels of the group C is the vertical cross section displayed on Fig.11. Black arrows
show positions of air parcels at the time when they are the closest to the vertical cross section
ACPD
5, 12465–12503, 2005 Stratosphere-troposphere exchange in a summertime extratropical low J. Brioude et al. Title Page Abstract Introduction Conclusions References Tables Figures J I J I Back Close Full Screen / EscPrint Version Interactive Discussion (a) (b) (c) (d) −1 −0.8 −0.6 −0.4 −0.2 0 0.2 0.4 0.6 0.8 1 −1 −0.8 −0.6 −0.4 −0.2 0 0.2 0.4 0.6 0.8 1 0 0.5 1 1.5 2 2.5 3 3.5 4 4.5 5
Fig. 8. Potential Vorticity (pvu, colorbar) field on 16 July, 18:00 UTC: (a) at 650 hPa from the
ECMWF analysis,(b) at 650 hPa from the RDF technique, (c) in vertical cross section from the
ECMWF analysis (abscissa is longitude in degrees),(d) in vertical cross section from the RDF
technique (abscissa is longitude in degrees). The black line in (a) and (b) marks the vertical cross section. The red line in all panels displays the MOZAIC aircraft path when landing to New-York. White lines on vertical cross-sections are potential temperature contours from the ECMWF analysis.
ACPD
5, 12465–12503, 2005 Stratosphere-troposphere exchange in a summertime extratropical low J. Brioude et al. Title Page Abstract Introduction Conclusions References Tables Figures J I J I Back Close Full Screen / EscPrint Version Interactive Discussion (a) (b) −1 −0.8 −0.6 −0.4 −0.2 0 0.2 0.4 0.6 0.8 1 −1 −0.8 −0.6 −0.4 −0.2 0 0.2 0.4 0.6 0.8 1 0 0.5 1 1.5 2 2.5 3 3.5 4 4.5 5
Fig. 9. Potential Vorticity (pvu, colorbar) field on 17 July, 14:00 UTC at 215 hPa: (a)
interpo-lated from ECMWF fields valid at 12:00 UTC and 15:00 UTC,(b) reconstructed with the RDF
technique. The black line is the aircraft path corresponding with the time series of Fig.5. S1,
S2, S3 are stratospheric ozone maxima observed on Fig.5. The pressure level coincides with
ACPD
5, 12465–12503, 2005 Stratosphere-troposphere exchange in a summertime extratropical low J. Brioude et al. Title Page Abstract Introduction Conclusions References Tables Figures J I J I Back Close Full Screen / EscPrint Version Interactive Discussion (a) (b) (c) −1 −0.8 −0.6 −0.4 −0.2 0 0.2 0.4 0.6 0.8 1 −1 −0.8 −0.6 −0.4 −0.2 0 0.2 0.4 0.6 0.8 1 0 0.5 1 1.5 2 2.5 3 3.5 4 4.5 5
Fig. 10. Potential
Vortic-ity (pvu, colorbar) in the verti-cal cross section along the air-craft path on 17 July, 14:00 UTC:
(a) with spatial and temporal
in-terpolation of ECMWF fields,(b)
with the RDF technique
(integra-tion time 30 h), (c) same as (b)
but for latitudes of air parcels
in group B moved 0.15◦ further
north. Abscissa is longitude in degrees. The black line is the
aircraft path. Labels for some
groups of air parcels identified in Fig.5.
ACPD
5, 12465–12503, 2005 Stratosphere-troposphere exchange in a summertime extratropical low J. Brioude et al. Title Page Abstract Introduction Conclusions References Tables Figures J I J I Back Close Full Screen / EscPrint Version Interactive Discussion (a) (b) −1 −0.8 −0.6 −0.4 −0.2 0 0.2 0.4 0.6 0.8 1 −1 −0.8 −0.6 −0.4 −0.2 0 0.2 0.4 0.6 0.8 1 0 0.5 1 1.5 2 2.5 3 3.5 4 4.5 5
Fig. 11. Potential Vorticity (pvu, colorbar) in the vertical cross section along the tracks of air
parcels of group C on 16 July, 03:00 UTC (see Fig.7for location):(a) with spatial and temporal
interpolation of ECMWF fields,(b) with the RDF technique (integration time 30 h), Abscissa is