UNIVERSITÉ DE MONTRÉAL
MAGNETIC POWDERED ACTIVATED CARBON FOR DRINKING WATER TREATMENT
KIM MAREN LOMPE
DÉPARTEMENT DES GÉNIES CIVIL, GÉOLOGIQUE ET DES MINES ÉCOLE POLYTECHNIQUE DE MONTRÉAL
THÈSE PRÉSENTÉE EN VUE DE L’OBTENTION DU DIPLÔME DE PHILOSOPHIAE DOCTOR
(GÉNIE CIVIL) AVRIL 2018
UNIVERSITÉ DE MONTRÉAL
ÉCOLE POLYTECHNIQUE DE MONTRÉAL
Cette thèse intitulée :
MAGNETIC POWDERED ACTIVATED CARBON FOR DRINKING WATER TREATMENT
présentée par : LOMPE Kim Maren
en vue de l’obtention du diplôme de : Philosophiae Doctor a été dûment acceptée par le jury d’examen constitué de :
Mme PRÉVOST Michèle, Ph. D., présidente
M. BARBEAU Benoit, Ph. D., membre et directeur de recherche M. MÉNARD David, Ph. D., membre et codirecteur de recherche M. COMEAU Yves, Ph. D., membre
DEDICATION
Es gibt nichts Gutes, außer:Man tut es! (Erich Kästner) Roughly translates to: No change without action!
Wissen ist Nacht! (Prof. Abdul Nachtigaller – Walter Moers) Roughly translates to: Knowledge is night!
ACKNOWLEDGEMENTS
First and foremost, I would like to thank my advisor Benoit Barbeau for the opportunity to work on this subject at the Chair of drinking water at Polytechnique. Your enthusiasm and optimistic attitude have inspired me. During our many discussions on the various topics of this thesis or some side projects, you were always available and you guided me to solve occurring problem. I appreciate especially that you have always motivated and encouraged me.
Thanks also to my co-advisor, David Menard, not only for your guidance into the exotic world of magnetism but also for your thorough reading of our papers and your positive feedback during our discussions.
Also, I would like to thank the whole lab/chair team (Jacinthe, Julie, Mireille, Yves, Gabriel, Laura) for your support with knowledge, protocols, material and analysis as well as your moral support. Thanks also to Mélanie and Dénis for lending me material and providing all kinds of tools that you can only find in the precious collection of the waste water lab. Thanks also to my interns and Master students: Sarah, Hélène and Maria for your support and help in the lab.
All the hours spent in the lab would not have been fun or even doable, without all my colleagues and friends. Thank you Elise, for welcoming me into the group - with a big friendly smile on day one - and for being my friend ever since. Thank you my dear friend Sanaz, for your strength, for being my emotional support, my confidant and my mischievous partner in crime. Thank you, Evelyne, for your friendship and for being my eternal source of information, cupcakes and my link to the Quebecois culture. Thank you, Fatemeh, for your humor, all the nuts and the introduction to lavashak. Thank you, Laleh, for the fun and your immense kindness. Thank you, all my present and past colleagues and office friends (Emile, Flavia, Mathieu, Félix, Hadis, Veronika, Nargess…). Thank you, dear Christoph, for all the shared years and adventures.
Thanks, also to all my friends outside Polytechnique: Humberto, Céline, Ricardo, Mona.
One of the best things of this whole experience was the opportunity to make international friends. Thank you Lety, Sampada, Isabel, Sanaz, Mauricio, Sandra, Thomas, Rajesh, Xin and Celso for forming this extraordinary second family. Thank you, Andrés, for your love, care and support. Thank you, my dear parents, for sending parcels to Canada and for being interested in my work, your support and for always being there for me and thanks Adrian and loved ones at home!
RÉSUMÉ
En combinant la capacité d’adsorption du charbon actif en poudre (CAP) avec des nanoparticules d’oxyde de fer magnétiques (NP) on obtient un matériau composite prometteur, le CAP magnétique (CAPM). Le CAPM présente l’avantage de pouvoir être séparé de l’eau dans lequel il est en suspension au moyen de séparateurs magnétiques. Cette étape de séparation est essentielle pour re-circuler le CAPM dans le réacteur et permettre son utilisation à long terme, dans l’objectif d’épuiser complètement sa capacité d’adsorption ou d’augmenter l’âge du matériau jusqu’à sa colonisation. Un CAPM biologique (colonisé) permettrait d’éliminer certains polluants biodégradables. Jusqu’à présent, le CAPM a été étudié comme adsorbant pour différents contaminants tels que les métaux lourds, des colorants et quelques polluants organiques à l’état de traces. Cependant, l’influence de la fraction massique des NP sur la capacité d’adsorption des polluants typiques de l’eau potable ainsi que l’application du CAPM dans un procédé biologique n’ont pas encore été étudiées. Dans cette thèse, un CAPM a été développé et évalué comme adsorbant alternatif pour la matière organique naturelle (MON) et certains micropolluants (MP). Finalement, la colonisation du CAPM en biomasse hétérotrophe et nitrifiante a été mesurée. D’abord, trois CAPM ont été produits en utilisant un procédé de co-précipitation et des fractions massiques de NP de 10 %, 38 % et 54 % respectivement. Les CAPM ont été comparés avec du CAP régulier en termes de distribution de taille de pores et d’aire de surface, de charge de surface, de taille de particules et de propriétés magnétiques. Ensuite, les isothermes et la cinétique d’adsorption de la MON et de 9 MP ont été étudiés pour les matériaux composites, frais ou colonisés. Dans une prochaine étape, les CAPM et du CAP régulier ont été colonisés dans des petits réacteurs biologiques pour une période d’au moins 90 jours. Leurs performances d’enlèvement biologique du carbone organique dissous et de l’ammonium, ainsi que la quantité de biomasse hétérotrophe et la communauté bactérienne développée sur les différents CAP ont été comparées. Finalement, la séparabilité du CAPM a été évaluée dans un séparateur magnétique de haut gradient, construit avec des aimants permanents.
Les résultats ont montré que les NP couvrent principalement la surface du CAP microporeux utilisé durant ce projet. La diminution du volume des micropores était proportionnelle à la quantité de CAP dans le composite. Le volume des mésopores augmentait par rapport au CAP, de par la présence de vides entre les NP à la surface. Les NP n’ont pas contribué à l’adsorption de la
MON et des MP. En effet, la capacité d’adsorption pour ces composés était principalement proportionnelle à la quantité de CAP dans le composite. Cependant, lorsque la fraction massique des NP dépassait 38 %, les mésopores propres au CAP étaient bloqués et en conséquence, la capacité d’adsorption pour la MON était réduite. Par ailleurs, la présence des NP n’a pas influencé la cinétique d’adsorption lente de la MON, cependant elle a diminué celle, plus rapide, des MP. La MON était en compétition avec les MP pour les sites d’adsorption sur le CAPM. Ainsi, le CAPM devrait être appliqué préférablement comme étape de polissage après enlèvement de la MON dans la filière de traitement. Après vieillissement des CAPM pour 90 jours et confirmation de la présence d’un biofilm, une capacité d’adsorption résiduelle des MP persistait. Elle était cependant dix fois moins élevée que le CAPM frais. L’étude sur le long terme a montré que la même quantité de biomasse hétérotrophe active se développe sur le CAP et sur le CAPM, et ce même pour les fractions massiques les plus élevées de NP testées. Par ailleurs, une fois l’état stationnaire atteint, les NP n’ont pas réduit l’enlèvement du carbone organique dissous et de l’ammonium. Cependant, la nitrification était retardée de 6 jours sur les CAPM, ce qui a été attribué à l’inhibition initiale des bactéries nitrifiantes. En terme de stabilité du CAPM, une baisse de magnétisation entre 10 % et 34 % a été mesurée entre le début et la fin des essais (90 jours). Cet effet s’explique par la perte de NP par des effets d’abrasion dans la solution de CAPM. En effet, comparativement à du CAP, une vitesse d’agitation plus élevée était nécessaire pour maintenir les matériaux composites lourds en suspension. Finalement, les essais de séparation de CAPM ont montré que 10 % de NP dans le matériau composite n’était pas suffisant pour isoler le CAPM de la suspension avec un séparateur magnétique à haut gradient, et ce même à des vitesses de filtration faibles (0.04 m/s).
Ce projet de recherche a démontré l’aptitude du CAPM pour l’adsorption de la MON et des MP. En choisissant le CAP microporeux comme matrice de CAPM, l’adsorption de la MON et des MP était proportionnelle à la quantité de CAP dans le matériau composite. De plus, le CAPM peut agir à titre de support de biomasse dans le réacteur biologique puisque les NP n’ont pas inhibé l’enlèvement du carbone organique dissous et l’ammonium. En général, des fractions massiques de NP variant entre 10% et 38 % devraient être choisies pour la préparation de CAPM afin de maximiser la quantité d’adsorbant actif (CAP) tout en évitant des vitesses élevées d’agitation pouvant accélérer l’abrasion du matériau.
ABSTRACT
Combining the high adsorption capacity of powdered activated carbon (PAC) with magnetic iron oxide nanoparticles (IONP), leads to a promising composite material, magnetic PAC or MPAC, which can be separated from water using magnetic separators. The possibility to separate the adsorbent from the suspension and to recirculate it into the reactor opens the door for the long-term use of PAC - either to fully exhaust its adsorption capacity or to increase the adsorbent age until the adsorbent particles are fully colonized. The adsorbent particles will then act as a growth support and contribute to the elimination of certain biodegradable pollutants. So far, MPAC has been studied as an adsorbent for various contaminants such as heavy metals, dyes and some organic trace pollutants. Yet, the influence of IONP mass fraction on the adsorption capacity for typical drinking water pollutants or MPAC’s usability in a biological process, have not yet been clarified. In this thesis, MPAC was evaluated as an alternative adsorbent for natural organic matter (NOM) and micropollutants and as a growth support for heterotrophic and nitrifying bacteria.
First, we produced three MPAC composites with mass fractions of 10 %, 38 % and 54 % maghemite nanoparticles using a co-precipitation process. The adsorbents were then compared to bare PAC and pure nanoparticles with respect to pore size and surface area distribution, surface charge, particle size and magnetic properties. Second, the composites were studied regarding their NOM adsorption kinetics and isotherms. Third, we tested the adsorption properties of fresh and colonized MPAC for 9 organic micropollutants representing pharmaceuticals, hormones and pesticides. Subsequently, the three MPAC composites and regular PAC were colonized in small bioreactors for over 90 days to compare their removal performance regarding dissolved organic carbon (DOC) and ammonia. Finally, we explored the separability of MPAC in a high gradient magnetic separator built with permanent magnets.
The results have shown that IONP cover mostly the surface of the microporous PAC used during this project. Reductions in the micropore volumes were mostly proportional to the PAC content in MPAC. Mesopore volume of MPAC on the other hand was increased compared to PAC due to the presence of voids in the IONP crust.
The IONP did not contribute to the adsorption of NOM or MP and thus the adsorption capacity for these compounds was mainly proportional to the PAC mass fraction in MPAC. Only at IONP mass fractions exceeding 38 %, intrinsic PAC mesopores were blocked by IONP, which limited the adsorption capacity of the larger NOM molecules. The presence of IONP did not influence the already slow adsorption kinetics of NOM while the usually fast kinetics of MP were slower on MPAC compared to PAC. NOM competed with MP for adsorption sites on MPAC and the application of MPAC should consequently be considered as a polishing step after NOM has been removed in a previous treatment step such as coagulation-flocculation. A residual but tenfold lower adsorption capacity for micropollutants exists even for aged MPAC (90 days) that are colonized and covered with biofilm. The long-term study of MPAC has shown that the same amount of active heterotrophic biomass (48 µg C/cm³) developed on MPAC with a mass fraction of 54 % IONP as on the non-magnetic PAC control. Moreover, IONP did not influence the DOC and ammonia biological removals once steady state was reached. However, we observed a slightly slower onset of nitrification (6 days) in reactors containing MPAC which might be an indicator for the initial inhibition of nitrifying bacteria. In terms of long-term stability of MPAC, a loss in magnetization between 10 % and 34 % was recorded at the end of the 90 day aging period, which was attributed to a loss of IONP due to attrition. Higher agitation speeds were necessary to keep the heavier composites in suspension. Regarding the separation of MPAC in a HGMS using permanent magnets, 10 % IONP were not sufficient to separate MPAC even at low flow velocities of 0.04 m/s.
Overall, this research project has shown the suitability of MPAC for the adsorption of NOM and micropollutants. With the microporous PAC that was chosen as MPAC template, the adsorption capacity of NOM and micropollutants was mostly proportional to the PAC content in the composite material. Moreover, MPAC can serve as a growth support in a bioreactor as IONP did not inhibit dissolved organic and ammonia biological removal by MPAC. In general, IONP mass fractions between 10 % and 38 % should be chosen for the preparation of MPAC in order to maximize the content of the active adsorbent (PAC) per unit weight and to avoid high agitation speeds and attrition due to high MPAC densities.
TABLE OF CONTENTS
DEDICATION ... III ACKNOWLEDGEMENTS ... IV RÉSUMÉ ... V ABSTRACT ... VII TABLE OF CONTENTS ... IX LIST OF TABLES ... XV LIST OF FIGURES ... XVII LIST OF SYMBOLS AND ABBREVIATIONS... XXIII LIST OF APPENDICES ... XXVCHAPTER 1 INTRODUCTION - WHY DO WE NEED A MAGNETICALLY
SEPARABLE ADSORBENT FOR WATER TREATMENT? ... 1
CHAPTER 2 CRITICAL LITERATURE REVIEW ... 5
2.1 A promising magnetic adsorbent ... 5
2.2 Adsorption theory and models ... 6
2.2.1 Factors that influence adsorption kinetics and capacity ... 7
2.2.2 Isotherm and kinetic models ... 8
2.3 Theoretical background of magnetic separation ... 12
2.3.1 Magnetism and magnetic materials ... 12
2.3.2 Theory of magnetic separation ... 14
2.3.3 Magnetic separation in water treatment ... 16
2.4 Synthesis of magnetic powdered activated carbons ... 18
2.5.1 Type of iron oxides and magnetic properties ... 21
2.5.2 Long-term stability ... 22
2.5.3 Surface area and porosity ... 22
2.5.4 Surface chemistry ... 24
2.6 Adsorption of water pollutants on MPAC ... 25
2.6.1 MPAC as enhanced adsorbents for heavy metals and NOM ... 25
2.6.2 MPAC as magnetically recoverable adsorbent for organic dyes and micropollutants .. …...………..…27
2.7 Compatibility of magnetic nanoparticles with heterotrophic and nitrifying bacteria .... 30
2.7.1 Potential interaction pathways of IONP with microorganisms ... 30
2.7.2 Observed cytotoxicity of IONP towards planktonic bacteria and biofilms ... 33
2.8 A critique of anterior MPAC synthesis and application ... 35
CHAPTER 3 RESEARCH OBJECTIVES, HYPOTHESES AND METHODOLOGY ... 37
3.1 Research objectives and hypotheses ... 37
3.2 Research Strategy and Methodology ... 40
3.2.1 Synthesis of magnetic powdered activated carbon with distinct IONP mass fractions (Hyp. 1-6) ... 40
3.2.2 Characterization of the material properties (Hyp. 1-6) ... 42
3.2.3 Adsorption studies (Hyp. 2 & Hyp. 4) ... 47
3.2.4 Colonization study in bioreactors (Hyp. 3, 4 & 5) ... 48
3.2.5 Stability of the aged adsorbents (Hyp. 5) ... 50
3.2.6 Separation study (Hyp. 6) ... 50
CHAPTER 4 ARTICLE 1 - THE INFLUENCE OF IRON OXIDE NANOPARTICLES UPON THE ADSORPTION OF ORGANIC MATTER ON MAGNETIC POWDERED ACTIVATED CARBON ... 54
4.1 Introduction ... 55
4.2 Materials and Methods ... 57
4.2.1 Water matrix ... 57
4.2.2 Preparation of PAC and MPAC adsorbents ... 58
4.2.3 PAC and MPAC characterization ... 59
4.2.4 Adsorption isotherms and kinetics ... 59
4.3 Results ... 61
4.3.1 PAC and MPAC characterization ... 61
4.3.2 Adsorption isotherms ... 66
4.3.3 Adsorption kinetics ... 69
4.3.4 Adsorption selectivity ... 70
4.4 Discussion ... 71
4.4.1 Adsorption capacity of IONP ... 72
4.4.2 Reduction of mesopores in PAC ... 73
4.4.3 Adsorption kinetics ... 74
4.4.4 Practical implications ... 75
4.5 Conclusions ... 75
CHAPTER 5 ARTICLE 2 - REMOVAL OF MICROPOLLUTANTS BY FRESH AND COLONIZED MAGNETIC POWDERED ACTIVATED CARBON ... 77
5.1 Introduction ... 78
5.2 Materials and Methods ... 80
5.2.1 Water matrix ... 80
5.2.2 Micropollutants and water matrices ... 81
5.2.3 Adsorption experiments ... 82
5.3 Results and discussion ... 83
5.3.1 MP removal on pure maghemite IONP ... 83
5.3.2 MP removal by virgin PAC and MPAC... 85
5.3.3 Influence of NOM ... 88
5.3.4 The influence of biofilm formation on MP removal ... 89
5.3.5 Implications for water treatment ... 91
CHAPTER 6 ARTICLE 3 - PERFORMANCE OF BIOLOGICAL MAGNETIC POWDERED ACTIVATED CARBON FOR DRINKING WATER PURIFICATION ... 92
6.1 Introduction ... 93
6.2 Materials and Methods ... 96
6.2.1 Magnetic powdered activated carbon ... 96
6.2.2 Colonization study ... 98
6.2.3 Analytical methods ... 99
6.2.4 Quantification of biomass on PAC and MPAC particles ... 99
6.2.5 Bacterial community analysis ... 100
6.2.6 Imaging biofilm and bacteria on PAC and MPAC ... 101
6.2.7 Analyzing MPAC stability ... 101
6.2.8 Statistical analysis ... 101
6.3 Results ... 103
6.3.1 Removal of organic matter ... 103
6.3.2 Removal of ammonia ... 105
6.3.3 Bacterial biomass density in the bioreactors ... 105
6.3.4 Visualizing colonisation on MPAC ... 106
6.3.5 Analysis of the bacterial community ... 107
6.4 Discussion ... 109
6.4.1 DOC removals ... 109
6.4.2 Ammonia removal ... 111
6.4.3 Bacterial community composition ... 112
6.4.4 Stability of iron oxide NPs ... 112
6.5 Conclusions ... 113
CHAPTER 7 SEPARABILITY OF MPAC – CHALLENGES AND LIMITS ... 114
7.1 Introduction to magnetic separation for MPAC in water treatment ... 114
7.2 Material and methods ... 115
7.2.1 Magnetic powdered activated carbon ... 115
7.2.2 Magnetic Separator and setup ... 116
7.2.3 Experimental plan and statistical analysis ... 118
7.3 Results and discussion ... 118
7.3.1 Magnetic separator characterization ... 118
7.3.2 Separation efficiencies under different operation conditions ... 119
7.4 Conclusions and recommendations for future work ... 123
CHAPTER 8 GENERAL DISCUSSION ... 125
8.1 How does the IONP content change the adsorption properties? ... 126
8.1.1 IONP location in MPAC ... 126
8.1.2 Adsorption of NOM on MPAC ... 127
8.1.3 Adsorption of MP on fresh and colonized MPAC and PAC... 129
8.1.4 MPAC vs. PAC in the bioreactor ... 131
8.2 Stability of MPAC in long-term applications ... 133
8.4 Cost vs. benefits ... 135
8.4.1 Unit costs of MPAC ... 135
8.4.2 Scale-up and costs of the magnetic separator ... 136
8.4.3 Benefits of using MPAC ... 138
CHAPTER 9 CONCLUSIONS AND RECOMMENDATIONS... 140
9.1 Main findings – MPAC in drinking water treatment ... 140
9.2 Future work ... 143
BIBLIOGRAPHY ... 144
LIST OF TABLES
Table 3.1 : Experimental approach developed to validate (or invalidate) the research hypotheses
and corresponding articles. ... 52
Table 4.1 : Characteristics of the adsorbents. ... 62
Table 4.2 : Freundlicha coefficients for the adsorption of NOM onto PAC, MPAC and IONP. ... 69
Table 5.1 : Adsorbent properties. ... 84
Table 5.2 : Micropollutants, initially spiked concentrations and detection limits. ... 84
Table 6.1 : Characteristics of the PAC and MPAC adsorbents. ... 97
Table 6.2 : Pilot influent characteristics. ... 98
Table 6.3 : PAC and MPAC concentrations in the bioreactors. ... 101
Table 6.4 : Analytical methods. ... 102
Table 6.5 : Number of analyzed sequences and OTUs. ... 108
Table 7.1 : MPAC properties. ... 116
Table 7.2 : Characteristics of the separator. ... 117
Table 7.3 : Experimental conditions for the separation tests. ... 118
Table 7.4 : Experiments and separation efficiency. ... 120
Table A-1 : Studies of NOM adsorption on magnetic PAC. ... 158
Table A-2 : Distribution of pore volume (V) and surface area (SA) for PAC and MPAC. ... 161
Table A-3 : Pseudo-second order kinetic model parameters and HSDM parameters. ... 161
Table B-1 : Adsorption isotherm parameters for PAC & MPAC applying the Freundlicha model (datasets normalized to PAC content). ... 163
Table B-2 : Freundlich parameters for MP adsorption on magnetic activated carbons (MAC) in the literature (1). ... 164
Table B-3 : Kinetic parametersa for micropollutant adsorption onto PAC and MPAC (based on
PAC mass) for t = 0 to 60 min. ... 166
Table C-1 : Typical lamella settler characteristics. ... 171
Table C-2 : Calculated lamella design. ... 171
Table C-3 : Wet particle density of MPAC. ... 172
Table C-4 : Properties of MPAC with increasing IONP content. ... 174
Table C-5 : Parameter for the lamella separator. ... 179
Table C-6 : Characteristics of the MPAC particles for magnetic separation. ... 180
Table D-1 : MPAC raw materials. ... 182
LIST OF FIGURES
Figure 2.1: Publications on magnetic activated carbons since 2002. ... 5 Figure 2.2 : Orientation of the Weiss domains within a ferromagnetic material. The arrow
indicates the direction of increasing strength of the applied magnetic field . ... 13 Figure 2.3 : a) Hysteresis curve for ferro- and ferromagnetic materials, b) Magnetization curve
for superparamagnetic materials (taken from Spaldin, 2003). ... 14 Figure 2.4 : Reduction of specific surface area and pore volumes as a function of IONP content in
MPAC. The IONP contents were calculated from provided material characteristics (desired/measured Fe-content in the composite material combined with XRD/VSM data), surface area and pore volume reduction from reported BET surface and pore volume data. [1] (Faulconer et al. 2012), [2] (Castro et al. 2009), [3] (Mohan et al. 2011), [4] (Zhang et al. 2007), [5] (Bastami and Entezari 2012), [6] (Saroyan et al. 2017), [7] (Chun et al. 2012), [8] (Yang et al. 2008), [9] (Zahoor 2014), [10] (Kim et al. 2013), [11] (Park et al. 2015), [12] (Kondo et al. 2010), [13] (Oliveira et al. 2002), [14] (Zahoor and Mahramonlioglu 2011), [15] (Baghdadi et al. 2016). ... 23 Figure 3.1: Bioreactor setup in the laboratory. ... 49 Figure 4.1 : MPAC synthesis reactor: 1 - Nitrogen gas, 2 - NaOH addition 10 mL/min, 3 -
Addition of ferric chloride, 4 - Agitation at 700 rpm, 5 - Addition of Ferrous sulphate, 6 - Warm water outlet condenser, 7 - Air outlet condenser, 8 – Condenser to avoid changes of volume due to evaporation, 9 - Cold water inlet condenser, 10 - Hot water bath (70°C). ... 58 Figure 4.2 : X-ray diffractogram with highlighted positions of identified maghemite phase. Low
crystallinity is visible in the MPAC-10% sample. ... 62 Figure 4.3 : a) Surface area and b) pore volume distribution, both recorded from nitrogen
adsorption isotherms and calculated as NLDFT distributions. c) Pore volume constitution with primary micropores < 0.8 nm, secondary micropores 0.8 nm < Ø < 2 nm, mesopores 2 nm < Ø < 50 nm. ... 64
Figure 4.4 : a) PAC surface without IONP, b) arrows point to crust of IONP on the surface of MPAC-54% and c) cross section of a MPAC-54% particle embedded in a polished epoxy matrix, arrows pointing to the IONP cover on the surface of PAC. Element mapping confirmed the presence of iron and oxygen on the outer surface of PAC and inside the particle (s. SI for recorded EDS spectra in Figure A-2 and Figure A-3). ... 65 Figure 4.5 : Linearized DOC solid concentration qe normalized by a) adsorbent mass, b)
accessible surface area (pores > 1 nm), c) accessible pore volume (pores > 1 nm) and d) PAC mass fraction. ... 67 Figure 4.6 : Measured isotherms compared to theoretical isotherms composed from pure PAC
and pure IONP isotherms. Theoretical isotherms assume independent effects of both sorbents and deviations between measured and theoretical isotherms thus indicate the loss of adsorption capacity due to blocked mesopores in the carbon matrix. ... 68 Figure 4.7 : Kinetic experimental data and HSDM model with diffusion coefficients of 0.91 ·10
-14 m²/s (PAC), 1.21·10-14
m²/s (MPAC-38%) and 1.18·10-14 m²/s (MPAC-54%). The root mean squared error RMSE is highest for PAC (0.170), and lower for MPAC-38% (0.107) and MPAC-54% (0.055). ... 70 Figure 4.8 : a) Absolute HPSEC/UV chromatograms of SR-NOM remaining in solution after 24h
adsorption tests with a dose of 0.048 g/L of PAC and MPAC. Retention times were converted into molecular weight (daltons) with the help of a polystyrene sulfonate standard calibration curve. b) Normalized SR-NOM chromatograms were calculated as the ratio absolute / maximal measured signal intensity. PAC, MPAC-38% and MPAC-54% eliminate over-proportionally the small aromatic NOM fraction from the SR-NOM solution. The detail of the low molecular weight fraction shows higher adsorption on PAC compared to MPAC-38% and MPAC-54%. ... 71 Figure 5.1 : Differences between concentration of all 9 MP before (0 h) and after (24 h)
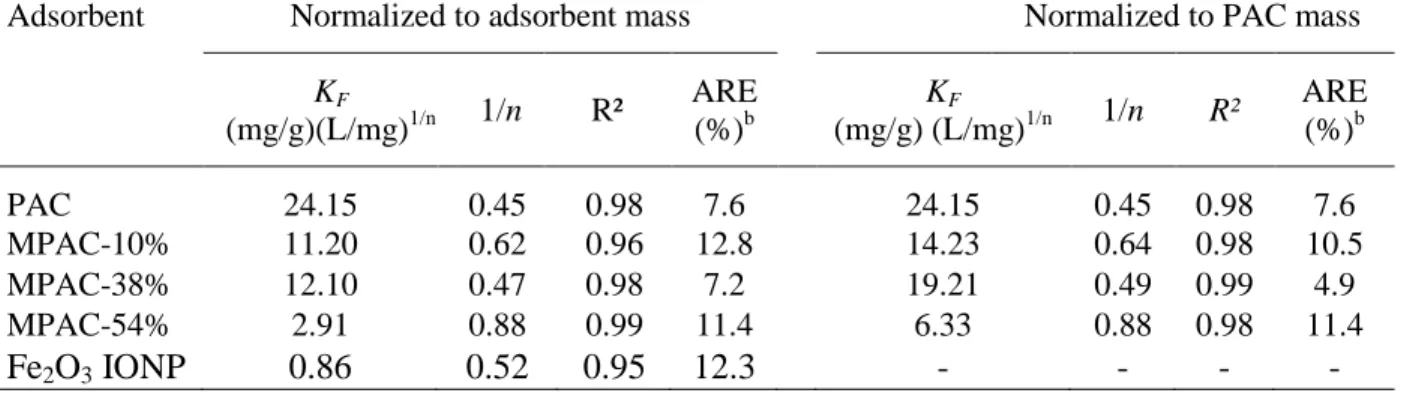
adsorption on 0.005 – 1 g IONP/L are not statistically significant (p = 0.78). SE: standard error. ... 86 Figure 5.2 : Freundlich constants KF adsorbent for non-colonized PAC and MPAC expressed as
µg pollutant a) per total mass of adsorbent and b) per mass of PAC. ... 86 Figure 5.3 : Freundlich KF-values dependence on MP solubility and charge. ... 87
Figure 5.4 : Kinetic constants of the pseudo-second order kinetic model for all MP regrouped by adsorbent type for data (0 – 24 h) normalized to PAC content. Inset (logarithmic scale) shows the kinetic rate constants for each adsorbent grouped by pollutant. ... 88 Figure 5.5 : Normalized MP solid concentrations obtained with the 4 adsorbents in different
water types. Whiskers represent the 95 % confidence interval and variation is due to the variation in duplicates and between adsorbent types. ... 89 Figure 5.6 : a) Freundlich parameters KF and b) 1/n for MP adsorption on virgin and colonized
adsorbents with data normalized to PAC content. Boxes represent standard errors and whiskers the 95 % confidence interval (1.96 x standard error) while the dotted blue lines provide the specific values for individual MP. ... 90 Figure 6.1 : Schematic of the bioreactor setup. 1: Influent dechlorinated tap water; 2: Reservoir
(1.7 m³) for temperature adjustment; 3: Nutrient reservoir (autoclaved); 4: bioreactor with 10 µm nylon mesh strainer and agitator; 5: Effluent water. ... 97 Figure 6.2 : Removals of : DOC, UVA254 and N-NH4 in 5 bioreactors with 10g/L of PAC and
variable iron oxide content. The dashed line represents the beginning of the steady state after approx. 40 days. ... 104 Figure 6.3 : PGR rates and measured active heterotrophic biomass on PAC and MPAC expressed
as µg C/cm³ adsorbent. ... 106 Figure 6.4 : SEM images of (a) virgin PAC, (b) virgin MPAC-54%, (c) 95 days old colonized
MPAC-54% and (d) BaclightTM image of living/dead bacteria on MPAC-54% (cells with intact membranes are green). ... 107 Figure 6.5 : Relative abundance of bacterial classes in biomass extracted from PAC and MPAC
samples. ... 108 Figure 6.6 : Total iron retentions (calculated as the difference between outlet and inlet) over the
whole study period of > 90 days. N = 120 samples per reactor. ... 108 Figure 6.7 : Magnetization of MPAC before and after 90 days aging period. ... 109 Figure 7.1 : a) Schematic of the magnetic separation setup : (1) carbon contactor 2 L, (2) stirrer
water tank, (6) Plexiglas casing for magnets, (7) magnet, (8) glass tube Ø 1 cm, (9) stainless steel packing. b) Picture of the separator. ... 117 Figure 7.2 : Packing densities of a) 0.1 g/cm³, b) 0.15 g/cm³ and c) 0.2 g/cm of stainless steel
wool in the separator. ... 118 Figure 7.3 : Flux density and field lines for the permanent magnet setup without the steel wool in
the gap. ... 119 Figure 7.4 : Drag force calculated as a function of the particle diameter and flow velocity.
Highlighted zones are the tested flow velocities in the magnetic separator of 144 m/h and 360 m/h. ... 120 Figure 7.5 : Separation test results for filtration of 2 L of MPAC suspensions. ... 121 Figure 8.1 : Structure of the research project. ... 125 Figure 8.2: Unit costs of raw materials for the preparation of MPAC calculated for metric tons of
aqueous salt solutions with 330 $/t (NaOH, 50 %), 180 $/t (FeSO4, 18 %), 140 $/t (FeCl3, 13.8 %) and Energy costs of 0.08 $/kWh. ... 136 Figure A-1 : SEM images of MPAC with different IONP mass fractions a) 10 %, b) 38 % and c) 54 % show the distribution of IONP on the PAC particles. IONP are visible as white areas on the grey PAC particles. Particles of MPAC-10% and MPAC-38% samples appeared sparely covered with clumps of IONP whereas MPAC-54% samples show a more continuous IONP crust. ... 159 Figure A-2 : SEM image of a cross section of MPAC-54% particle embedded in a polished epoxy matrix
showing the four regions used for EDS spectra recording. Region 1 is the epoxy matrix, region 2 is a large area inside the particle, region 3 is the IONP crust on the particle’s surface and region 4 is a small area inside the particle. ... 159 Figure A-3 : EDS spectra from regions 2 to 4 of the MPAC-54% particle show the presence of iron inside
the particle and in the crust on the surface of the particle (region 3). Spectra 1 is the reference region 1 (epoxy matrix). ... 160 Figure A-4 : SUVA254 indices of the SR-NOM solutions after adsorption isotherm experiments
Figure B-1 : Micropollutant loadings q (µg/mg PAC) versus concentration c (µg/L) in
equilibrium on a) non-colonized and b) colonized PAC and MPAC. ... 162
Figure B-2 : Adsorption kinetics of 9 micropollutants on a) non-colonized and b) colonized PAC and MPAC. ... 167
Figure B-3 : Size distribution of NOM of the three water types ultra-pure, tap and raw water. . 168
Figure B-4 : Breakthrough curve of DOC in 90 days of operation. While the adsorption capacity of the adsorbents decreases from the initial 60 % with increasing bed volume, the biodegradation of DOC increases leading to a constant DOC removal of 20 – 30 % when the adsorption capacity for DOC is already exhausted (after ca. 30000 bed volumes). ... 168
Figure B-5 : a) Precipitated minerals on the PAC surface (atomic percentage of 35 % C, 40 % O, 14 % Si, 9 % Ca), b) surface of aged MPAC-38% (after 90 days). ... 168
Figure C-1 : Lamella separator in 2D and 3D layout. ... 169
Figure C-2 : Sedimentation velocity (Stokes) for 54% (red). 38% (green), MPAC-10% (blue) and MPAC-0% (black. The horizontal line indicates vcrit.. ... 172
Figure C-3 : Volume fraction that is not separated in the lamella separator. ... 172
Figure C-4 : Forces acting on the particle in a typical lamella separator. ... 173
Figure C-5 : Particle motion a) x(t) and b) z(t) in the lamella separator. ... 175
Figure C-6 : Trajectories in the lamella separator. All particles travelling in the blue area are not separated. ... 175
Figure C-7 : Particle trajectories in the lamella separator including the magnetic force. ... 177
Figure C-8 : Result a) z(t) and b) vz(t) for the magnetic lamella separator (heaviest particles are not transported upwards (negative velocity)). ... 178
Figure C-9 : Trajectories x(t) and were solved numerically for a) MPAC-54% (25 µm), b) MPAC-10% (25 µm) and c) MPAC-0% (25 µm); the trajectories in x and z-direction were calculated in d) for MPAC-54% particles (25 µm); the trajectory in x-direction for 3 MPAC-54% particle sizes was calculated in e) and in f) a comparison between MPAC-54% particles of 25 µm with and without magnetic field is given. ... 181
Figure D-1 : Composition of prices in MPAC. ... 184 Figure E-1 : MIB and geosmin removal performance of PAC and MPAC-54% in three water
LIST OF SYMBOLS AND ABBREVIATIONS
AC Activated carbon
ARE Average relative error (%)
BDOC Biodegradable dissolved organic carbon BET Brunauer-Emmett and Teller theory CUR Carbon usage rate
DBP Disinfection by-products DOC Dissolved organic carbon
EDS Energy dispersive X-ray spectroscopy EPS Extracellular polymeric substances GAC Granular activated carbon
HA Humic acid
HGMS High gradient magnetic separator HIMS High intensity magnetic separator HMP Hybrid membrane process
HRT Hydraulic retention time
HSDM Homogeneous surface diffusion model IONP Iron oxide nanoparticle(s)
MAC Magnetic activated carbon(s) MF Microfiltration
MPAC Magnetic powdered activated carbon(s) NLDFT Non-local density function theory NOM Natural organic matter
NP Nanoparticles
OTU Operational taxonomic unit(s) PAC Powdered activated carbon PES Polyethersulfone
PGR Potential glucose respiration rate RMSE Root mean squared error
ROS Reactive oxygen species SEM Scanning electron microscopy SR-NOM Suwannee River NOM
SUVA254 Specific ultraviolet absorbance at 254 nm TEM Transmission electron microscopy
TOC Total organic carbon UF Ultrafiltration UVA UV absorbance
VSM Vibrating sample magnetometer XRD X-ray diffraction
LIST OF APPENDICES
SUPPLEMENTARY INFORMATION, ARTICLE 2 ... 158 APPENDIX A
SUPPLEMENTARY MATERIAL, ARTICLE 3 ... 162 APPENDIX B
MODELLING A MAGNETIC LAMELLA SEPARATOR – APPROACH APPENDIX C
AND RESULTS ... 169 CALCULATION OF COSTS FOR MPAC ... 182 APPENDIX D
ADSORPTION OF MIB AND GEOSMIN ON PAC AND MPAC ... 185 APPENDIX E
CHAPTER 1
INTRODUCTION - WHY DO WE NEED A
MAGNETICALLY SEPARABLE ADSORBENT FOR WATER
TREATMENT?
Magnetic powdered activated carbons (MPAC) are magnetically enhanced adsorbents that combine two desired qualities: high adsorbent capacities for many organic pollutants and their magnetic properties that allow for simple and highly efficient recovery via magnetic separation (Anzai et al. 2016, Borghi and Fabbri 2014, Kim et al. 2013). The magnetic properties of MPAC are achieved by combining PAC with iron oxide nanoparticles (IONP) such as the ferrimagnetic maghemite or magnetite. It is the magnetic separability that makes these novel adsorbents attractive for a variety of powdered activated carbon (PAC) applications in drinking water as it allows returning PAC into the process and thus to increase the solid retention time.
Conventional PAC has successfully been employed in water treatment for decades to deal with organic molecules at trace level, as it efficiently removes a wide range of organic pollutants via adsorption. However, the short contact times of a few minutes typically prevailing within water treatment processes do not allow to fully exhaust the PAC adsorption capacity (Kim et al. 2014). As PAC is a costly expense for a water treatment plant (currently around 1.0 - 2.5 $ CAD/kg), techniques are sought for to use PAC longer until its adsorption capacity is fully exhausted or even longer (> 30 days) until PAC particles are colonized with bacteria to work in a combined adsorption/biodegradation process (Stoquart et al. 2012). Processes using colonized PAC are especially promising as they can be used to remove not only trace contaminants via adsorption but also biodegradable precursors of disinfection by-products (DBP) such as biodegradable dissolved organic carbon (BDOC) and ammonia (Markarian et al. 2010). In both cases (pure adsorption or combined biodegradation PAC processes) efficient PAC separation is necessary to return the adsorbent particles back into the carbon contactor until the desired PAC age is achieved. Separating PAC, however, remains a challenge as it entails the problem of separating fine and stable suspensions (Tarleton and Wakeman 2007).
Conventional separation technologies for fine PAC suspensions are filtration, flotation, gravity sedimentation, and centrifugal sedimentation. Sedimentation following a pre-treatment of coagulation/ flocculation is the most common PAC separation step in water treatment and is often followed by sedimentation basins, lamella separators or deep bed filters where a flocculation aid
is added to enhance the filter’s removal efficiency. The pre-treatment is required as the PAC particles have nearly the same density as water and are too small for efficient sedimentation (Svarovsky 2000). Coagulation/flocculation aims at increasing the diameter of PAC to allow for faster sedimentation. However, separation via sedimentation is time and space-consuming and chemical products such as coagulants and flocculation aids are expensive or in the case of polyacrylamide might be forbidden in the nearer future on the European market.
Current designs of processes using highly concentrated PAC suspensions, so-called hybrid membrane processes (HMP), are low pressure membranes such as microfiltration (MF) and ultrafiltration (UF) membranes which are either immersed in the PAC reactor or in direct contact with the PAC suspension. In this configuration the membrane is acting as a barrier for PAC particles but also particulate contaminants such as Cryptosporidium or other protozoan pathogens (Lebeau et al. 1998). The compact layout and the complete separation of PAC particles are a considerable advantage of this design which was tested in several pilot studies (Lebeau et al. 1998, Leveillé et al. 2013). The HMP design with immersed membranes and PAC retention times < 7 days exist as full-scale processes (e.g. as the commercialized Opaline C process (Veolia Water 2013) and the Cristal process (Suez Environment)). However, contacting the membrane directly with highly concentrated PAC suspensions can lead to abrasion and clogging of the membranes which is a constraint of this technology (Oligny et al. 2016, Seo et al. 2005).
The issue of PAC separation becomes more important when the process is designed to work at high PAC age, where PAC particles do not only serve as adsorbents but also as a support for heterotrophic and nitrifying biomass. When operated in biological mode, a direct contact of colonized PAC with the membrane can lead to increased fouling as biomass develops a gel layer on the membrane surface that functions as adhesive between membrane and PAC (Seo et al. 2005). Severe membrane fouling resulting from the direct contact of the membranes with highly concentrated and colonized PAC suspensions have limited so far the industrial application of biologically working HMP. A separation step for PAC or colonized PAC that efficiently removes PAC from the membrane feed flow is the missing element for the application of the HMP as a combined adsorption/biodegradation process.
The advantage of magnetic separation is obvious: there is no need to add any chemical products to the process which could affect the carbon’s capacity. Also, separation with magnetic separators and re-dispersion of PAC into the water can be fast. Recently, Zahoor (2014) proposed MPAC as
an alternative to the use of PAC in a lab-scale HMP with low PAC age where problems related to cake formation and membrane fouling were successfully avoided using magnetic separation to provide a low-particle membrane feed.
Previous adsorption studies have shown the suitability of MPAC for different organic dyes such as methylene blue, acid orange, methyl orange and humic acid (Ai and Jiang 2010, Kondo et al. 2010, Yang et al. 2008), a range of micropollutants (MP) such as bisphenol-A (endocrine disruptor) (Koduru et al. 2016, Nakahira et al. 2006, Nakahira et al. 2007, Park et al. 2015), atrazine (herbicide) (Castro et al. 2009), imidacloprid (insecticide) (Zahoor and Mahramonlioglu 2011), ciprofloxacin (antibiotic) (Shi et al. 2013), carbamazepine (anti-epileptic drug) (Baghdadi et al. 2016), and naproxen (anti-inflammatory) (Ilbay et al. 2015). Using MPAC for the removal of NOM has been proposed by Kondo et al. (2010),Anzai et al. (2016), Kim et al. (2013), Park et al. (2015) and Zahoor (2014).
The studies show promising results as adsorption capacities of MPAC seem only partly affected by the presence of magnetite nanoparticles. Several considerations, however, are still missing towards the application of MPAC for the HMP:
While removal of inorganic and organic molecules by MPAC has been demonstrated, the interplay between IONP content in MPAC, pore size distribution of PAC and contaminant properties had not yet been investigated.
While studies on the impact of pure IONP on environmental systems exist (Ju-Nam and Lead 2008, Klaine et al. 2008, Moore 2006), the impact of magnetically enhanced carbon materials in biological processes have not been undertaken.
Applying easily separable MPAC opens up new possibilities for both: MPAC use at high PAC ages to exploit the benefits of colonized adsorbents that allow for biodegradation of dissolved contaminants and for typical applications of PAC where contact times are short and PAC is returned into the process to exhaust its adsorption capacity. Investigating the influence of IONP content in MPAC on adsorption properties and biological growth are necessary to design processes that help to solve the current and future challenges of removing dissolved organic contaminants from drinking water.
The main research questions that were addressed in this thesis are :
i) How do IONP change the physical properties of PAC (pore size distribution, surface area, surface charge, size, magnetic properties)?
ii) How does IONP content of MPAC influence the adsorption capacity for NOM? iii) How does IONP content of MPAC influence the adsorption capacity for MP? iv) What is the role of NOM in MP adsorption on MPAC?
v) Is there a significant residual MP adsorption capacity on 90 days aged MPAC? vi) Do IONP inhibit the development of heterotrophic and nitrifying biomass on MPAC? vii) How does IONP content influence the biodegradation of NOM and ammonia?
viii) Are MPAC particles stable composites even at high adsorbent age? This thesis is structured in 8 chapters.
A critical review of the state of the art of magnetic PAC synthesis and application is presented in Chapter 2 and leads to the objectives, hypotheses and methodology that are formulated in Chapter 3. Chapters 4 through 6 represent the research results in the form of published or submitted articles. The first article presents the synthesis and characterization of the magnetic adsorbent and systematic and quantitative evaluation of IONP mass fractions on NOM adsorption (research questions i and ii). NOM removal was evaluated with respect to the distribution of pore volume and surface area as well as the NOM characteristics such as molecular size and aromaticity. The second article demonstrates the suitability of fresh and colonized MPAC for the removal of trace pollutants in natural waters (research questions iii through v). The third article evaluates MPAC performance both as an adsorbent and as a support for biological growth within a bioreactor operated for 90 days (research questions vi to viii). Chapter 7 reports findings on the separability of MPAC in a magnetic separator. Finally, a general discussion is provided in Chapter 8 followed by conclusions and recommendations.
CHAPTER 2
CRITICAL LITERATURE REVIEW
2.1 A promising magnetic adsorbent
In the last decade the preparation of magnetic adsorbents gained attention due to their qualities as adsorbents and their simple and highly efficient recovery via magnetic separation (Figure 2.1). Magnetic separation has many advantages over conventional separation techniques such as gravitational or centrifugal separation as also very fine particles can be separated, no chemicals have to be added, separation is fast and the equipment is space-saving (Svarovsky 2000). Of course, magnetic separation requires magnetically susceptible particles that can be separated applying a magnetic field. This constraint would normally exclude conventional PAC from the field of application. Magnetically modified PAC (MPAC) which is presented with its specific properties in this Chapter, however, is in the scope of applications for magnetic separators. MPAC are composite materials with a non-magnetic structure of activated carbon that serves as an adsorbent and magnetic labels such as iron oxides (mainly maghemite and magnetite) at nano- or micro scale that are responsible for the strong magnetic behaviour of the composite (Safarik et al. 2013).
Figure 2.1: Publications on magnetic activated carbons since 20021.
Aside from the additional advantage of magnetic separability, the role of MPAC remains that of an adsorbent in the first place. If PAC is to be replaced by MPAC as an alternative adsorbent, the
1 Search strategy with Web of Science: TS=(carbon OR biochar) AND TS=(activated OR porous OR powdered)
AND TS=(adsorbent) AND TS=(magnetic OR magnetite OR Fe3O4 or Fe2O3 OR iron oxide) NOT TS=(tube OR nanotube* OR multiwall* OR sheet OR silica OR template OR dioxide OR multi* OR electro* OR calcium OR nanosphere* OR catalyst OR copper OR nuclear OR resonance OR Frequency OR magnetic suspension balance OR MIEX OR Resin OR chitosan OR microsphere* OR polymer OR graph* OR zeolite*)
0 50 100 150 200 250 300 350 2000 2005 2010 2015 2020 Num be r of publ icat ions Year
properties of MPAC that allow for high adsorption capacity and fast kinetics for the target contaminant should remain similar to PAC. The challenge regarding the design of this composite material is thus to
(i) Choose either the best PAC or the best PAC template to allow for maximum adsorption of the specific target pollutant;
(ii) Optimize the MPAC synthesis method to preserve/enhance the adsorption properties of PAC while producing magnetic nanoparticles of highest quality regarding their magnetic properties;
(iii) Optimize the ratio of PAC and magnetic nanoparticles to ensure good adsorption properties while at the same time obtaining sufficient magnetic properties for separation.
The first part of this literature review focuses on adsorption theory to provide the necessary background to take on the challenge (i). The next part is dedicated to the theory of magnetism and magnetic materials addressing challenge (ii). This is followed by a critical review of the existing literature on MPAC with respect to the synthesis methods, MPAC properties and adsorption studies (iii). Finally, the compatibility of magnetic nanoparticles with heterotrophic and nitrifying bacteria is reviewed to set the basis for the application of MPAC in a biological drinking water process as suggested for the first time in this project.
2.2 Adsorption theory and models
Adsorption is a process where dissolved contaminants (adsorbates) are removed from the aqueous solution via adsorption onto a solid surface (adsorbent) (Worch 2012). This mass transfer process for porous materials such as PAC involves (i) the transport of the adsorbate from the bulk liquid to the external surface of PAC, (ii) the diffusion into the inner pore system and (iii) its attachment to the inner surface. The kinetics of this process are determined by the rate controlling external and internal mass transfer whereas the attachment itself is fast (Worch 2012). The adsorption of organic pollutants on PAC is governed by the nature of the adsorbent, the nature of the adsorbate and the properties of the water matrix. The interactions between adsorbate and adsorbent influence the adsorption kinetics and capacity. For practical applications, adsorption experiments have to be conducted. Models that have been developed to represent in a
simplified way the equilibrium behaviour via isotherms and time dependence of adsorption processes via kinetic models can be applied to the data obtained.
2.2.1 Factors that influence adsorption kinetics and capacity
Nature of the adsorbent 2.2.1.1
The basic raw materials (e.g. wood, coconut shells, lignite coal or bituminous coal), the carbonization method (temperature and holding time) as well as the method of activation (acid, base or steam) determine the chemical composition, the surface chemistry, the surface structure and porosity of PAC (Çeçen and Aktas 2012, Chattopadhyaya et al. 2006). These properties can vary widely between products and define their adsorption characteristics (Çeçen and Aktas 2012). The surface of PAC is mainly hydrophobic but can contain charged functional groups such as oxygen groups that lead to a (slightly) negatively charged surface when suspended in water at a neutral pH (Tarleton and Wakeman 2007). The particle size influences mainly adsorption kinetics as diffusion pathways are shorter in smaller particles. This effect has recently been exploited in applications using superfine powdered activated carbon (0.1 – 1 µm particle diameter) (Partlan et al. 2016). The accessibility of adsorption sites inside the porous structure is determined by the pore size distribution. Steric effects hinder molecules to enter pores that are smaller than the molecule diameter (Çeçen and Aktas 2012).
Nature of the adsorbate 2.2.1.2
The properties of the adsorbate such as molecular weight, hydrophobicity, polarity and aromaticity determine its interaction with PAC and have been discussed in various studies (Crittenden et al. 2012, Worch 2012). The affinity of adsorbates for PAC can differ very largely and competition for adsorption sites can occur by molecules of similar properties. Generally it has been found that PAC is most effective to remove non-polar, more hydrophobic, uncharged compounds that have a lower solubility and thus a higher affinity for the carbon surface than for water (Crittenden et al. 2012). Among molecules with similar affinity for PAC, the molecular weight (that determines the size) of the adsorbate determines the accessibility to the inner pore spaces of PAC (Crittenden et al. 2012).
Water matrix
2.2.1.3
The properties of the water matrix such as temperature, pH and ionic force influence the PAC surface chemistry as well as the properties of the adsorbate. In natural waters NOM reduces the removal efficiency of PAC for the organic target molecules such as organic MP due to competition effects. NOM is a complex multi-component mixture originating from natural as well as non-natural sources and its actual composition varies in waters of different geographical origin (Crittenden et al. 2012). It consists mainly of humic substances with a molecular weight between 500 and 3000 Da which corresponds to a size of < 10 nm. The size of NOM molecules is thus in the same range as PAC mesopores (2 nm < Ø < 50 nm) and one order of magnitude larger than organic MP (< 1 nm) (Crittenden et al. 2012). The different fractions of NOM, have different adsorbability and the competitive effect of NOM depends on their character and concentration (Çeçen and Aktas 2012). Mainly two competition mechanisms have been identified: direct competition with the target molecule for adsorption sites and/or pore blocking (Çeçen and Aktas 2012). Direct competition between NOM molecules and MP can be attributed to small NOM molecules with a molecular size that is similar to the target pollutant (Kovalova et al. 2013) as well as to the higher concentration of NOM (mg/L) compared to the organic MP (ng/L) (Çeçen and Aktas 2012, Worch 2012). The pore blocking phenomenon occurs when relatively large NOM molecules block the access to the pore system of PAC.
2.2.2 Isotherm and kinetic models
Adsorption equilibrium2.2.2.1
The following section gives an overview of the most common adsorption models. The intention is to set the foundation for the methods used in this thesis rather than to provide a complete review of existing models and theories.
The evaluation of pollutant adsorbability or the comparison of PAC performances is usually done in batch experiments at equilibrium state. Adsorption equilibrium is reached when the concentration of the adsorbate in the liquid phase is not changing anymore with time. The pollutant loading on a specific PAC in equilibrium is dependent on the adsorbate concentration and the temperature. This relation is described by an appropriate adsorption isotherm that is recorded at constant temperature (Worch 2012).
( ) Eq. 2.1 The loading of adsorbate on PAC in equilibrium qeq (e.g. in µg/mg) is obtained from the concentration difference between initial and final concentrations C0 and Ceq of the solute (µg/L), the known solute volume VL (L) and the known mass of adsorbent mPAC (mg/L):
. Eq. 2.2
The best known isotherm models describe single solute adsorption. Although in most applications in water treatment many solutes are present simultaneously, these models are sufficient to compare adsorbabilities of solutes or capacities of adsorbents (Worch 2012).
The Langmuir and the Freundlich models are the most frequently used. While the former is based on theoretical considerations, the latter is empirical (Crittenden et al. 2012).
The Langmuir model considers saturation of the adsorbent at high equilibrium concentrations (formation of a mono-layer on the adsorbent) and has the form:
, Eq. 2.3
where qm (same unit as the adsorbent loading qeq) and b (reciprocal unit of the concentration) are the isotherm parameters. The Freundlich isotherm – although empirical – shows often much better fit to experimental data with PAC (Worch 2012) and has the form:
, Eq. 2.4
where KF (unit depends on units of qeq and Ceq, e.g. µg/mg (µg/L)1/n) and n (unitless) are the isotherm parameters. The adsorption coefficient K characterizes the strength of adsorption and can be used to compare adsorption capacities if n-values of the respective models are similar. The exponent n determines the curvature of the isotherm. The lower the value n the more concave the isotherm and the more favourable the adsorption on PAC (Worch 2012).
Rate of adsorption 2.2.2.2
PAC applications such as taste and odour control often work at contact times much smaller than the time necessary to reach equilibrium. Adsorption kinetics describe the time dependence of the adsorption process until equilibrium is reached:
The kinetics of adsorption in porous materials such as PAC are determined by diffusion processes (external film diffusion and internal pore or surface diffusion). In experiments with high shaking velocities, external diffusion of the solute towards the PAC surface is not limiting and the mass transfer can be described by pore or surface diffusion models. The most frequently used model is the homogeneous surface diffusion model (HSDM) which describes the rate of surface loading change q with time t at any distance r from the PAC particle centre. The loading of the PAC particles, considered spherical and homogeneous, is described by the diffusion equation:
(
) , Eq. 2.6
with the initial condition:
at t = 0, 0 ≤ r ≤ R: q = 0, Eq. 2.7
and two boundary conditions :
at r = 0, t ≥ 0:
Eq. 2.8
at r = R, qs = KCeq1/n . Eq. 2.9
The surface diffusion coefficient Ds (m²/s) represents the rate of diffusion of the target compound along the surface of PAC (Najm 1996). As can be seen from Eq. 2.8 and Eq. 2.9 the loading rate in the center of the particle is zero and the solid concentration of the adsorbate at the outer surface of the particle (r = R) is in Freundlich equilibrium with the liquid adsorbate concentration
Ceq. To determine Ds from experimental data, batch tests can be carried out. For a batch reactor the HSDM can be expressed by combining Eq. 2.10 that describes the total mass Mt of adsorbent on the surface of all particles in the reactor (where CPAC is the PAC concentration and R is the particle radius) with a mass balance for a plug flow reactor (Najm 1996):
∫ , with initial condition at t = 0: C = C
0 Eq. 2.10 = ∫ Eq. 2.11
The resulting system of equation has been approximated by a nonlinear algebraic equation (Eq. 2.12) and can be solved iteratively for Ds by minimizing the sum of squared residuals between the model result and the measured kinetic data as described by Edzwald (2011):
0 = { – ( ) ( ) ( ) } . Eq. 2.12
Also reaction kinetic models are often used to describe adsorption kinetics for PAC despite the fact that they are not based on the well-known diffusion process that determines adsorption kinetics (Worch 2012). Rate kinetic equations were developed for chemical reaction kinetics and have no physical meaning for adsorption processes. However, they are simple to use and this makes them attractive as a tool to compare adsorbents.2 Most authors fit a pseudo-second order reaction kinetic model developed by Ho and McKay (1998) to their adsorption data as this model is applicable for low adsorbate concentrations (a common condition in drinking water treatment). This model is given by the following equation:
,
Eq. 2.13 where k2 (e.g. in mg/µg/min) is the kinetic constant. For higher concentrated contaminants such as NOM, the pseudo-first order model developed by Lagergren (1898) often fits experimental data:
, Eq. 2.14
where k1 (1/min) is the kinetic constant. After linearizing the equations of these two models, the constant can be determined using a linear regression with the experimental data (Ho and McKay 1998).
2 The reviewers of the article ―Influence of iron oxide nanoparticles upon the adsorption of organic matter on
MPAC‖ presented in Chapter 4 specifically asked to add reaction kinetic model results to the initially presented diffusion coefficients (HSDM result) in order to compare to other published studies. For MPAC, no other published study using the HSDM exists so far.
2.3 Theoretical background of magnetic separation
2.3.1 Magnetism and magnetic materials
In this chapter some fundamental principles of the phenomenon of magnetism are introduced since they are essential for the proper design of magnetic separation. The theory section is mainly based on Spaldin (2003) and Teja and Koh (2009) and the SI unit system is used.
Suspensions of magnetically susceptible particles can be separated applying a magnetic field. The necessary magnetic field, its gradient and process designs of the magnetic separator depend on the particle’s magnetic properties such as its magnetization in a magnetic field.
Magnetization within a magnetic field is a property of the material and depends on the individual magnetic dipole moments of the constituent elementary particles and how these moments interact and vary with the applied magnetic field and temperature (Spaldin 2003). The observed magnetic moments of a material arise from the spin and orbital angular moments of the electrons that circulate around the nucleus of an atom. The net or total angular moment of the electrons determine the magnetic moment of an atom (Spaldin 2003). Without going into the details of quantum mechanics, a short overview on different magnetic states is given in order to understand the interactions between magnetic particles and the magnetic field in particle separation.
In the case of ferro- or ferrimagnetic particles, separation is quite simple. These materials such as iron (and its oxides maghemite and magnetite), but also cobalt and nickel are strongly attracted by a magnetic field. On an atomic scale, this means that the intrinsic magnetic moments of the atoms are aligned parallel even without an external magnetic field below a critical temperature (Curie temperature). Characteristic for ferromagnetic materials is the formation of small regions of uniform alignment of the intrinsic magnetic moments (Weiss domains) that tend to minimize the total magnetic energy. When an external magnetic field is applied, the orientation of these domains is changed in such a way that they are aligned parallel to the applied magnetic field (Figure 2.2). Due to the parallel orientation, ferro- and ferromagnetic materials are likewise attracted by the South- and North Pole of the external magnet. The difference between ferro- and ferrimagnets is only ―visible‖ on a microscopic scale. In ferrimagnets the net magnetic moment results from two types of atoms with moments of different strengths that are arranged in an antiparallel fashion (Teja and Koh 2009). Most ferrimagnets are oxides such as magnetite (the
two atoms Fe2+ and Fe3+ lead to the opposing moments) whereas most ferromagnets are metals (Spaldin 2003).
Figure 2.2 : Orientation of the Weiss domains within a ferromagnetic material. The arrow indicates the direction of increasing strength of the applied magnetic field ⃑⃑ .
Another characteristic of ferro- and ferrimagnetic materials is the phenomenon of remanence. Magnetization of ferro- and ferrimagnetic materials increases with growing magnetic field strength until saturation but does not disappear completely when the magnetic field is removed. A certain magnetization ⃑⃑ R remains (Weiss domains remain aligned) leading to the so-called typical hysteresis loop (Figure 2.3a). The remaining magnetization can be removed by applying the opposite magnetic field. The magnitude of this opposing field ⃑⃑ C is called coercivity. The susceptibility χ, which is defined as the ratio of ⃑⃑ to ⃑⃑ indicates how responsive a material is to an applied magnetic field. The susceptibility is large and positive for ferro- and ferrimagnetic materials and a function of the applied field (Spaldin 2003).
If the size of ferro- or ferrimagnetic materials becomes very small, superparamagnetic effects dominate below the Curie temperature. In this regime, thermal fluctuations of the magnetization of each particles lead to a vanishing average magnetization, when no field is applied. Whenever magnetic fields are applied, the magnetization curve of superparamagnetic materials does thus not exhibit hysteresis (Teja and Koh 2009) which means that no remanent magnetization is present after the magnetic field is removed (Figure 2.3 b). This phenomenon makes these materials very attractive for several technical applications as superparamagnetic particles do not form agglomerates and can easily be redispersed in water when the magnetic field is removed. At a microscopic scale this can be explained with an energy approach. The number of Weiss domains decreases with decreasing length scale until a critical diameter below which only a single domain remains as it becomes energetically unfavourable to form domain walls (Spaldin 2003, Teja and Koh 2009, Westwood 1993). The energy required to align the direction of
magnetic moments is very low and in the order of thermal energy. In the absence of a magnetic field the magnetization can randomly change direction under the influence of thermal energy and thus the net magnetization averages zero (Spaldin 2003). IONP such as maghemite and magnetite with diameters smaller than about 20 nm display superparamagnetic behavior at room temperature (Teja and Koh 2009).
Figure 2.3 : a) Hysteresis curve for ferro- and ferromagnetic materials, b) Magnetization curve for superparamagnetic materials (taken from Spaldin, 2003).
Powdered activated carbon particles are not attracted by a magnet, they are diamagnetic – a magnetic state that exists in all components independently of other magnetic states. A diamagnetic material will exhibit an extremely weak magnetization that is antiparallel to the applied field. The susceptibility of diamagnetic materials is small and negative (Spaldin 2003). On a microscopic scale, this effect is due to a change in orbital motion of the electrons that is imposed by an applied magnetic field. This change in orbital motion takes place in all materials; however, this effect is very weak and is overshadowed in materials with stronger magnetic states such as ferri- and ferromagnetism (Spaldin 2003). Magnetic separation of PAC particles is therefore only possible, if the particles are seeded with magnetic particles. Then diamagnetic PAC becomes attractive to be separated from the likewise diamagnetic water.
2.3.2 Theory of magnetic separation
For efficient separation of magnetic particles from the surrounding water, magnetic forces that act on the particles and the field gradient ⃑⃑ are of paramount importance. Other forces such as the hydrodynamic drag force , gravity or inter-particle forces interact or
counteract magnetic separation. Effective separation requires a magnetic force that is higher than the sum of the counteracting forces (Jin et al. 2000).
The magnetic force (kg m/s2) that acts on a particle in a magnetic field can be written as:
⃑⃑ ⃑⃑ , Eq. 2.15
where µ0 (kg m/s²/A²) is the magnetic permeability in air, Vp is the particle volume and ⃑⃑ (A/m) is the magnetization of the particle in the applied field ⃑⃑ . The equation can also be expressed in terms of susceptibility of the particle χp (unitless) :
⃑⃑ ⃑⃑ . Eq. 2.16
Given that the susceptibility is a given material property, then the force can only be enhanced using stronger magnetic fields ⃑⃑ or/and by increasing the gradient ⃑⃑ ) or by increasing the particle volume e.g. by aggregation (Andreu et al. 2012).
Superparamagnetic particles are very small and thus have a small volume Vp which leads to a low magnetic force acting on the particles (Ohara et al. 2001). When employed in medical applications, the magnetic response of superparamagnetic particles is often enhanced by embedding the nanocrystals in a matrix of non-magnetic material to create larger particles (Andreu et al. 2012). With regard to MPAC the same principle applies as IONP are concentrated on the surface and in the pores of a non-magnetic PAC matrix.
The enhancement of the magnetic force through the use of stronger magnetic fields is limited for ferro- and ferrimagnetic or superparamagnetic particles such as magnetite or maghemite nanoparticles as they become saturated at relatively low magnetic fields. This means that the magnetization remains small even if the magnetic field is increased beyond the point of saturation and the magnetic force acting on ferromagnetic particles cannot increase (Ohara et al. 2001). In contrast to ferri- or ferromagnetic particles that exhibit a magnetic moment without external field, the magnetic moment in superparamagnetic particles has to be induced by an external magnetic field. The conditions for a magnetic field for the separation of superparamagnetic particles are twofold: (i) it has to be strong enough to generate the magnetic moment within the particle and thus a large magnetization and (ii) needs a magnetic gradient in order to produce a magnetic force on the particle (Andreu et al. 2012).