(will be inserted by the editor)
Characterising and Exploiting Workloads of Highly
Interactive Video-on-Demand
Andrew Brampton · Andrew MacQuire · Michael Fry · Idris A. Rai · Nicholas J. P. Race · Laurent Mathy
Abstract This paper presents a detailed character-isation of user behaviour for a series of interactive video experiments over a 12 month period, in which we served popular sporting and musical content. In ad-dition to generic VCR-like features, our custom-built Video-on-Demand application provides advanced inter-activity features such as bookmarking. The dramatic impact of such functionality on how users consume con-tent is studied and analysed. We discuss in detail how this user behaviour can be exploited by content dis-tributors to improve user experience. Specifically, we study how simple dynamic bookmark placement and interactivity-aware content pre-fetching and replication can reduce the impact of highly interactive media on CDN performance.
Keywords Interactive, Video-on-Demand, Sports, World Cup, Content Distribution
1 Introduction
In recent years the Internet has increasingly been used to distribute bandwidth-intensive streaming me-dia. Due to the resources required to deliver such con-tent, dedicated Content Distribution Networks (CDNs) are often used to improve the experience of end-users. As such systems evolve, users expect correspondingly improved interactive functionality, something which is increasingly difficult to achieve with diverse content
Andrew Brampton · Andrew MacQuire · Idris A. Rai · Nicholas J. P. Race · Laurent Mathy
Computing Department, Lancaster University, Lancaster, UK E-mail: {brampton,macquire,rai,race,laurent}
@comp.lancs.ac.uk Michael Fry
University of Sydney, Sydney, Australia E-mail: [email protected]
types exhibiting varied access patterns. In order to pro-vide a high quality of service, modern CDNs must there-fore be optimised to respond to user behaviour with regard to different content types.
In this paper, we study user behaviour for an in-teractive Video-on-Demand (VoD) system that serves users with a selection of content. Broadly, we served videos in the sporting and musical genres, with respec-tive examples being the entire 2006 FIFA World Cup and 2007 Eurovision Song Contest. A key distinguish-ing element of our work is that by usdistinguish-ing our own VoD system, we could offer novel interactive functionality beyond typical VCR-like features (i.e., the ability to pause, resume and skip back and forth within a given video stream). The prime example of this is bookmark-ing: direct links to points of interest within the video. An example of a bookmark within our sporting content could be a common event such the start of a match, or a potentially more popular event, such as a goal. Like-wise, in our musical content, we would typically book-mark the beginning of each distinct piece. Our system also allowed users to contribute their own bookmarks at any time, distinct from those added during the pub-lishing process.
Previous studies making use of entertainment con-tent have witnessed the classic start-to-finish playback model in their access patterns, with occasional VCR-like interactivity. In our experiments, however, user be-haviour proved highly dynamic. Users often chose to watch (and replay) small segments of the full video, in a complete departure from the start-to-finish model. The behaviour observed may also exist in other gen-res with popular highlight (e.g., educational, entertain-ment, news, etc.). While our scope is limited to sparsely accessed content, we feel our results are of interest and are relevant to significant new genres of on-line video content
We carried out a statistical analysis of the observed workload resulting from the dynamic user behaviour, and identified models, various metrics and workload properties. These models can be used to drive simu-lations of the type of interactivity behaviour studied in this paper. We also discuss how delivery networks can exploit the observed behaviour to improve user-perceived performance. For instance, we show that the order in which users view bookmarks can be predicted based on previous activity, enabling CDNs to leverage this data for performance gains. We also show how simple dynamic bookmark placement techniques and interactivity-aware content management techniques can improve CDN resource usage and performance.
The remainder of this paper is structured as follows: Section 2 reviews and discusses previous work on VoD workloads. Section 3 describes our experimental setup and methodology. Section 4 then analyses the traces we obtained during our trial period and discusses their significance. Section 5 presents and explores two sim-ple techniques content distribution networks can use to exploit the highly dynamic user behaviour found in our analysis, in order to improve both user satisfaction and resource usage. Finally, Section 6 concludes the paper with a brief summary of results and a discussion of fu-ture work.
2 Related Work
Much previous work on characterising user interaction has involved authors analysing real-world traces, usu-ally of at least one month in length. A commonly-used repository of such data is the Internet Traffic Archive (ITA) [8]. The ITA maintains a collection of both large and small-scale log files from a number of diverse sources; popular examples being the entire 1998 FIFA World Cup’s web server logs, or two months of logs from the NASA Kennedy Space Center in 1995. Unfortunately, many publicly available log files are sim-ilarly outdated. Although this may imply that they are likely to be well studied, it equally means they may not be suitable for characterising modern streaming access patterns with VCR-like interactivity. It is perhaps for this reason that many works in this field have instead made use of privately obtained data, often from large networks such as Akamai’s [2] or anonymous sources for non-disclosure reasons.
Despite this, many common trends are still observed amongst differing Video-on-Demand workloads, old and new. For instance, it is often found that only a small percentage of objects account for the majority of overall requests. Similarly, a small percentage of the requests often account for a large percentage of the overall data
transfer. Accordingly, numerous papers have therefore postulated that the popularity of objects follows a Zipf distribution [7, 13, 6, 12], although some have also indi-cated that this is not always the case [5, 1]. In terms of Video-on-Demand session arrivals several suitable (and often heavy-tailed) models have been suggested, e.g., the Poisson, Pareto and Exponential distributions etc. [3]. In general terms, it seems that access patterns depend highly on the nature of the content. Costa et al. highlighted this during their examination of four VoD workloads in three domains (education, entertain-ment video and entertainentertain-ment audio). For instance, the authors found that educational content was far more popular in the daytime on weekdays, whereas requests for entertainment-based content were more evenly dis-tributed across the entire week. They also note how a small yet significant fraction of users begin playback at arbitrary positions within the video, and issue an increasing number of requests in correlation with the video length. In terms of the requests issued, ‘pause’ was found to be, by far, the most common interaction. It was also noted that the probability of a given in-teraction was dependent on the type of the previous interactions, although the number of these actions was irrelevant [7].
Another common observation was that the popular-ity of media segments was either roughly uniformly dis-tributed or skewed towards the beginning of videos [7, 3]. This is a property of the start-to-finish playback model where users passively watch from the begin-ning to the end with little interactivity. Following from this, multiple authors have observed that a substan-tial percentage of media downloads are aborted before completion. Guo et al. suggest that this may be a re-sult of clients conducting “pseudo-streaming”; in other words, simply playing back a downloading video file as it arrives. The authors note that in comparison with real streaming, downloading/pseudo-streaming content is neither bandwidth efficient, nor performance effec-tive [10, 1].
The majority of previous work into characterising user behaviour in Video-on-Demand systems has con-sidered simple or VCR-like interactivity exclusively. The impact of newer interactivity features such as book-marking has not yet been considered to our knowledge. Accordingly, we designed our experiment to allow for the study of such effects, as discussed in the following section.
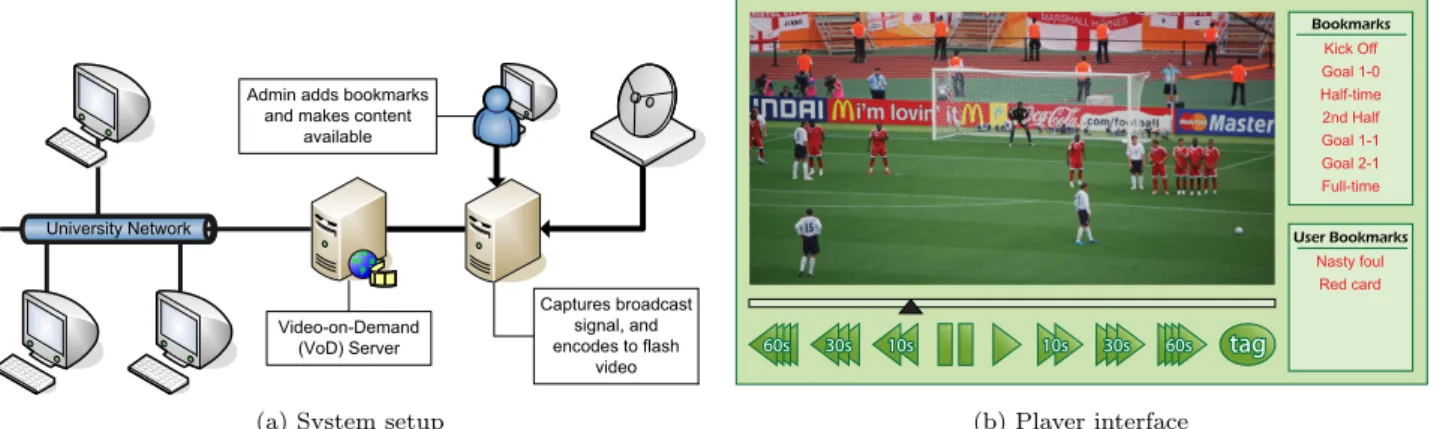
(a) System setup 10s 30s 60s 60s 30s 10s 10s 30s 60s 60s 30s 10s tagtag Kick Off Goal 1-0 Half-time 2nd Half Goal 1-1 Goal 2-1 Full-time Bookmarks User Bookmarks Nasty foul Red card (b) Player interface
Fig. 1: Video-On-Demand system diagrams
3 Experimental Setup
We set up a simple, interactive Video-on-Demand sys-tem1. The system was divided into three main compo-nents: the capture server, the Video-on-Demand server, and a web interface as depicted in Figure 1.
Our capture server recorded publicly-broadcast raw MPEG-2 streams of the programmes selected for our experiments. Once this process completed, the system transcoded the stream to high and low bitrate Macro-media Flash 7 FLV files (1 Mbps and 300 Kbps re-spectively). Administrators would then manually add metadata to the system describing the files as well as marking the location of key events within the videos. These locations are referred to as bookmarks, and typi-cally included events of interest. Within our sport con-tent, for example, goals, fouls and similar occurrences were bookmarked. The final FLV files were then trans-ferred to the VoD server, making them accessible to the users. The full procedure described typically took around twice the length of the recorded video, and so the videos were available shortly after being aired.
The VoD system was an Apache webserver, which served the Flash-based user interface over HTTP. This server was only accessible to staff and students within Lancaster University’s campus, and those staff and stu-dents connecting remotely via the university’s Virtual Private Network (VPN). To aid in logging, all requests made through the user interface were verbose, allowing us to determine exactly which controls users pressed and when. Additionally, each playback window would maintain a periodic (10 second) HTTP-request heart-beat with the server, which was used to determine when connectivity was unexpectedly lost.
1 More information about the system and its source code is
available at http://www.rcdn.org/
To handle user tracking, each user was assigned a unique session ID, which was stored within a HTTP cookie and their URLs. Each event that was logged contained this identifier, allowing us to track individ-ual users throughout their visit to the site. If, however, a user blocked or deleted their cookie, they would ap-pear to be new to the system upon each visit. We note within our analysis where this uncertainty could affect the results.
The web interface consisted of two main sections: an index page allowing the user to select any available video from the system, and the player interface that displayed the video (as shown in Figure 1b). We were aware that the user interface would constrain the users’ actions somewhat, and it was therefore designed to be as simple and generic as possible. Forward and back-ward buttons were provided that allowed seeking 10, 30 and 60 seconds in either direction. As these are rela-tively short distances, we also provided a seek bar which enabled users to seek to any arbitrarily chosen time. Fi-nally, a list of bookmarks was displayed to the users, which enabled them to jump directly to key events. Bookmarks were added by an administrator, but later the interface was extended to also allow users to submit their own bookmarks (via the tag button), which other users could see and use. User bookmarks often covered events that were not typically bookmarked, but were of particular interest (such as events that came under later scrutiny).
3.1 Content
We ran our experiments in two phases, firstly cover-ing the 2006 FIFA World Cup and nine months later a wider range of sport and musical events. The con-tent selections were chosen because they had points of
interest to bookmark, and would yield sufficient user demand.
The first experiment made available a total of 66 matches from the World Cup (64 from the event it-self, and 2 pre-competition friendlies) starting from the 9th of June 2006. Only results after the 13th of June
were analysed due to alterations made to the logging system and user interface before that date. Each match was recorded from the beginning of the pre-match com-mentary through to the end of coverage, and at the very least every goal, penalty, and match start/end-point (inclusive of half-time) was bookmarked.
From the 13thof April 2007 we began covering new
content as part of a second experimental study. This time, our approach was designed to test various auto-nomic management techniques, and to revalidate our previous experimental results. Furthermore, we wished to determine the relevance of our analysis/models to other genres (such as music). Over the following two months we covered the last six matches from the 2007 UEFA Champions League football tournament, some other miscellaneous football matches, seven Formula 1 races, as well as several recordings from music chan-nels and the 2007 Eurovision Song Contest semi-final and final. The football matches were bookmarked in the same manner as the previous World Cup event. In the Formula 1 content we bookmarked the beginning and end of the race, as well as any noteworthy events such as a driver having to retire (after a crash or technical difficulties). Within the musical content the beginning of each track was bookmarked with its corresponding artist and title. A similar approach was taken with the Eurovision Song Contest, where the beginning of each song was bookmarked with the name of the country taking part.
In total there were 88 videos, each video on average was 2.5 hours in length with a standard deviation of 30 minutes. The maximum video length was 4 hours, and the minimum length 45 minutes. There were 695 bookmarks, with each video having on average 7.8.
4 Analysis
In this section, we use traces from our system to char-acterise user behaviour and the resulting workload. Us-ing a combination of R-Square fittUs-ing and Kolmogorov-Smirnov Tests, models for the various features were de-termined. Aggregated results are shown when applica-ble, but in some cases it is more appropriate to show results for individual videos. We noted in many cases the features analysed were similar for each video, so for simplicity we will specifically discuss two individ-ual videos in greater detail: the World Cup’s Argentina
vs. Serbia and Montenegro match, and the Eurovision Song Contest final. Both were amongst the top 5 most popular videos and were representative of their genres (namely sport and music). We will refer to these files as arg-scg and eurovision respectively.
Throughout the two experiments we observed a to-tal of 1800 unique users to the site, with each video receiving on average 68.2 unique users (and an overall maximum of 383). During this period we served 925 hours of video, which equates to 3.3 terabits of data. We received an average demand of 287±31 requests per day, with Thursday being the most popular. Through-out the day we saw the typical diurnal sinusoidal access patterns averaging 12 ± 10 requests per hour, reaching its peak at midday with an average demand of 29 re-quests per hour.
We witnessed 123 unique users for arg-scg, and 131 unique users for eurovision, who watched for a com-bined total of 29.1 hours and 79.6 hours respectively. Note that if an individual does not maintain the same HTTP cookie between sessions (e.g., their cookie is deleted) they will appear as a new unique user. Equally, if two individuals share the same cookie, they will ap-pear as a single unique user. While we expect these cases to be rare, they may however introduce error into the unique user count.
4.1 Interactions
Recall that our system allowed various interactive oper-ations, namely pausing, resuming, seeking forwards & backwards, and jumping to bookmarks. This range of operations, combined with the nature of the content, highly influenced user behaviour. As a result, for most users we observed a complete departure from the typi-cal start-to-finish playback model that has been noted in previous work [7].
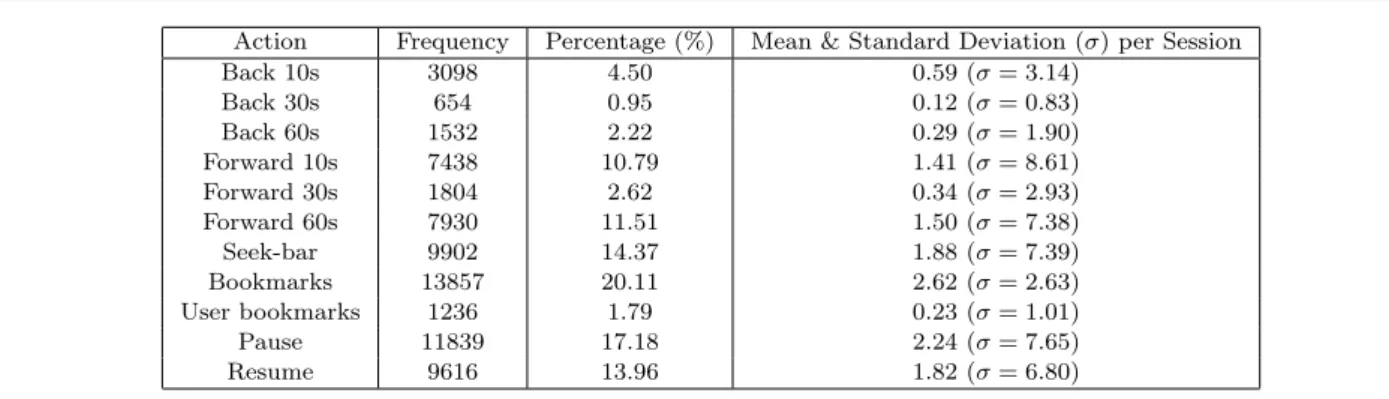
Table 1 shows, over the duration of the experi-ment, the frequency of each action and its correspond-ing percentage against all other operations. Small for-ward seeks were used a combined 24.9% of the time, whereas backward seeking was only used 7.67%. These actions only accounted for the relatively small seeks (10, 30, and 60 seconds), whereas potentially large seeks (seek-bar and following bookmarks) made up 34.5% of all operations. The table also shows that in each ses-sion (a viewing of a single video), a user on average used backward actions once, bookmarks and seek bar actions 4.5 times, and forward actions 3.25 times.
Previous studies have shown that the most common action is pause/resume [7], however we see that for our traces, forward operations are by far the most common,
Action Frequency Percentage (%) Mean & Standard Deviation (σ) per Session Back 10s 3098 4.50 0.59 (σ = 3.14) Back 30s 654 0.95 0.12 (σ = 0.83) Back 60s 1532 2.22 0.29 (σ = 1.90) Forward 10s 7438 10.79 1.41 (σ = 8.61) Forward 30s 1804 2.62 0.34 (σ = 2.93) Forward 60s 7930 11.51 1.50 (σ = 7.38) Seek-bar 9902 14.37 1.88 (σ = 7.39) Bookmarks 13857 20.11 2.62 (σ = 2.63) User bookmarks 1236 1.79 0.23 (σ = 1.01) Pause 11839 17.18 2.24 (σ = 7.65) Resume 9616 13.96 1.82 (σ = 6.80)
Table 1: Interactions observed throughout the experiment
closely followed by seeking to bookmarks. The table also shows that the number of pause operations account for 17.18% of all actions. Pausing not being the most common action can be explained by the short session durations observed. This is in accordance with previous work which found a positive correlation between session time and the number of pause operations [14].
To better understand how users navigated through a bookmarked video, we analysed the behaviour in the arg-scg and eurovision videos, which had 10 and 24 bookmarks respectively. In Figures 2a & 2b each point is a seek that is identified by a “from” time on the x-axis and a “to” time on the y-axis. A point x, y therefore represents a user that has jumped from their current playback point x to a new point, y. Vertical and hor-izontal lines in the figures denote the position of the bookmarks. The diagonal line is a current-time marker such that seeks forward are points which lie above it, while seeks backward appear below it. Therefore, no point can fall precisely on the diagonal. It is immedi-ately obvious from the figures that many points are on horizontal lines, implying that most seeks were to the bookmarks.
The forward seek buttons appear to have been mostly used for skipping to the next event, shown on both figures as points slightly above the diagonal line between the bookmarks. This could be due to user unfa-miliarity with the bookmark interface, or possibly users simply browsing the video. Backward actions were typ-ically used around bookmarks, where users would often re-watch the bookmarked event. In some cases users may also have wished to see video immediately preced-ing the bookmark. An example of this is shown in Fig-ure 2a before the bookmark at time 2815, where users sought up to 75 seconds backwards to see more of the build up to the goal.
Clusters of points can also be seen on horizontal lines shortly after a vertical line, indicating that users jumped from bookmark to bookmark. In fact, the con-centration of clusters of point just above the diagonal
time reference indicates that users have a tendency to follow bookmarks in sequence, as exemplified in Fig-ure 2b.
Overall, for both videos these results demonstrate that users did not simply view continuously start-to-finish, and were in fact highly influenced when pre-sented with bookmarks.
4.2 Seek Distance
The understanding of locality is important for caching and pre-fetching algorithms. By looking at how far users sought we can determine the probability of ac-cessing media nearby the playback point. We therefore define seek distance as the absolute difference, in sec-onds, between a user’s current playback point and their requested seek destination.
Figures 3a & 3b display a CDF of seek distance for backward and forward actions. A large proportion of seeks (between 50%-70%) are of a 15 seconds, 30 seconds, or 60 seconds values. These seeks represent the short seek button presses. 40% of backward seeks were less than or equal to 15 seconds in length. This property could be exploited by keeping a small client side buffer of previously watched segments, which would satisfy many backward seeks if the user has already viewed them.
Even though small seeks are the majority, there are between 30% and 50% of seeks which are further than 60 seconds. These seeks consist of jumps to bookmarks or “blind” seeks with the seekbar. These long range seeks are log-normally distributed with a mean of 1968 seconds and 1630 seconds for forward and backward seeks respectively. They can be fitted to log-normal models with parameters µ = 6.8269 and σ = 1.5953 for forward seeks, and µ = 6.3273 and σ = 1.7906 for backward seeks. It can been seen that the backward dis-tribution has a greater positive skew than the forward distribution, thus it will generate many small seeks.
0 1000 2000 3000 4000 5000 6000 7000 8000 0 1000 2000 3000 4000 5000 6000 7000 8000 To time (seconds)
From time (seconds) Jump forward
Jump back
(a) Argentina vs. Serbia and Montenegro
0 500 1000 1500 2000 2500 3000 3500 4000 0 500 1000 1500 2000 2500 3000 3500 4000 To time (seconds)
From time (seconds) Jump forward
Jump back
(b) Eurovision (cropped at 4000 seconds for clarity)
Fig. 2: Jumps made by users within two videos
0 0.1 0.2 0.3 0.4 0.5 0.6 0.7 0.8 0.9 1 0 20 40 60 80 100 120 140 160 180 200 CDF
Seek Distance (seconds) Forward Seeks Backward Seeks
(a) Small scale
0 0.1 0.2 0.3 0.4 0.5 0.6 0.7 0.8 0.9 1 0 2000 4000 6000 8000 10000 12000 14000 CDF
Seek Distance (seconds) Forward Seeks Backward Seeks
(b) Large scale
Fig. 3: CDF of seek distance
These behaviours exhibit a high degree of spatial locality, with the majority of seeks being within 60 seconds. Regarding long-ranged seeks, the log-normally distributed models imply that some very large distance seeks do occur, but the majority of seeks are shorter. Overall the seek distances exhibit a median of 60 sec-onds for forward seeks and 34 secsec-onds for backward seeks.
4.3 Popularity
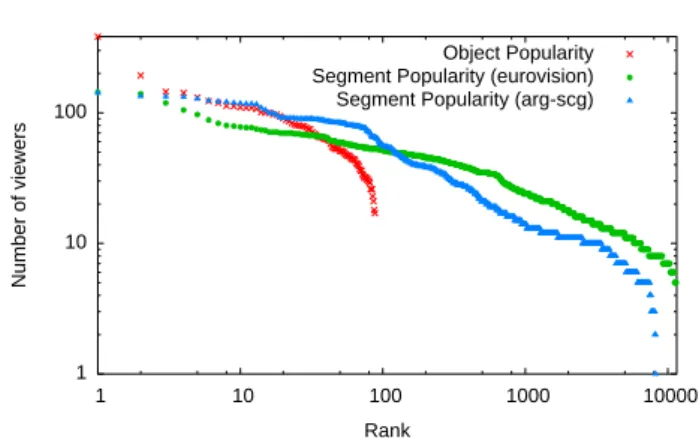
We study popularity in terms of the number of viewers who watched an object or a segment. An object in our system is a single video whereas a segment is a section of video one second in length.
The ranking for both object and segment popularity is shown in Figure 4. The eurovision, and arg-scg were approximately 10,000 seconds in length, causing 10,000 segments to be ranked for each video. Recall that only
88 videos were available, so the lowest object rank is 88. Our analysis reveals that object popularity does not fol-low the typical power-law distribution observed within CDNs [6, 3, 15] but instead is a normal distribution with parameters µ = 60 and σ = 32. This can be attributed to the nature of our videos and the relatively few new objects each day.
The popularity of one-second segments for all the videos exhibit a Weibull distribution with parameters λ = 2.887 and k = 0.69527. Log-normal distributions provide the best fits for the arg-scg and eurovision re-sults independently with parameters µ = 2.00, σ = 0.587 and µ = 2.32, σ = 0.567 respectively. Note that log-normal and Weibull distributions closely relate to power-law or heavy-tailed distributions [11, 9]: they are skewed distributions where a small percentage of sam-ples contributes to a sizeable weight of their distribu-tion. We observe that a small percentage, (the 10% most popular segments), accounted for about 44% of all requests. Previously, Costa et al. [7] found that for
1 10 100 1 10 100 1000 10000 Number of viewers Rank Object Popularity Segment Popularity (eurovision) Segment Popularity (arg-scg)
Fig. 4: Object and segment popularity
ucational and entertainment content, the popularity of segments is roughly uniformly distributed with a slight skew towards the beginning for entertainment content. Our result, however, implies that there are segments with orders of magnitude more viewers than others.
To illustrate the order-of-magnitude differences in viewers, we present Figures 5a & 5b which show the popularity of each second of video for arg-scg and eu-rovision respectively. The vertical lines signify the po-sition of the bookmarks; note for the eurovision video there were no bookmarks after 6000 seconds since the performances bookmarked were only in the first half. It is clear from the figures that there are peaks of popu-larity, highly influenced by the bookmarks. In arg-scg (and in other sport content) we observe that most of the bookmarks are equally popular. However, in the eurovision (and other music genres), we observe there is a greater variance in the popularity of the book-marks. This can be attributed to sports having numer-ous events which all users wish to watch, however in music videos there may be only certain artists which interest the user.
Popularity metrics are important to many CDN gorithms as they help to decide which resources to al-locate to each object. We have seen that bookmarked videos provide a content format with specific segments of interest (goals, for example). This result emphasises the use of partial caching techniques [4] to cache only popular segments.
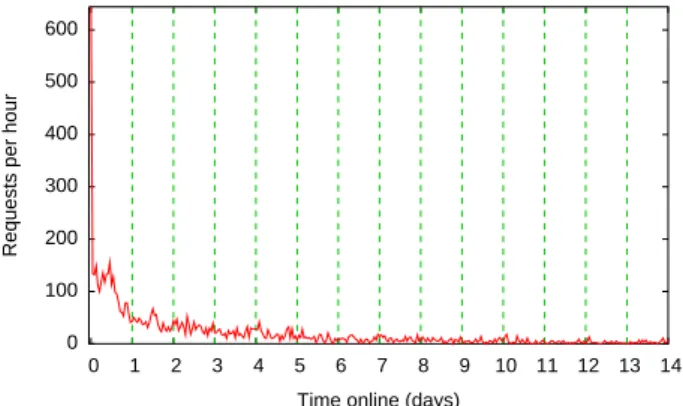
4.4 Longevity
The popularity of both videos and bookmarks in our system faded over time. We call the duration at which any such item remains utilised its longevity. The study of a video or bookmark’s longevity can aid cache
re-placement policies, as well as other content manage-ment decisions.
Figure 6 shows the popularity of all our bookmarks versus the time they were first used. The figure suggests that following an initial peak and a slight resurgence, there was a rapid decrease in interest after a short period. R-Square fitting reveals that the bookmark longevity can be suitably estimated using a Weibull dis-tribution with λ = 3.10 and k = 0.615. This suggests that the popularity exhibits long-tailed properties. We also observe that 40% of the bookmark usage occurs within 24 hours, with the remainder slowly occurring over the following weeks.
The popularity of videos decreased over time, but this is not true for the popularity of segments within the videos. The segments which were popular when the video was first published were still popular within the video weeks later, long after the video had lost popu-larity. This was tested on each video by calculating the distribution of segment popularity for the first 50% of requests versus the last 50% of requests. The difference in distributions was minor, with an average R-Square value of 0.9. On a visual inspection of the number of viewers per second, it was clear that the popularity still focused around the bookmarks.
4.5 Session Lengths
Session length is the total time a user accessed a video, regardless of the actions they may have taken whilst doing so. For example, a session may be longer than the actual length of the video if the user chose to re-watch segments, and/or pause.
Figures 7a & 7b show the CDF of both session and inter-seek times (discussion of inter-seek times follows in the next subsection). It can be observed from the ses-sion times that most users access each video for a very short time relative to its overall length (possibly just watching the events they are interested in). In particu-lar, note that in the arg-scg case around 80% of sessions lasted less than 15 minutes. Given that the video was 2.2 hours in length, 15 minutes corresponds to only 11% of the total video. A similar result was found with eu-rovision, with 80% of sessions lasting less than 12% of the total video duration. The average session duration was found to be only 11 minutes and 18 minutes for arg-scg and eurovision respectively.
We also found that a small minority (roughly 3%) of session durations were longer than the length of a video. Of these durations roughly 39% were between 3 to 8 hours long. Our logs show that these users paused for a long time before deciding to resume playback.
0 20 40 60 80 100 0 1000 2000 3000 4000 5000 6000 7000 8000 Viewers Time (seconds) Kick Off Goal Goal Goal Half-time 2nd half Goal Goal Goal Time
(a) Argentina vs. Serbia and Montenegro
0 20 40 60 80 100 120 140 0 2000 4000 6000 8000 10000 Viewers Time (seconds) (b) Eurovision
Fig. 5: Number of viewers at each second of video (each vertical line represents the position of a bookmark)
0 100 200 300 400 500 600 0 1 2 3 4 5 6 7 8 9 10 11 12 13 14
Requests per hour
Time online (days)
Fig. 6: Bookmark utilisation over time, following initial usage
4.6 Inter-seek Times
Inter-seek time is described as the duration for which a user watched a section of a video before seeking to a new location (disregarding any paused periods). This can be useful, for example, to determine the amount to replicate when using partial caching.
From our logs, we found that on average a user per-formed 8.98 seek operations around a video, resulting in a mean inter-seek time of 50.4 seconds. Figures 7a & 7b show the CDF for inter-seek times as well as session length. As the inter-seek times are generally shorter than session times, this implies that the majority of users viewed the content as a series of excerpts, usually under a minute in length.
The inter-seek time in the music content was found to be on average longer. This is because the length of a bookmarked musical performance generally exceeds the length of an event within a football match. Regardless of the difference in inter-seek times, we found that they
can be estimated by log-normal distributions. For in-stance, the inter-seek time for arg-scg can be modelled with parameters µ = 2.15 and σ = 1.72.
Previous studies have found that the majority of inter-seek times are very short [14]. For educational content, inter-seek times have also been shown to be Poisson or Pareto distributed [3]. We however found only two thirds of our videos had inter-seek times that could be suitably modelled by a Pareto distribution, and none that could be modelled well with a Poisson distribution. Models of inter-seek times can be used by a delivery system to determine the size of video repli-cas and the time available to react before a user seeks elsewhere in the video.
4.7 Sequence
The traces were analysed to study the extent to which users’ actions could be predicted. Since jumps to book-marks made up a relatively large percentage of all re-quests, we limit this prediction to which bookmark will be visited next. If a system could predict which book-mark would be requested next by a user, then it could pro-actively respond in order to optimise content de-livery. For example, based on the next predicted book-mark, the relevant segments could be pushed out by a server with spare capacity, or pre-fetched by a client.
We call the order that bookmarks are viewed by a single user a sequence of bookmarks. Every user’s se-quence can be aggregated together to form a directed graph. Each node in the graph represents a bookmark with links between them representing the probability of seeking to that bookmark next. Figure 8 shows a sec-tion of one of these directed graphs depicted as a tree for clarity. The “Start” node represents the beginning
0 0.2 0.4 0.6 0.8 1 1 10 100 1000 10000 CDF Time (seconds) Inter-seek times Session times (a) Eurovision 0 0.2 0.4 0.6 0.8 1 1 10 100 1000 10000 CDF Time (seconds) Inter-seek times Session times
(b) Argentina vs. Serbia and Montenegro
Fig. 7: CDFs of session lengths and inter-seek times
44.2 15.6 11.7 6.5 5.8 16.2
80.0 11.8 8.2 50.0 37.5 6.3 6.3
63.6 14.1 12.1 10.1
75.0 17.1 7.9 Start
Goal 1-0 Unknown Goal 2-0 Kick Off End 7 Others
Goal 2-0 Unknown 7 Others Unknown Goal 1-0 Goal 2-0 Start
Goal 3-0 Unknown End 7 Others
Goal 4-0 Half-time 7 Others
Fig. 8: Sequence diagram for Argentina vs. Serbia and Montenegro depicted as a tree
of the video, and the “End” node represents the com-pletion of a session. There is also an “Unknown” node which signifies when a seek to another bookmark has not been made within 200 seconds of visiting the pre-vious bookmark (the observed upper bound for book-marked events’ length). For clarity, links with low prob-abilities have also been aggregated to form a “N Oth-ers” node, where N is the number of aggregated links. It is clear from the figure that there are multiple choices to visit from each node, although there is gen-erally one link that is significantly more likely to be chosen. For example, the probability of viewing book-mark “Goal 2-0” immediately after “Goal 1-0” is 80%. We can also see that following the “Kick Off” bookmark 50% of users did not visit another bookmark within 200 seconds and instead continue to watch, this could indi-cate that this subset of users were interested in watch-ing the full game instead of just the highlights. An in-teresting observation for caching is the occurrence of self-loops. 6% of links were between the same two book-marks, which made up 6.5% of all requests.
0 0.1 0.2 0.3 0.4 0.5 0.6 0.7 0.8 0.9 1 0 20 40 60 80 100 CDF
Sequence Graph Link Probability (%) All links Most popular link from each state
Fig. 9: CDF of link probabilities for all videos
To understand how many bookmark-to-bookmark links are predictable, Figure 9 shows a CDF of proba-bilities for all links for all videos, as well as probabili-ties for just the most popular link from each bookmark. From this figure we can conclude that 10% of all links have more than a 58% chance of being followed. Look-ing at just the most popular link from each bookmark we observe that over half of the bookmarks have an out-going link with a probability over 50%; an encouraging result for user predictability.
In this analysis we assumed that all users will visit the bookmark in similar order, however in a large het-erogeneous environment this may not be true. Different sub-groups may wish to view a different set of events possibly in a different order to other sub-groups. Across our videos we did try and identify if there were groups of individuals that behaved differently to the majority, however none were found. This could possibly be due to our genre of media, with all sports fans wishing to see the same events, in the natural sequential order.
0 0.2 0.4 0.6 0.8 1 0 20 40 60 80 100 120 140 160 180 CDF
Wait time (seconds)
Start Goal 2-0 Goal 1-0 Goal 5-0 Goal 4-0 Goal 3-0
(a) Argentina vs. Serbia and Montenegro
0 0.2 0.4 0.6 0.8 1 0 20 40 60 80 100 120 140 160 180 CDF
Wait time (seconds)
Start United Kingdom Serbia Finland Russia Ireland Ukraine (b) Eurovision
Fig. 10: CDFs of wait times
4.8 Hotspot Length
Jumps to bookmarks comprised roughly 20% of all re-quests with an additional 32% of seeks being within 60 seconds of a bookmark. Bookmarks form the majority of requests within the content, and represent the be-ginning of a popular segment of video which we call a hotspot. The beginning of a hotspot is generally known (i.e., the bookmark point), but the end is not. Knowing the length of the hotspot can be useful for numerous tasks such as caching and pre-fetching. We therefore define wait time as the time elapsed between a user following a bookmark and seeking.
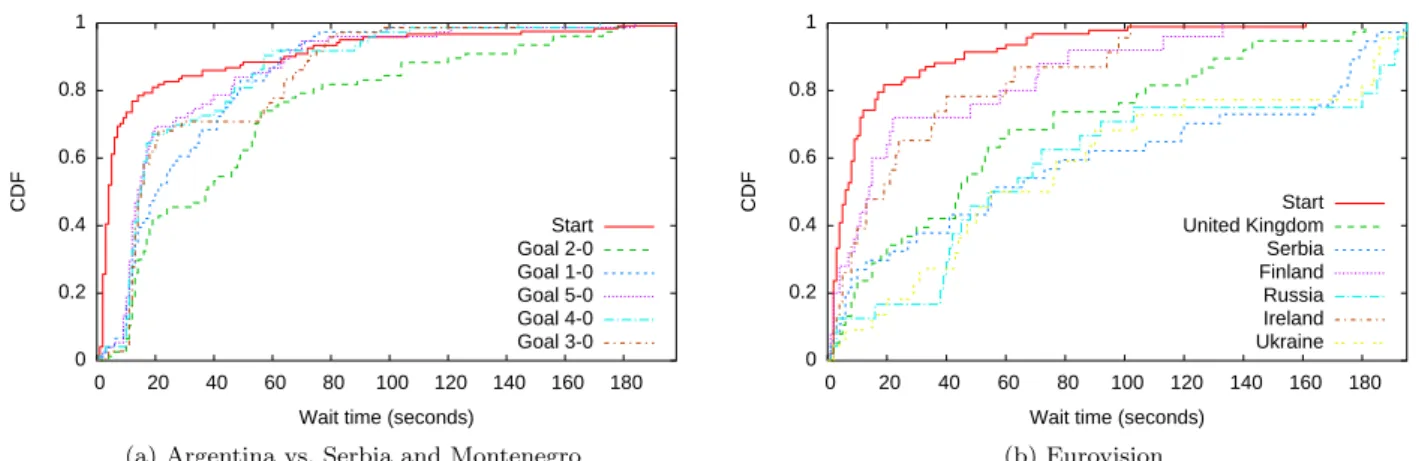
Figures 10a & 10b show a CDF of wait times for each bookmark in the arg-scg and eurovision videos. It can be seen that in the football match the wait times follow a similar distribution, with the majority of users waiting less than 40 seconds (this, for example, could corresponds to the length of a run up to a goal). The eurovision results are more varied with average wait times being much longer. This is due to the typical song in the Eurovision Song Contest being 180 seconds in length. Finally, there is a “Start” bookmark listed in both figures: this is the entry point into both videos, and does not correspond to any event.
To better understand the wait times, distributions were fitted. In the general aggregated case a Weibull model fits best with parameters λ = 24.594 and k = 0.7034. For individual bookmarks log-normal and Weibull models proved best in the majority of cases. With these models the upper bound of a hotspots’ lengths can be extrapolated by using, for example, the 95thpercentile.
4.9 User Behaviour Models
Model fitting is important for understanding the dif-ferent properties of the system, and aids in simulation creation and algorithmic design. Various models have been discussed for the different parameters of the sys-tem. In all cases many models (e.g., normal, log-normal, exponential, Weibull, Pareto, Poisson, Zipf) were fitted to the data with varying success. Generally, more than one distribution fitted well. This subsection will sum-marise the analytical models found for each parameter. Table 2 gives an overview of the best matching mod-els for each metric discussed previously, with their cor-responding R-square values. Of particular importance are the types of distribution which can have a signifi-cant impact on the system. For example, the Weibull and log-normal models are both long-tailed, and sys-tems may have to anticipate the skewed distribution to cope effectively.
The models shown so far are from aggregated results across all the videos. Instead, it may be interesting to model the different metrics of each particular video. However due to the diversity in models and parameters it is not possible to show each model, so instead Ta-ble 3 summaries which models fit with a R-square value greater than 95%. The “max models” column represents the number of datasets that are of sufficient size to have models fitted. For example, there are 695 bookmarks, yet only 203 had enough data to be fitted to a hotspot length, and of these, 165 fitted well to a Log-normal model, 135 to a Weibull models, etc.
4.10 Summary
Our results have shown that the interactivity options available to users highly influence their behaviour. In
Metric Distribution R-square
Object Popularity Normal ( µ = 60.129 , σ = 32.111 ) 0.97996
Segment Popularity Log-normal ( µ = 0.551 , σ = 1.32 ) 0.98084
Weibull ( λ = 2.887 , k = 0.69527 ) 0.98284
Session Length Log-normal ( µ = 4.73, σ = 1.90 ) 0.99779
Weibull ( λ = 233.17, k = 0.51125 ) 0.98666
Inter-seek times Log-normal ( µ = 1.2886, σ = 2.318 ) 0.99644
Weibull ( λ = 7.5243, k = 0.35646 ) 0.99353 Seek Distance (forward) Log-normal ( µ = 7.2668, σ = 1.2194 ) 0.99567 Seek Distance (backward) Log-normal ( µ = 7.195, σ = 1.3132 ) 0.99083
Hotspot Length Log-normal ( µ = 2.6361, σ = 1.388 ) 0.98463
Weibull ( λ = 24.594 , k = 0.7034 ) 0.99545
Bookmark Longevity Weibull ( λ = 3.1004 , k = 0.61592 ) 0.99796
Table 2: A summary of metrics with their corresponding distributions
Metric Max Models Log-normal Weibull Pareto Normal Exponential Zipf No fit
Segment Popularity 84 (from 88 videos) 61 65 12 58 42 13 17
Session Length 81 (from 88 videos) 75 72 0 5 31 4 0
Inter-seek times 87 (from 88 videos) 83 83 54 1 3 55 3
Hotspot Length 203 (from 695 bookmarks) 165 135 91 5 48 53 22
Table 3: Metrics for individual videos and their corresponding distributions
particular, it was found that the novel interactive fea-ture of bookmarking played a pivotal role, leading to access patterns quite dissimilar from previous related studies that looked at VCR-like interactivity alone. The combination of our content type and the addition of bookmarks led to users accessing content in rela-tively short segments sparsely distributed throughout the length of the videos. Segment popularity is skewed with the most popular segments clearly around the bookmarks, forming hotspots. From both a user and a CDN’s perspective, this can be viewed as advanta-geous; users can reach interesting content more quickly through the bookmarks, and the increased locality of interest means CDNs can respond more effectively by, for example, prioritising hotspot replication.
Content placement is an important and difficult problem for CDNs. The CDN has to decide where within the network to replicate or cache content. Typi-cally the content is placed near to the users, and repli-cated as a whole. However, as we have seen, not all segments within a piece of content are equal and a CDN can leverage this information to replicate cer-tain segments more than others. This is especially use-ful when popularity nearly always concentrates around bookmarks, allowing the relevant segments to be repli-cated throughout the network before user demand in-creases.
A CDN could be designed to handle high levels of user interactivity, with relatively short sessions and inter-seek times. Our results have shown that hotspots following bookmarks were orders of magnitude shorter than the video containing them. Furthermore, it en-courages the use of an agile delivery mechanism that
al-lows distribution of small sparsely distributed segments quickly and efficiently.
We have also shown that users view the bookmarks in a similar order, giving them a degree of predictabil-ity. This could allow a CDN to exploit pre-fetching tech-niques to improve the user’s experience. For example, if the CDN could predict the next segment the user will watch, then this could be pre-fetched into the user’s playback buffer and when the user seeks to that seg-ment there will be no delay caused by seek latency and buffering.
The use of bookmarks depends on them being well positioned and of interest to the user. We noted in the first experiment that 40% of bookmarks had at least one user seek before the bookmark, with 30.7% of these seeks occurring within 5 seconds of jumping to the bookmark. This perhaps represents users who were almost immediately dissatisfied with the bookmark’s lo-cation. We noted this happened consistently for roughly 6% of the total bookmarks. Upon further inspection, it appeared the bookmarks were inadvertently misplaced. This led to users performing additional seeks to find the correct location, thus placing extra load on the servers. In Section 5, we explore and study the implications of two techniques designed to exploit some of the prop-erties suggested from our analysis.
5 Techniques for Interactivity Support
During our second video trial, we took the opportunity to go beyond characterising user behaviour, by test-ing autonomic content management techniques in a live system. In this section we discuss and analyse a simple
Scenario A
1. Jumps to Bt 2. Watches for w
3. Seeks to St(St< Bt)
Scenario B
1. Jumps to Bt 2. Watches for w
3. Seeks to St(Bt< St< Bt+ w)
Scenario C
1. Jumps to Bt 2. Watches for w
3. Seeks to St (St> Bt+ w)
Fig. 11: Different scenarios that may induce bookmark movement
dynamic bookmark placement technique, as well as an interactivity-aware content pre-fetching method based on the prediction of which bookmark would be viewed next.
5.1 Moving Bookmarks
During our video trials, bookmarks were appropriately positioned by administrators before the video was pub-lished. It was previously noted that a small percentage of bookmarks were unintentionally misplaced. There are many reasons why a bookmark could be misplaced, such as human error, or a lack of insight into user re-quirements. For example: a bookmark could be placed before a penalty kick, but many users may first wish to see the foul that led to the penalty. As such, it could be beneficial if the system could autonomically detect poorly placed bookmarks and correct them based on feedback derived from the user’s actions.
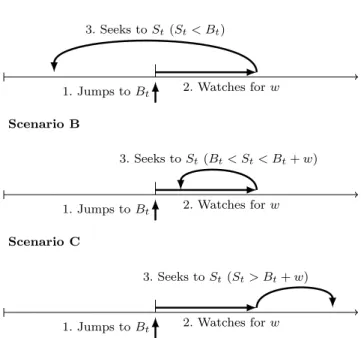
To develop a reactive algorithm that moves book-marks dependent on user behaviour, different possible scenarios should first be explained. Figure 11 shows three different sequences of actions a user would follow shortly after seeking to a bookmark.
Scenario A shows the user briefly viewing the book-mark, then seeking to a time earlier than it. While this could indicate that the bookmarked event was short and that the user wanted to view it again, it could
equally imply that the bookmark was placed later than it should have been.
Scenario B is similar to Scenario A but differs in that the user does not seek back to a point before the bookmark; this means the user is simply replay-ing footage, thus implyreplay-ing the bookmark is correctly placed for that individual.
Scenario C represents a situation in which the user’s motives are difficult to determine. Since they watch briefly then seek forward, several possibilities exist: the bookmarked event may have ended, the bookmark may have been placed prematurely, or the user is simply seeking forward towards the next event.
A further possibility, not shown in the figure, is for a user to seek far away from a bookmark in either di-rection. Since it is unlikely their destination would be related to the bookmark, such an action would not in-dicate the bookmark was incorrectly placed.
Scenario A and Scenario C are therefore the only scenarios where the user’s actions could indicate the bookmark is misplaced. All other actions should rein-force the position of the bookmark to reduce future movements once it is correctly placed. Additionally since we are less sure of the user’s intentions in Scenario C we should only make minor changes to the book-mark’s placement to limit the impact of false-positives. Algorithm 1 has been developed to identify these situations and act appropriately with regard to moving a bookmark. An exponential moving average (EMA) is used to recalculate the bookmark’s position with a smoothing constant α. The value used for α is depen-dent on the idepen-dentified scenario. Initially these values were 0.1 and 0.05 allowing us to place greater con-fidence in the seeking-backward Scenario A than the seeking-forward Scenario C. These values were chosen as the intuitive first guesses for experimental purposes, and should be refined with future experiments. For our testing scenario we also used maximum wait times of 20 and 60 seconds for backward and forward seeks re-spectively. These maximum values were chosen because they exceeded approximately 80% of all wait times.
To test this algorithm, several of the bookmarks in our second video trial (not our initial World Cup experiment) were deliberately misplaced by different amounts before they appeared on the live site. Over time the bookmarks were moved autonomically by our algorithm. For example, Figures 12a & 12b show the po-sition of a single bookmark as it was moved by the sys-tem with respect to time and received requests. In both cases the system responds and the bookmark quickly moves to a new position, and then gradually converges until it becomes stable. In most cases the majority of movements were only in one direction, but for a
7410 7415 7420 7425 7430 26/04 27/04 28/04 29/04 30/04 01/05 02/05 03/05 04/05 05/05 Bookmark Position Time (day/month) (a) Position over time
7410 7415 7420 7425 7430 0 10 20 30 40 50 60 70 80 90 Bookmark Position
Requests (for this bookmark) (b) Position over requests for bookmarks
Fig. 12: Manchester United vs Milan single bookmark position
Algorithm 1 Bookmark moving algorithm
// Bt is the location of the bookmark at time t
// Stis the location the user sought at time t
// w is the time the user waited before seeking to St
if St< Bt then
// The user seeks backwards before the bookmark if w <= 20 and St> (Bt− 60) then
// The seek occurred within 20 seconds of viewing the bookmark and lands within 60 seconds of the bookmark α = 0.1
Bt+1= αSt+ (1 − α)Bt
end if
else if St> (Bt+ w) then
// The user seeks forward
if w <= 60 and St< (Bt+ 120) then
// The seek occurred within 60 seconds of viewing the bookmark and lands within 120 seconds of the bookmark α = 0.05
Bt+1= αSt+ (1 − α)Bt
end if end if
ple of bookmarks the positions oscillated between two values. The most prominent example of this was a foul in a football match which led to a penalty. Some users wished to see the foul but others only wished to see the penalty a minute later. In these small number of cases it is subjective to decide if a bookmark is correctly placed, and in fact using this algorithm the bookmarks may never converge to a single point. In such cases, it may be best to bias the bookmark towards the earlier position, so both the early and later events can easily be seen.
Instead of subjectively deciding if a bookmark has moved to its correct location, we examined how much traffic might have been saved by moving the bookmark to a new location. If, for example, a bookmark was moved forward 10 seconds closer to the desired loca-tion, and a user views for 90 seconds, then by moving
the bookmark we have potentially stopped video being transferred which might have normally been skipped over. A reduction of 10/(90 + 10) = 10% is there-fore made. Of course, this is only true if the user does not seek backward to watch the skipped 10 seconds, in which case we save nothing, and in fact incur an extra seek. Figure 13a displays a CDF of the potential reduc-tion in viewing durareduc-tion per bookmark request from the use of the algorithm. We can see that 16% of the requests made no saving: these are accounted for by early requests before the bookmarks were moved, and requests where the user incurs an additional seek.
Figure 13b illustrates how rapidly these reductions are made (and whether or not they are sustained) through a plot of the fractional potential saving versus the number of requests received across all the moved bookmarks. For the first 20% of requests the reduc-tions are low yet they improve, and then stabilise at a reduction of between 30-40% per request. The 95% con-fidence intervals are quite wide in most cases (averaging around ±10 seconds) although this variance is mostly due to differences in playback length and not the 16% of requests with no saving.
With minimal processing this simple algorithm has been able to reposition the bookmarks to more appro-priate locations based on observed user behaviour, re-sulting in consistent traffic reductions. The algorithm can still be improved by fine tuning the α values. Larger values would move the bookmark more quickly at the cost of increasing the probability of incorrect decisions. This investigation has been left for future work.
5.2 Predictive Pre-fetching
Due to the increased interactivity of users and their de-parture from the start-to-finish model, it is no longer
0 0.1 0.2 0.3 0.4 0.5 0.6 0.7 0.8 0.9 1 0 20 40 60 80 100 CDF
Reduction in viewing duration (%)
(a) CDF of percentage reduction in viewing duration
0 10 20 30 40 50 0 0.1 0.2 0.3 0.4 0.5 0.6 0.7 0.8 0.9 1
Reduction in viewing duration (%)
Fraction of bookmark requests received Saving 95% Confidence Interval
(b) Percentage reduction in viewing duration versus received re-quests
Fig. 13: Reduction in viewing duration due to the algorithm
wise to only pre-fetch ahead of the playback point. How-ever, as noted in Section 4.7 it is still possible to pre-dict which bookmark a user will view next, allowing the client to intelligently pre-fetch content, benefitting both clients and servers. For the clients, pfetching re-moves seek latency when seeking to a pre-fetched seg-ment, both in terms of the network seek latency in-curred and also the time taken to buffer enough video for playback, as well as helping to avoid buffer under-runs under poor network conditions. Similarly, on the server side, pre-fetching can help reduce the peak server load by increasing the load at quieter times with pre-fetching requests, thus making the overall load more uniform.
However, pfetching does come with a cost; re-sources are wasted if a segment is downloaded and never used. Deciding which segments to pre-fetch is there-fore an important task. We devised a set of pre-fetching strategies which we tested within a simulator driven by the eurovision trace obtained from our system. Clients were provisioned with a dedicated link to the server, ca-pable of transferring twice the bitrate required to play the content. Once a client has fetched enough data to fill a 5 second playback buffer, half of their bandwidth is allocated to the pre-fetcher whilst the other half con-tinues to fill the playback buffer.
For simplicity, and because interest always formed around bookmarks, each strategy will only pre-fetch segments immediately following a bookmark (i.e., bookmark hotspots). In all experiments the amount of each hotspot pre-fetched was determined by varying the percentile of that particular hotspot’s length model, as described in Section 4.8. The details for each pre-fetch strategy are listed below:
Ahead simply continues to pre-fetch ahead of the playback point assuming the client has a unlimited buffer. This is similar to what some existing stream-ing applications do.
Ahead (to hotspot end) again simply continues to pre-fetch ahead of the playback point but only until the end of hotspot associated with the bookmark being viewed.
Ahead (and Predictive) works in a similar way to Ahead (to hotspot end), however once it reaches the end of the hotspot it begins to use the Predictive pre-fetch scheme.
Predictive uses knowledge observed from other users as to which bookmark is likely to be requested next, and thus starts to pre-fetch the bookmark hotspots in descending order of probability of being vis-ited. The more users interacting with the system, the more accurate the predictive knowledge becomes.
Sequence will pre-fetch bookmark hotspots in the order in which they appear within the video regardless of the current playback point. For example, in a football match the goals would be pre-fetched in a sequential order.
Sequence After again pre-fetches bookmark hotspots in the order in which they appear within the video; the difference being only hotspots that are after the current playback point are fetched. For example, if a user has yet to fetch the first bookmark’s hotspot but is already viewing the second, then the first will not be pre-fetched.
Two metrics were measured to determine how well the different schemes behaved. The first metric dis-played in Figure 14a is the fraction of requests with zero seek latency. A seek latency of zero occurs when the user has already pre-fetched a playback buffer’s worth
0.15 0.2 0.25 0.3 0.35 0.4 0.1 0.2 0.3 0.4 0.5 0.6 0.7 0.8 0.9 1
Fraction of requests with zero seek latency
Prefetch Size (percentile of hotspot length) Predictive Sequence After Sequence Ahead Ahead (to hotspot end) Ahead (and Predictive)
(a) Fraction of requests with zero seek latency
0.4 0.5 0.6 0.7 0.8 0.9 0.1 0.2 0.3 0.4 0.5 0.6 0.7 0.8 0.9 1
Average Usage Ratio
Prefetch Size (percentile of hotspot length) Predictive
Sequence After Sequence Ahead Ahead (to hotspot end) Ahead (and Predictive)
(b) Usage ratio
Fig. 14: Various metrics for different pre-fetch schemes versus bookmark length
of video from a requested seek point. The second met-ric measured the ratio of fetched data which was never watched, and therefore needlessly fetched. This usage ratio is shown in Figure 14b.
Using the simple Ahead scheme 31% of seeks have zero latency, this is made up of seeks to segments that have already been viewed, and small forward seeks into the ahead buffer. Adapting this scheme to only pre-fetch to the end of the bookmarks (i.e. the Ahead (to hotspot end) scheme) has a minor negative effect on the seek latency, whilst increasing the average usage ratio. The Sequence and Sequence After schemes are very similar, but the simple modification to the Sequence After scheme allowed it to achieve a lower seek latency whilst not degrading its average usage ratio. This was because users had a tendency to not seek to a book-mark before the current playback point, and always go forward within the video, leaving the Sequence scheme stuck pre-fetching hotspots before the current playback point.
Both the Predictive and the Sequence After schemes perform in a similar manner, with the Predictive schemes always outperforming the other. Due to this fact, the Sequence After scheme could be used in place of the Predictive scheme whilst knowledge is collected to improve the Predictive scheme’s accuracy.
The best outcome was the combination of Ahead and Predictive schemes named Ahead (and Predictive). This exploited the fact that users rarely viewed beyond the end of a hotspot, and thus pre-fetching another hotspot was of benefit.
In the previous experiments the Predictive scheme was primed with knowledge from all users, but in reality this knowledge would be built up over time. To test how quickly this knowledge can be obtained we ran another set of experiments where the Predictive and Ahead (and
0.2 0.25 0.3 0.35
0 500 1000 1500 2000 2500 3000
Fraction of requests with zero seek latency
Knowledge
Predictive 0.9 Ahead (and Predictive) 0.9 Predictive 0.55 Ahead (and Predictive) 0.55
Fig. 15: How zero seek latencies is effected by amount of pre-fetch knowledge
Predictive) schemes were primed with different amounts of knowledge. The results of this are shown in Figure 15. We set the percentile hotspot length to 0.55 and 0.9 which were chosen since 0.55 is where the seek latency began to stabilise, and 0.9 where the usage ratio be-gan to drop rapidly. The knowledge is ranked from 0 to 3000 which represents the number of seek requests received. It can be seen that very quickly (within 250 seek requests) the knowledge has become useful, and eventually plateaus at 1500 seek requests. Any seek re-quests after this point just increase the confidence in the knowledge and does not improve it.
6 Conclusions and Future Work
We have presented a study and characterisation of user behaviour for our interactive Video-on-Demand system. We note that by adding simple bookmarks to points of interest within the media, the access patterns are greatly influenced. This behaviour led to high levels
of seeking which created relatively-short and sparsely-distributed segments with orders of magnitude more popularity than others.
Various distributions were fitted to the different metrics considered, providing a greater understanding of how users interact with such systems. Beyond the insight gained, the models constitute a valuable tool-box for driving future simulations which require highly interactive workloads.
Many existing delivery mechanisms are not designed for high levels of interactive behaviour and are instead optimised for classic start-to-finish streaming. CDNs must therefore adapt to efficiently handle these kinds of access patterns. They could, for example, take advan-tage of the long-tailed distributions of segment popu-larity by replicating those that generate the most de-mand. For instance, we observed that 10% of segments accounted for 44% of all requests.
The departure from classic start-to-finish playback encourages the design of agile delivery mechanisms that allow quick seeking, and allow certain more popular segments to be more highly distributed. We have seen that adding bookmarks will highly influence the order in which users view the content, making the sequence of actions somewhat predictable. This can then be ex-ploited by allowing users to pre-fetch content that they are predicted to need shortly, thus reducing any delays they are likely to experience. However, we noted that bookmarks could be harmful by causing unnecessary seeks if incorrectly placed. This could be remedied for both client and server by simply moving the bookmark autonomically based on observed user behaviour.
So far we have only considered bookmarks within music and sport videos, but bookmarks are equally ap-plicable in many other genres. For example, bookmarks are commonly found in the form of chapters on video DVDs. It is not clear if the same high levels of interac-tivity would be observed, or if the classic start-to-finish model would still be prevalent.
For a system to be fully autonomic the bookmarks should perhaps be created automatically. This could occur after the system has detected a large number of requests for a specific area of a video. A bookmark could then be provisionally placed and its position refined by a bookmark-moving algorithm, such as the one found in Section 5.1.
During our experiment users were unhappy that we “spoilt the experience” of watching the sporting events covered somewhat. This was because the user could quickly determine the final outcome of the event from the bookmark names. The suggestion was made that we avoid labelling the bookmarks and instead simply describe them as points of interest. This could equally
work if the bookmarks were autonomically created since a system would be unable to name them itself. Note, unnamed bookmarks would only be useful if they are typically accessed sequentially, and not based on their name alone.
It was clear that pre-fetching bookmark hotspots only covered 35% of all viewed segments. Thus pre-fetching schemes should consider more segments. This of course would make it harder to decide which seg-ments to pre-fetch next. The probability of making a wrong decision could be reduced if the pre-fetching technique was modified, for example pre-fetching more than one choice simultaneously.
The predictive pre-fetching algorithms used knowl-edge inferred from the observations of other users. For example, if the majority of all users visited two book-marks in the same order, it is likely the next user will do the same. How this knowledge is collected, and how this knowledge is disseminated is left open for future study. We did not discuss who would use this knowl-edge, indeed both the client and server could exploit it differently, each with respective pros and cons. For ex-ample, if the client has spare capacity, it could start to pre-fetch based on both its own previous behaviour and that of the majority of other users. The server could also decide to pre-replicate, or to push out segments predicted to be required when it has spare capacity.
While not the case for all content, high levels of interactivity are becoming more common, whilst users are both relying on and expecting Video-on-Demand services to provide more advanced interactive function-ality. Our study suggests that CDN mechanisms must improve to handle more diverse applications, content and users. To achieve this, the development of new al-gorithms must be driven by models derived from real-istic characterised workloads. The development of such strategies is reliant on gaining a deep understanding of the relevant workload parameters. The analysis and models presented in this paper aim to aid in this en-deavour.
References
1. S. Acharya, B. Smith, and P. Parnes. Characterizing user access to videos on the world wide web. In Proceedings of Multimedia Computing and Networking (MMCN), San Jose, California, USA, January 2000.
2. Akamai. Content distribution network.
http://www.akamai.com.
3. J. Almeida, J. Krueger, D. Eager, and M. Vernon. Analysis of educational media server workloads. In Proceedings of the 11th International Workshop on Network and Operating Systems Support for Digital Audio and Video (NOSSDAV), Port Jefferson, New York, USA, June 2001.
4. S. Chen, B. Shen, S. Wee, and X. Zhang. Adaptive and lazy segmentation based proxy caching for streaming media de-livery. In Proceedings of the 13th International Workshop on Network and Operating Systems Support for Digital Audio and Video (NOSSDAV), pages 22–31, 2003.
5. L. Cherkasova and M. Gupta. Characterizing locality, evo-lution, and life span of accesses in enterprise media server workloads. In Proceedings of the 12th International Work-shop on Network and Operating Systems Support for Digital Audio and Video (NOSSDAV), Miami Beach, Florida, USA, May 2002.
6. M. Chesire, A. Wolman, G. M. Voelker, and H. M. Levy. Measurement and analysis of a streaming media workload. In Proceedings of the 3rd USENIX Symposium on Internet Technologies and Systems, San Francisco, California, USA, March 2001.
7. C. Costa, I. Cunha, A. Borges, C. Ramos, M. Rocha, J. Almeida, and B. Ribeiro-Neto. Analyzing client interac-tivity in streaming media. In Proceedings of the 13th Inter-national World Wide Web Conference (WWW), New York, New York, USA, May 2004.
8. P. Danzig, J. Mogul, V. Paxson, and M. Schwartz. Internet Traffic Archive. http://ita.ee.lbl.gov.
9. G. S. Fishman and I. J. B. F. Adan. How
heavy-tailed distributions affect simulation-generated time aver-ages. ACM Transactions on Modeling and Computer Simu-lation (TOMACS), 16(2):152–173.
10. L. Guo, S. Chen, Z. Xiao, and X. Zhang. Analysis of mul-timedia workloads with implications for Internet streaming. In Proceedings of the 14th International World Wide Web Conference (WWW), Chiba, Japan, May 2005.
11. M. Mitzenmacher. A brief history of generative models for power law and lognormal distributions. Internet Mathemat-ics, 1(2):226–251.
12. K. Sripanidkulchai, B. Maggs, and H. Zhang. An analysis of live streaming workloads on the Internet. In Proceedings of the ACM SIGCOMM Internet Measurement Conference (IMC), Sicily, Italy, October 2004.
13. W. Tang, Y. Fu, L. Cherkasova, and A. Vahdat. MediSyn: A synthetic streaming media service workload generator. In Proceedings of the 13th International Workshop on Network and Operating Systems Support for Digital Audio and Video (NOSSDAV), Monterey, California, USA, June 2003. 14. M. Vilas, X. Paneda, R. Garcia, D. Melendi, and V. Garcia.
User Behaviour Analysis of a Video-On-Demand Service with a Wide Variety of Subjects and Lengths. In Proceedings of the 31st EUROMICRO Conference on Software Engineering and Advanced Applications, pages 330–337, 2005.
15. H. Yu, D. Zheng, B. Zhao, and W. Zheng. Understanding user behavior in large scale video-on-demand systems. In Proceddings of EuroSys, 2006.