Coalescence in Highly Viscous System
8
0
0
Texte intégral
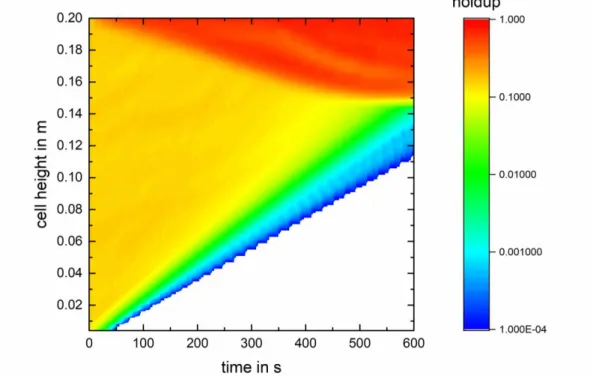
(2) ISEC 2017 - The 21st International Solvent Extraction Conferenc e. 2. ReDrop concept The developed ReDrop tool considers each individual drop from a sufficiently large ensemble present in the system. Their individual velocity, obtained from a sedimentation model, is evaluated for each time step in order to determine their individual vertical position in the settling cell. The coalescence frequency is then evaluated between each pair of drops, which are close enough to each other. The horizontal position of the drops is not evaluated, i.e. it is assumed that the drops are randomly distributed horizontally. As a consequence, special care has to be taken to properly evaluate the contact probability of two drops as a basis to quantify correctly the probability of a coalescence event. The settling cell is divided into height elements which allow the evaluation of the local hold up. The latter influences the sedimentation velocity and is taken into account in the models, e.g. with the approach of Richardson and Zaki [2]. The local hold-up can also be used to get a visual impression of the evolution of the settling as presented in Figure 1. Real liquid-liquid dispersions may also contain further phases, e.g. gas bubbles, solid particles, which can result e.g. from aeration of a fermentation broth. For that reason, the ReDrop tool allows to deal with liquid-liquid dispersion involving an arbitrary number of further phases in order to approach real dispersion. The physical properties of the system and the simulation parameters, e.g. density, viscosity, the initial holdup, parameters of the drop -size distribution, simulation time step, etc. are made available to the ReDrop program via input files, which are supplied by the user. The initial drop-size distribution is an important parameter and can be chosen according to various distribution functions, where typically a log-normal drop-size distribution is used.. Figure 1. Settling of a liquid-liquid dispersion simulated by ReDrop. - 234 -.
(3) ISEC 2017 - The 21st International Solvent Extraction Conferenc e. 3. Coalescence As shown in Figure 2 the probability that two drops coalesce depends on the frequency with which they meet, defined by the so-called collision rate, and the efficiency with which they coalesce once they met. The coalescence efficiency in turn depends on the time, during which the drops stay in contact and the time they would need to coalesce. Kopriwa [3] showed that extraction columns and settling equipment can be described with the identical model. Kopriwa demonstrated that the frequency with which drops meet and the time they stay in contact depends only on the fluids dynamics of the regarded equipment. The differences in equipment to which this model is applied characterize the fluid dynamics, which thus has to be characterized only once for a dedicated equipment. The time the drops need to coalesce on the other hand only depends on the specific material system used, e.g. solvent, salt type and concentration as well as trace impurities, which makes the prediction of the coalescence time difficult [3-4]. coalescence probability. collision rate depends on fluid dynamics. coalescence efficiency. contact time depends on fluid dynamics. coalescence time depends on material system. Figure 2. The coalescence model [3] Pfennig and Schwerin [5] showed that small amounts of salt have a strong influence on the coalescence time, because they influence the interaction between the interfaces. The authors tested different systems with an increased salt concentration and it turns out that the results can be interpreted with the Derjaguin-Landau-Verwey-Overbeek (DLVO) theory. The DLVO theory describes the force resulting from the repulsive ionic and the Van-der-Waals forces acting between two approaching droplets. The DLVO force depends on the salt concentration, as shown on figure 3, and on the different ions present in the system [4]. The DLVO force shows a maximum for a certain salt concentration. At this value, corresponding to 100 mol/m³ in the example presented in Figure 3, the repulsive force between two drops is large and, as a consequence, hinders coalescence, as indicated by Pfennig and Schwerin [5]. In order to include this effect in coalescence modelling, the different terms describing the coalescence probability are investigated separately in order to evaluate their individual effect on the phenomenon. The results will be compared to the models found in the literature and to experimental data. From such experiments, performed in a suitable settling cell, the coalescence time can be evaluated and used for model validation.. - 235 -.
(4) ISEC 2017 - The 21st International Solvent Extraction Conferenc e. Figure 3. Evolution of the DLVO force with the distance between two drops of a radius of 0.1 mm [5] 4. Material and method 4.1 Experimental set up The experiments are conducted in the standardized settling cell proposed by Henschke [1], shown on Figure 4. It consists of a double-wall glass vessel with a capacity of 800 ml, with two shafts for stirring with four stirrers on each shaft, each with four tilted blades. They are connected with a gearbox such that they are counter-rotating during stirring in order to stabilize the system in the first seconds after switching off the stirrers without the need of baffles. The gearbox is driven by a stirrer motor. The outer space of the double-wall vessel is connected to a thermostatic bath. The temperature is set to 25°C. The cell is lighted from behind with a LED panel. The vessel is filled from the top with the two-phase system using a funnel. The volumetric phase ratio is easily read from a scale placed at one side of the vessel. After the cell has been filled with the two-phase system, the stirrers are turned on for 30 s at 800 min-1 for generating the dispersion. Once the dispersion is created, the separation can be studied in the same vessel. Alternatively the dispersion can be transferred into a second vessel, placed below the first one, via opening a ball valve. Internals can be placed in this vessel in order to evaluate their effect on the settling behavior. The experiment is finished when half of the interface is covered by a monolayer of drops, which defines the so-called settling time. This definition has been introduced by Henschke to ensure reproducible results, since alternatively waiting until the last drop has coalesced would lead to large scatter due to the stochastic nature of individual coalescence events.. - 236 -.
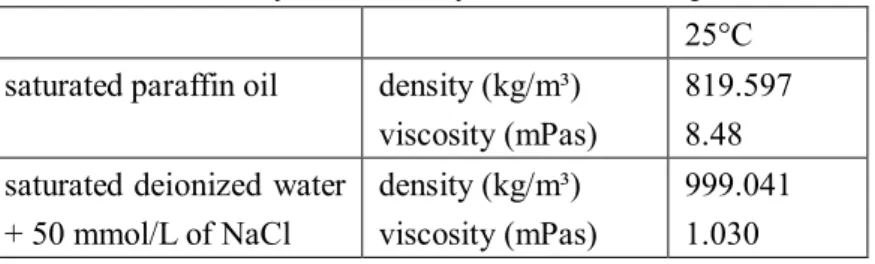
(5) ISEC 2017 - The 21st International Solvent Extraction Conferenc e. Figure 4. The Henschke settling cell [1] 4.2 Chemicals The chemicals used during experiments are paraffin oil, water, and salt. As a first step, the paraffin oil is provided by Fauth + Co.KG and has the reference FC2006 (batch number: 64200048). The water used was deionized water directly produced with a deionization cartridge. The salt used was sodium chloride, supplied by VWR (batch number: 12K220010). The concentration of salt during the experiments was 50 mmol/L in the aqueous phase. Both equilibrium phases were analyzed to determine their density and viscosity with the equipment DSA 5000M combined with Lovis 2000ME of Anton Paar, Graz, Austria. The results are shown in Table 1. Table 1. Density and viscosity of the saturated phases 25°C saturated paraffin oil. density (kg/m³) viscosity (mPas). 819.597 8.48. saturated deionized water + 50 mmol/L of NaCl. density (kg/m³) viscosity (mPas). 999.041 1.030. - 237 -.
(6) ISEC 2017 - The 21st International Solvent Extraction Conferenc e. In the future, different paraffin oils with increased viscosity, to reach a wide drop-size distributions, and varied interfacial interactions introduced by different amounts of salt added will be tested and followed over time. The experimental results will be used to validate the model and the numerical approach. 5. First results 5.1 The Coalescence Model The first variable investigated which describes the coalescence is the collision rate, 𝑟𝑐𝑜𝑙𝑙𝑖𝑠𝑖𝑜𝑛 . It depends on the relative sedimentation velocity of the two considering drops, 𝑣𝑟𝑒𝑙 . In order to take into account the random horizontal position of the drops, the probability of the drops meeting must be evaluated and integrated in the model describing the collision probability. It depends on the surface area of the two studied drops, 𝜋(𝑑1 + 𝑑2 )2 , the separating distance between the two drops, |ℎ1 − ℎ2 |, the horizontal cross-sectional area of the settling cell, 𝐴𝑐𝑒𝑙𝑙 and the time step, Δ𝑡. Based on this analysis, the collision probability between two drops can be found as: 𝑟𝑐𝑜𝑙𝑙𝑖𝑠𝑖𝑜𝑛 =. 𝜋(𝑑1+𝑑2 )2𝑣𝑟𝑒𝑙 Δ𝑡 𝐴𝑐𝑒𝑙𝑙 |ℎ1−ℎ2|. (1). The contact time describes the period during which two drops stay in contact while sedimenting. As a first basis to gain a more detailed understanding of the underlying dependencies, the buoyancy and the friction forces acting on the drops were accounted for in the equation of motion of two approaching and meeting drops. The equation was solved assuming that the drops follow their curvature during the contact period. Figure 5 represents the contact time between a first drop with a diameter of 1 mm and a second drop with varied diameter. This approach was developed to get a first impression of the contact time and has to be validated. Further studies will combine this approach with further details of the relative motion, accounting for the fluid dynamics between the drops and the different surface properties [4]. 0.3. contact time in s. 0.2. 0.1 0.08 0.06 0.04. 0.02. 0.01 0.0. 0.2. 0.4. 0.6. 0.8. 1.0. second drop diameter in mm. Figure 5. Contact time between a first drop of 1 mm and a second drop with varied diameter. - 238 -.
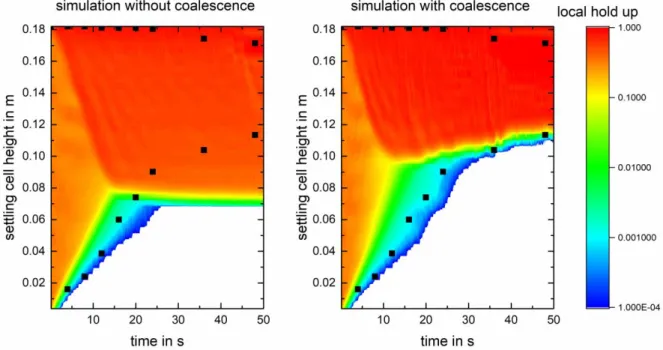
(7) ISEC 2017 - The 21st International Solvent Extraction Conferenc e. The third parameter, which describes the coalescence probability, is the coalescence time. It corresponds to the time necessary for the acting forces to induce the coalescence between two droplets. Some models exist already, e.g. the Henschke model [1] or the Coulaloglou and Tavlarides model [6], which will to be validated with appropriate experiments as described above. 5.2 ReDrop simulation The developed ReDrop tool was then used to simulate experimental data. As the modelling of the coalescence curve will be implemented as a next step, here results are shown for sedimentation curve. The parameters of the drop size distribution and of the coalescence were fitted in order to match with experimental data. The results are shown on Figure 6. It is apparent that the coalescence leads to a sedimentation curve being curved upward as in the experiments. Also, some finer droplets remain after the major separation has been completed, which also corresponds to the experimental observation.. Figure 6: Simulation of settling experiment with the ReDrop tool.. - 239 -.
(8) ISEC 2017 - The 21st International Solvent Extraction Conferenc e. Acknowledgement The project is partly supported by the Federal Ministry for Economic Affairs and Energy of Germany, project number: 01168585/1.. 1) 2) 3) 4) 5) 6) 7) 8) 9). References M. Henschke, L.H. Schlieper, A. Pfennig, Chem Eng. J., 85, 369-378 (2002). J.F. Richardson, W.N. Zaki, Trans. Inst. Chem. Eng., 32, 35-53 (1954). N. Kopriwa, F. Buchbender, M. Kalem, J. Ayesteràn, A. Pfennig, Solvent Extr. Ion Exch., 30, 683723 (2012). N. Kopriwa, A. Pfennig, Solvent Extr. Ion Exch., 34, 622-642 (2016). A. Pfennig, A. Schwerin, Ind. Eng. Chem. Res., 37, 3180-3188 (1998). C.A. Coulaloglou, L.L. Tavlarides, Chem. Eng. Sci., 32, 1289-1297 (1977). J. Ayesteràn, N. Kopriwa, F. Buchbender, M. Kalem, A. Pfennig, Chem Ing. Tech., 38, 1894-1900 (2015). T. Tobin, D. Ramkrishna, Can. J. Chem. Eng., 77, 1090-1104 (1999). J. Kamp, M. Kraume, Chem. Eng. Sci., 126, 132-142 (2014).. - 240 -.
(9)
Figure
![Figure 3. Evolution of the DLVO force with the distance between two drops of a radius of 0.1 mm [5]](https://thumb-eu.123doks.com/thumbv2/123doknet/6211126.160584/4.892.107.614.130.458/figure-evolution-dlvo-force-distance-drops-radius-mm.webp)
Documents relatifs
We have described the HARMonized dataset of OZone pro- files (HARMOZ) based on limb and occultation data from six satellite instruments: GOMOS, MIPAS, SCIAMACHY, OSIRIS, SMR
Thanks to the enrichment of tetramers and pentamers, the fifth fraction was well-prepared to be purified by a solid-phase chromatography with a low and efficient injection amount in
Thanks to the enrichment of tetramers and pentamers, the fifth fraction was well-prepared to be purified by a solid-phase chromatography with a low and efficient injection amount in
Abstract. This article investigates how employees respond to hybrid organizing, that is, organizational settings that are characterized by multiple institutional
The results of tests on samples obtained commercially had indicated that the increased subsoil stresses would be in the range slightly above the
[r]
La valorisation des déchets de briques sous forme de poudre dans les matériaux de construction, peut être envisagée notamment dans les mortiers, étant donnée
The aim of the present work is to determine whether Optical Feedback Interferometry, a new optical technique in the microfluidic domain which is based on the
