HAL Id: hal-01111368
https://hal.archives-ouvertes.fr/hal-01111368
Submitted on 30 Jan 2015
HAL is a multi-disciplinary open access
archive for the deposit and dissemination of
sci-entific research documents, whether they are
pub-lished or not. The documents may come from
teaching and research institutions in France or
abroad, or from public or private research centers.
L’archive ouverte pluridisciplinaire HAL, est
destinée au dépôt et à la diffusion de documents
scientifiques de niveau recherche, publiés ou non,
émanant des établissements d’enseignement et de
recherche français ou étrangers, des laboratoires
publics ou privés.
Artificial cochlea and acoustic black hole travelling
waves observation: Model and experimental results
Simon Foucaud, Guilhem Michon, Yves Gourinat, Adrien Pelat, François
Gautier
To cite this version:
Simon Foucaud, Guilhem Michon, Yves Gourinat, Adrien Pelat, François Gautier. Artificial cochlea
and acoustic black hole travelling waves observation: Model and experimental results. Journal of
Sound and Vibration, Elsevier, 2014, vol. 333 (n° 15), pp. 3428-3439. �10.1016/j.jsv.2014.03.016�.
�hal-01111368�
This is an author-deposited version published in:
http://oatao.univ-toulouse.fr/
Eprints ID: 13345
To link to this article: DOI:10.1016/j.jsv.2014.03.016
URL:
http://dx.doi.org/10.1016/j.jsv.2014.03.016
To cite this version:
Foucaud, Simon and Michon, Guilhem and Gourinat,
Yves and Pelat, Adrien and Gautier, François Artificial cochlea and
acoustic black hole travelling waves observation: Model and experimental
results. (2014) Journal of Sound and Vibration, vol. 333 (n° 15). pp.
3428-3439. ISSN 0022-460X
O
pen
A
rchive
T
oulouse
A
rchive
O
uverte (
OATAO
)
OATAO is an open access repository that collects the work of Toulouse researchers and
makes it freely available over the web where possible.
Any correspondence concerning this service should be sent to the repository
administrator:
staff-oatao@inp-toulouse.fr
Artificial cochlea and acoustic black hole travelling waves
observation: Model and experimental results
Simon Foucaud
a,n, Guilhem Michon
a, Yves Gourinat
a, Adrien Pelat
b,
François Gautier
baUniversité de Toulouse, INSA, UPS, EMAC, ISAE, ICA (Institut Clément Ader), 10 Avenue Edouard Belin, 31055 Toulouse, France bLaboratoire d'Acoustique de l'Université du Maine, CNRS, Avenue Olivier Messiaen, 72085 Le Mans, France
a r t i c l e
i n f o
a b s t r a c t
An inhomogeneous fluid structure waveguide reproducing passive behaviour of the inner ear is modelled with the help of the Wentzel–Kramers–Brillouin method. A physical setup is designed and built. Experimental results are compared with a good correlation to theoretical ones. The experimental setup is a varying width plate immersed in fluid and terminated with an acoustic black hole. The varying width plate provides a spatial repartition of the vibration depending on the excitation frequency. The acoustic black hole is made by decreasing the plate's thickness with a quadratic profile and by covering this region with a thin film of viscoelastic material. Such a termination attenuates the flexural wave reflection at the end of the waveguide, turning standing waves into travelling waves.
1. Introduction
The cochlea is the mammalian organ of hearing. It is made of a fluid-filled duct partitioned with the basilar membrane. The basilar membrane compliance is varying along the length of cochlea. The acoustic excitation coming from the external sound provides a wave travelling along the basilar membrane from the base to the apex of the cochlea with a peak of maximum magnitude. The localization of this peak is related to the excitation frequency and permits the sound discrimination.
Artificial cochleas mimic mechanical filtering without the help of a power-consuming processing device. Vibrations are measured with the help of piezoelectric patches [1] or laser velocimeter [1–3]. The frequency–place relation, called tonotopy, can be observed on these devices. However, reflections at the end of the waveguides provide standing waves. In the inner ear, waves are attenuated before they reach the apex because of interstitial fluid viscosity and no reflection occurs[4]. This mechanism is not easily reproducible even with micromachining techniques[2]. Interesting results can be obtained by increasing the fluid viscosity[5]but the resulting magnitude is then reduced by the introduced damping. Here, a new method is experimented to observe travelling waves on an artificial metallic support. The Acoustic Black Hole (ABH) effect takes place for flexural waves propagating toward sharp edges[6–8]. It attenuates the reflected waves at free edges on a wide frequency bandwidth.
n
Corresponding author.
This paper describes a waveguide inspired by artificial cochleas and designed in order to observe travelling waves. Main components of the waveguide are two ducts partitioned with a plate of varying width. An ABH is added as an anechoic end. An asymptotic method is used to model the waveguide. In a wave approach, the ABH is here modelled with a reflection coefficient. An experimental setup is manufactured and experimented successively with ducts filled with water and with air. Finally, experimental results are compared to the model and discussed.
2. Model of the inhomogeneous waveguide
Let us consider an inhomogeneous waveguide made with a flexible panel coupled to a confined fluid domain (seeFig. 1). Here, the modelling strategy aims at reducing computing costs and providing analytical interpretations. Firstly, simplifying assumptions are applied for obtaining governing equations of the solid and fluid domains. Then, an asymptotic method provides a formulation for the solution of the coupled problem as a one-dimensional propagating wave. Finally, wave propagation problem is solved using a Lagrangian approach.
2.1. Governing equations
The considered geometry (seeFig. 1) is called a box model of the cochlea. The geometric parameters are varying slowly along the waveguide in the Z direction. From zAto zB, the height H of the ducts and the thickness h of the plate are constant
while the width b of the plate is varying linearly. Then, from zBto zC, the waveguide cross section is constant. Finally, in the
third zone, from zCto zD, the thickness decreases in a quadratic law to zero while the width of the plate stays constant. Ducts
are joined at the free end of the plate. Modelling is focused on the section from zAto zB. The constant zone from zBto zCand
the acoustic black hole from zCare considered as a boundary condition at zB. Vibrations are considered as harmonic at the
frequency ω and the time dependance of each variable is eiωt. Assuming no viscosity and incompressibility, the fluid domain
is ruled by the Laplace equation, satisfied by the velocity potential Φ
ΔΦ ¼0; (1)
where the operator Δ denotes ∂2=∂x2þ∂2=∂y2þ∂2=∂z2. The outer walls are rigid and fixed. The interface between fluid and
structure is moving vertically. These definitions provide the following boundary conditions: v -# n-¼0 for x ¼ 7 b=2 (2) v -# n-¼ _W for y ¼ 7 H and y ¼ 0; (3) where n
-is the normal vector to the surfaces, v
-corresponds to the fluid velocity and _W is the structural velocity. Since the ratio of the thickness to the width and to the length stays very small, the structure is considered as a thin body and vertical displacement are assumed as constant through the thickness of the structure. The dynamic equation for an isotropic bending plate under harmonic vibration is
∂2 ∂z2 D ∂2W ∂z2 ! " þ2 ∂ 2 ∂z∂x D ∂2W ∂z∂x ! " þ∂ 2 ∂x2 D ∂2W ∂x2 ! " $ ρph zð Þω2W þ pf¼0; (4) where W is the deflection, h(z) the thickness, ρp the density, D the flexural rigidity of the plate defined by
D ¼ EhðzÞ3=12ð1 $ ν2Þ with E the Young modulus and ν Poisson's ratio of the material. p
f is the resulting fluid pressure
applied on the plate. The damping is considered with the substitution of E with a complex Young's modulus as Ec¼ Eð1 þiηsÞ
with ηs the structural damping ratio. The structural displacement is imposed at the first cross section. The boundary
condition in zBis due to the ABH effect and will be defined later. The plate is clamped on its both sides along the whole
length of the waveguide. Thus the boundary conditions for the structural domain are ∂W
∂x ¼0 and W ¼ 0 for x ¼ 7b=2 (5)
W ¼ W0 for z ¼ zA: (6)
The aim of the model is to solve the deflection of the plate and the fluid pressure field for the varying width zone, from zAto
zB. A wide number of numerical methods (Finite Elements Method for example) could be used to solve this problem.
Numerical methods require great computing costs and the relation between results and system parameters is not clearly expressed. Here, a semi-analytic asymptotic method simplifies the solving and provides an analytic expression.
2.2. WKB formulation
The Wentzel–Kramers–Brillouin (WKB) method has been used from the early seventies [9,10] for modelling the behaviour of passive cochlea, seen as mechanical waveguide. Wave representation is very useful for physical interpretations since results are expressed with an analytical expression depending on only two modelling variables – wavenumbers and magnitudes – permitting an analysis of the system.
Since the waveguide is slowly varying, variables are separated within the product of a longitudinal envelope function and a transverse mode shape under the form YzðzÞYTðx; yÞeSðzÞeiωtand the following relation is assumed:
Y0
zðzÞ{S0ðzÞYzðzÞ; (7)
where0¼∂=∂z. It means that the derivative along the longitudinal direction is substituted by a multiplication factor S0ðzÞ
in the following. We define the longitudinal wavenumber k(z) by
kðzÞ ¼ iS0ðzÞ: (8)
In the fluid domain, the velocity potential Φðx; y; zÞ is chosen as the independent variable
Φðx; y; zÞ ¼ ϕðx; yÞϕzðzÞeSðzÞ: (9)
In the structure domain, the independent variable is the deflection Wðx; zÞ of the median plane (y¼0) of the plate
Wðx; zÞ ¼ wðxÞwzðzÞeSðzÞ: (10)
2.3. Fields expression
The expression of the fluid velocity potential(9), introduced into Eq.(1), gives
½ΔTϕðx; yÞϕzþ ϕðx; yÞððS0Þ2ϕzþ ϕ″zþ2ϕ0zS0þ ϕzS″Þ)eSðzÞ¼0; (11)
where ΔT¼∂2=∂x2þ∂2=∂y2 is the bidimensional Laplacian in the (x,y) plane. Using the WKB assumption(7), ðS0Þ2ϕzis the
dominant factor of ϕðx; yÞ in the previous equation. Thus, the following partial differential equation is obtained at order zero: ½ΔTϕðx; yÞ þ ðS0Þ2ϕðx; yÞ)ϕzðzÞeSðzÞ¼0: (12)
Finally, the transverse problem for the fluid field ϕðx; yÞ can be expressed in each cross section by
ΔTϕðx; yÞ $ k2ϕðx; yÞ ¼ 0; (13)
The boundary conditions on the upper, the lower and the lateral walls are hard wall conditions ∂Φ=∂n ¼ 0 ∂ϕ ∂x x ¼ 7 bðzÞ 2 ! " ¼0 (14) ∂ϕ ∂yðy ¼ 7 HÞ ¼0 (15)
The fluid structure interaction is represented with a continuity of the velocity field between fluid and structure on the interface boundary through the relation
∂Φ
∂yðy ¼ 0Þ ¼ $iωW x; zð Þ; (16)
The thickness of the plate h is neglected as it is small compared to the height of the ducts H. Using ξj¼
ffiffiffiffiffiffiffiffiffiffiffiffiffiffiffiffiffiffiffiffiffiffiffiffiffiffiffiffiffiffiffiffi k2þ ðj2π=bðzÞÞ2 q
, a fluid field which satisfies the boundary conditions(15) and (16) is proposed as a sum of orthogonal modes
ϕðx; y; zÞ ¼ ∑1
j ¼ 1
coshðξjðjy $ Hj ÞÞ ,cos jbðzÞ2πx
! "
where the terms ϕzjðzÞare defined in order to satisfy the boundary condition(16). These terms are calculated introducing the
expression(17)in(16)and projecting it on the cos ðjð2πbðzÞÞxÞ basis
ϕzjð Þ ¼ $iωz RbðzÞ=2 $ bðzÞ=2cos j 2π bðzÞx ! " w xð Þdx RbðzÞ=2 $ bðzÞ=2cos2 j 2π bðzÞx ! " dx , 1 ξjsinhðξjHÞ wzð Þ:z (18)
This expression establishes the expected relationship between the fluid velocity potential and the plate deflection wz(z). The
fluid pressure is related to the fluid potential through the relation pðx; y; zÞ ¼ $iρfωΦðx; y; zÞ, where ρfis the density of the
fluid. Since the velocity field is antisymmetric in the lower and upper ducts, the resulting pressure applied on the plate is twice the pressure from one duct. Introducing the expression(10)into the plate equation(4), the following equation must be satisfied in each cross section:
Dwzð Þ kz 4ð Þw xz ð Þ $2kðzÞ2∂ 2wðxÞ ∂x2 þ ∂4wðxÞ ∂x4 ! " $ ρph zð Þω2wzð Þw xz ð Þ $2iρfωϕðx; 0; zÞ ¼0; (19)
with the boundary conditions
w xð Þ ¼0 and ∂wðxÞ
∂x ¼0 for x ¼ 7b=2: (20)
The transversal deflected shape is assumed as a solution of a transverse beam problem with the previous boundary conditions(20) D ∂ 4wðxÞ ∂x4 ! " $ ρph zð Þω2w xð Þ ¼0: (21)
The model series expansion is truncated and only the first structural mode is considered w xð Þ ¼ α1cos λ1 x b & ' þ β1cosh λ1 x b & ' þ γ1sin λ1 x b & ' þ δ1sinh λ1 x b & ' ; (22)
with α1¼0:8827, β1¼0:1123, λ1¼4:730, γ1¼0 and δ1¼0 chosen to satisfy the boundary conditions(20).
2.4. Solving
An expression of the solution depending on two parameters k(z) and wz(z) has been obtained previously. From here two
different methods can be used for solving. We used the approach of Whitham[11]based on a variational approach. Steele and Taber previously exemplified this method[9].
2.4.1. Variational approach for phase and amplitude
The Lagrangian of a longitudinal slice of the system can be expressed through the linear combination of three terms: the kinetic energy of the plate Tp, the potential energy of the plate Vpand the kinetic energy of the fluid Tf
L¼ Tp$ Vpþ Tf: (23)
Since the fluid is assumed as incompressible, no fluid potential energy is considered. Due to the assumption(7), at order zero, the kinetic energy of the plate averaged over a time period is[9]
Tp¼1 4ρphω 2w2 zð Þz Z bðzÞ=2 $ bðzÞ=2 wðxÞ2dx: (24)
As the variations of the waveguide are small over the length of a wavelength, the expression of the potential energy for a uniform media is used. For a uniform isotropic bending plate, the potential energy averaged over a time period is
Vp¼ D 4 Rb=2 $ b=2 ∂2wðxÞ ∂x2 ! "2 dx Rb=2 $ b=2wðxÞ 2dx þ2k 2 Rb=2 $ b=2 ∂2wðxÞ ∂x2 wðxÞ 2dx Rb=2 $ b=2wðxÞ 2dx þ k 4 2 6 6 6 4 3 7 7 7 5 , w2zð Þz Z b=2 $ b=2 wðxÞ2dx: (25)
Similarly, the fluid kinetic energy is expressed as
Tf¼12ρfhfω2w2zð Þz
Z bðzÞ=2
$ bðzÞ=2
where hf is the equivalent fluid mass of the both ducts, calculated as in[9] hf¼ ∑1 j ¼ 1 1 ξjtanhðξjHÞ RbðzÞ=2 $ bðzÞ=2w xð Þcos j 2π bðzÞx ! " dx ! "2 RbðzÞ=2 $ bðzÞ=2 cos2 j 2π bðzÞx ! " dxRbðzÞ=2 $ bðzÞ=2wðxÞ 2dx : (27)
Finally, the first order time-averaged Lagrangian expression is L¼ 1 2ρfω 2h fþ14ρpω2h $ D 4 I1ðzÞ þ I2ðzÞk 2þ k4 & ' / 0 , w2zð Þz Z bðzÞ=2 $ bðzÞ=2 w2ðx; yÞdx; (28) with I1ð Þ ¼z Rb=2 $ b=2 ∂2wðxÞ ∂x2 ! "2 dx Rb=2 $ b=2wðxÞ 2dx ; (29) I2ð Þ ¼z Rb=2 $ b=2 ∂2wðxÞ ∂x2 wðxÞ 2dx Rb=2 $ b=2wðxÞ 2dx : (30)
The variational principle [11] provides an eikonal equation and a transport equation through the invariance of the Lagrangian with the variations in wz(z) and θðz; tÞ ¼ ωt þSðzÞ,
∂L ∂wz¼0; (31) ∂L ∂θ¼ ∂ ∂t ∂L ∂ωþ ∂ ∂z ∂L ∂k¼0: (32)
For each cross section, wavenumbers k(z) are the solutions of the eikonal equation(31)also called the dispersion relation DðI1ðzÞ þ I2ðzÞk2þ k4Þ $2ρfω2hf$ ρpω2h ¼ 0: (33)
For an established periodic response, the transport equation(32)gives 1 2ρfω2 ∂hf ∂k$ D ∂ðI1ðzÞ þ I2ðzÞk2þ k4Þ ∂k ! w2 zð Þz Z bðzÞ=2 $ bðzÞ=2 w2ð Þx dx ¼ C z; (34)
where Czis a constant. This expression corresponds to the conservation of the energy transported by the wave.
2.4.2. Excitation and boundary conditions
Since the relation of dispersion(33)is even, the plate deflection is a combination of an incident and a reflected wave Wðx; zÞ ¼ wziðzÞwðxÞeSðzÞþ wzrðzÞwðxÞe$ SðzÞ: (35)
A boundary condition is required for each wave, in order to determine the corresponding constant Cz. Boundaries of the
waveguide are positioned at the ends of the varying width plate at the abscissa zAand zB. The application of an excitation
force F upward to the abscissa zAprovides, at the abscissa zA, a displacement w0(seeFig. 2a), which is considered as the first
Fig. 2.Boundary conditions at the end of the waveguide provide the relations for solving the incident and reflected waves amplitudes. (a) At the base of the waveguide (z ¼ zA¼0), the structural displacement w0is considered as the only input. The force F and the transfer function between the force and
the provided displacement w0are not studied. (b) At the end of the varying width plate (z ¼ zB), the reflection coefficient of the acoustic black hole forces
boundary condition
wziðzAÞ þ wzrðzAÞ ¼ w0: (36)
The acoustic black hole is considered here as an anechoic end providing a relation between the incident and the reflected waves at the abscissa zB(seeFig. 2b)
wzrðzBÞ
wziðzBÞ¼ R; (37)
where R is the coefficient of reflection of the acoustic black hole[6].
Using the expression (34) and the previous boundary conditions (36) and (37), the incident and reflected waves amplitudes are solved for each cross section of the varying width plate.
2.5. Results
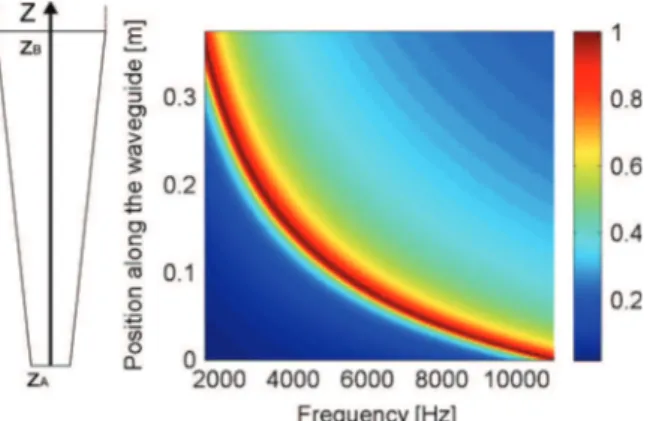
The WKB method is applied successively to the plate immersed in water and in the air. The global envelope function, calculated with WenvðzÞ ¼ jWð0; zÞj, shows a point where the vibration is maximum when only an incident wave is
considered. The envelope function is normalized to the value of this maximum. The location of the point of maximum response depends on frequency (seeFig. 3). A relation between the locations of the maximum points and frequencies, called tonotopy, is observed. The tonotopy for the plate immersed in the air is plotted inFig. 3in the ideal case, where R¼0.
Practically, the interferences between the incident and the reflected waves provide several peaks and make the localization of the maximum unclear. The influence of reflection coefficient is plotted for the plate immersed in water at an excitation frequency of 2000 Hz (seeFig. 4).
Here, the interest is to couple the cochlear-like structure to an acoustic black hole (ABH) which plays the role of an anechoic end reducing the reflection at the end of the waveguide and turning standing waves into travelling waves. 3. Designing the experimental setup
This section describes the design process of the tonotopic zone and of the acoustic black hole which are both the main parts of the experimental setup.
Fig. 3. Ideal tonotopic map in the air using the ABH as a perfect anechoic end (including only the forward propagating wave). The color scale represents the magnitude of the envelope function normalized at each frequency. (For interpretation of the references to color in this figure caption, the reader is referred to the web version of this paper.)
3.1. Dimensions of the tonotopic zone
Due to the machining process, the initial thickness of the acoustic black hole must be at least 1 mm. This constraint sets the tonotopic zone thickness. For a given section of the waveguide, the response amplitude is the highest for a particular frequency called best frequency. The best frequency is plotted as a function of varying width while other parameters are fixed (see Fig. 5). The previously described model is used in order to determine the second transverse mode best frequencies, introducing the coefficients λ2¼7:8532, α2¼0, β2¼0, γ2¼ $0:9374 and δ2¼0:0261 through Eq.(22). The
starting and ending widths of the tonotopic zone are determined in order to obtain a best frequency range between 0.4 kHz and 5 kHz when immersed in water. This frequency bandwidth is included in the human hearing range. The range is limited in order to reduce the response of the second or higher order transverse flexural modes. The procedure exposed inFig. 5
gives a width of 0.04 m at the narrow start of the plate and a width of 0.06 m at the wide end.
Since the plate is excited on the median segment (see Section 3.3.3), the first mode is mainly excited. Thus, the dimensions are extended to fit with the bandwidth [0.4–5 kHz]. The length of the tonotopic zone is designed to be greater than the longest wavelength. The tonotopic zone parameters are summarized inTable 1.
3.2. Using an acoustic black hole as an anechoic termination
The Acoustic Black Hole is an efficient damper for thin structures[6,12]. It is here applied to reduce the amplitude of the waves reflected at the end of an immersed plate. The ABH consists of a quadratic profile of decreasing thickness:
hðzÞ ¼ αðzD$ zÞ2 (38)
where α ¼ hðzCÞ=ðzD$ zCÞ is the ratio of the initial thickness at the abscissa zCto the total length of the ABH. While the
coordinate z tends to the theoretical abscissa zDof the ABH's end, the thickness of the plate tends to zero. At the same time,
the flexural wavenumber increases and tends theoretically to 1. The group speed defined by ∂ω=∂k tends to 0. This means that the propagation of the wave is stopped and it never reaches the end of the black hole. Consequently, no wave is reflected. Practically, the edge is truncated and the ratio between the reflected and the incident waves is strictly positive. A visco-elastic material layer (seeFig. 6) is attached to the plate in order to keep this ratio as low as possible. The visco-elastic material layer aims to increase the negative imaginary part of the wavenumber in order to amplify the attenuation rate of the wave.
Fig. 5.Procedure for determining the dimensions of the varying width plate. The best frequency is plotted as a function of width for the first and the second transverse mode of a cross section immersed in water. From the lower desired best frequency Fmin at ⓐ, the corresponding width bmax is obtained at ⓑ. Then, the best frequency Fmax of the second transverse mode is determined at ⓒ. Finally, the width bmin of the section corresponding to the first mode best frequency Fmax is obtained at ⓓ.
Table 1
Tonotopic zone (TZ) parameters.
Parameter Symbol Value
Length of the TZ zB$ zA 375 mm
Thickness h0 1 mm
Width of the narrow end bmin 22 mm Width of the wide end bmax 60 mm
Young's modulus E 72 000 MPa
Density ρp 2800 kg=m3
Here, the acoustic black hole is clamped on both sides and immersed in water. The transition between the varying width zone and the acoustic black hole is assumed to be sufficiently continuous and smooth. The energy of the incident wave is conserved during the transition between the constant width zone and the acoustic black hole. Since the travelling waves are observed on the tonotopic zone, the reflection coefficient R (see Eq.(37)) is defined at the end of the tonotopic zone (zB). The
ABH is as long as permitted by the manufacturing means. Then, a damping material layer is applied and an equivalent flexural stiffness and density of the composite waveguide are calculated with the help of [6]. The manufactured ABH dimensions and parameters are listed inTable 2.
The zone of constant cross section plays an auxiliary role. Its aim is to separate spatially the tonotopic zone from the ABH. Vibration field measurement in this zone would permit an observation of the correlation between the incident and the reflected waves. This would provide an estimation of the ABH efficiency. This analysis is not detailed here but it will be in future works.
3.3. Experimental setup 3.3.1. Manufacturing
The acoustic black hole and the varying width plate are machined in the same part. The aluminum vibrating plate is clamped between two steel frames which also constitute ducts walls. The upper wall is a transparent plexiglas plate allowing velocity measurements. Most of manufacturing operations are derived from standard operations whereas the machining of the quadratic decreasing thickness of the acoustic black hole requires high speed computer numerical controlled machining. The extension of these techniques to a life-sized artificial cochlea devices needs to be investigated. 3.3.2. Excitation
While the cochlea is excited with acoustic pressure coming through the stapes, the varying width plate is here excited through a force F applied with the help of an electromagnetic shaker (seeFig. 7). The mechanical excitation is appropriate since the plate is relatively stiff compared to the basilar membrane. The varying width zone is extended with a constant width zone to allow the fastening of the shaker to the plate. A piezoelectric force sensor is placed between the shaker and the plate in order to provide a reference of measurement.
3.3.3. Data acquisition
The response of the vibrating plate is measured with a scanning laser vibrometer. The laser beam is oriented perpendicularly to the plate and measures the velocity in the out-of-plane direction. This value is divided by the reference in order to obtain Frequency Response Functions (FRF). The input signal is a burst sine chirp on the frequency bandwidth [0–10 kHz]. Since 6400 frequency lines are used, the frequency resolution is close to 1.6 Hz. The time duration of each acquisition is 1.28 s and data of each point are averaged on six acquisitions for a better signal to noise ratio. The preliminary
Fig. 6.Truncated profile of an acoustic black hole with a visco-elastic damping layer.
Table 2
Acoustic black hole parameters.
Parameter Symbol Value
Length of the ABH zD$ zC 375 mm
Initial thickness hðzCÞ 1 mm
Measured residual thickness hðzdlÞ -80 μm
Damping layer Young's modulus Edl 500 MPa
Damping layer density ρdl 950 kg=m3
Layer structural damping ηdl 0.05
Thickness hdl 0.2 mm
ABH abscissa zC 375 mm
Damping layer absicssa zdl 375 mm
Troncature abscissa zte -625 mm
measurements on the whole surface of the plate show a first transversal mode dominance. Thus, the measurements are realized only on the median segment which reduces the number of points to be measured and increases the spatial resolution.
4. Results and discussion
Since the acoustic black hole is considered as a mean to attenuate reflection, the analysis and the discussion is mainly focused on the varying width zone and extended to the constant zone. The procedure of result analysis is detailed for the experimental setup inFig. 7filled with water excited at an arbitrary frequency fm¼1370 Hz. The same method applied at
other frequencies gave qualitatively similar results. The acoustic black hole effect is the main result and is described in
Section 4.3and inFigs. 10and11.
4.1. Data processing
Using the FRF data HðPðxi; ziÞ; fmÞ, the Operating Deflection Shape (ODS) is obtained by taking the real part of
HðPð0; ziÞ; fmÞ (see Fig. 8a). The deformed shape is similar to the travelling wave described through the model. The
decreasing magnitude of the wave after the higher peak shows the same trend as well. Envelope functions are obtained by taking jHðPðxi; ziÞ; fmÞj. The unwrapped angle ∠ðHðPð0; ziÞ; fmÞÞis used in order to obtain the phase function. The experimental
angle is smoothed using a moving average method along 5 points (10 mm). This allows a reduction of noise from high wavenumbers deformation or measurements. Using the derivatives along the position of the phase, wavenumber curves are obtained (Fig. 8b). A variation of the wavenumber is observed at the abscissa corresponding to the peaks of magnitude and the phase breakdown at 0.15 m. Before this point, the wavenumber is closer to zero which means a long wavelength and a great propagation speed. After this point, the wavenumber reaches a plateau. The experimental curve is oscillating around this value due to the effect of interferences with residual reflected waves. Model and experiment are well correlated excepted at some points. Drop outs appear for the whole frequency range at the same location – around a 0.33 m abscissa – and are due to an irregularity of the experimental setup.
Fig. 8.Experimental results for the case of the plate immersed in water. Operational deflection shape (a) and wavenumber (b) plotted for the frequency fm¼1370 Hz.
4.2. Tonotopy
Since the objective of the experimental setup is to show a tonotopy on the varying width plate, data are used to plot tonotopic curves. For some frequencies, the position of the point of maximum vibration is plotted and compared to the tonotopic curve from the ideal model response (seeFig. 3), taking the location of the maximum response point for each frequency. Model and experimental results are compared inFig. 9. Due to the frame vibrations some outliers are rejected. 4.3. Acoustic black hole effect
In order to observe the acoustic black hole effect, data are used to plot tonotopic maps. For each frequency, the envelope function is normalized and plotted on a color map. The blue color corresponds to no-vibration zones and the red color to the zones of maximum vibration.
Experimental results with acoustic black hole match well with theory (see Fig. 10a). Maximum responses for each frequency are located around the dashed lines representing the modelled ideal localization with no reflection extracted fromFig. 3.
Fig. 9.Comparison of the tonotopic curves plotted from the model and the experimental results for the case in water and in the air.
Fig. 10.Tonotopic maps obtained experimentally for the plate in the air, with (a) or without (b) an acoustic black hole. (For interpretation of the references to color in this figure caption, the reader is referred to the web version of this paper.)
The same experiments are realized on the device without the ABH for the same configuration (seeFig. 10b). The decreasing thickness zone with a viscoelastic layer is replaced in practice by a constant thickness zone without any viscoelastic layer. Interferences between incident and reflected waves are clearly visible inFig. 10b while no interference appears inFig. 10a thanks to the acoustic black hole effect. The ABH significantly attenuates reflected waves on the whole frequency bandwidth. The relation between frequency and place of maximum vibration is made bijective thanks to the ABH effect. The ABH is here experimented in a new configuration compared to the previous works[6,7]. Lateral boundaries are clamped and the flexural plate constitutes a waveguide. It is shown here that the transverse problem does not affect the ABH efficiency.
However, some imperfections appear. The acoustic black hole reflection coefficient does not perfectly cancelled and some interferences are attenuated but still visible. The clamping system of the waveguide is not perfect and some irregularities provide the drop outs observed at the abscissa above 0.3 m inFig. 10a.
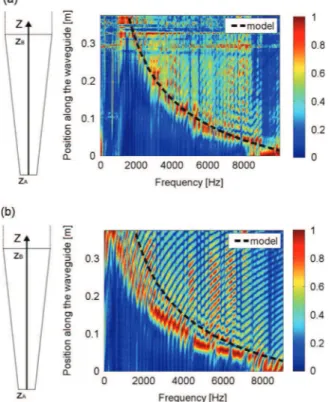
Results for the water-loaded case are presented in Fig. 11. The tonotopy and the ABH effect on reflected waves attenuation are visible above 2500 Hz. This is observed by comparison ofFig. 11a to the ABH-less case shown inFig. 11b. However, the results for heavy fluid-loaded waveguide are not as clear as in the light fluid-loaded waveguide. This can be explained by two reasons. Firstly, since the plate mobility is lower in the immersed case, vibrations levels are lower and the signal to noise ratio is consequently lower. Secondly, main eigenfrequencies of the test frame are located in the [0–2500 Hz] band and perturb measurements for this frequency range. The water-loaded case needs a redesign of the experimental setup in order to make it stiffer. This will decorrelate frame vibrations from the wave propagation in terms of frequencies and amplitudes.
5. Conclusion
This paper focuses on the understanding of wave propagation along an inhomogeneous waveguide representing the basilar membrane. Two supplementary approaches are used to reproduce the passive behaviour of the basilar membrane. On the first hand, a modelling effort is provided through an asymptotic method. On the other hand, an experimental setup is design with the help of the model. Travelling waves are experimentally observed.
Due to the variation of the waveguide properties, the travelling waves show a peak of maximum amplitude located at a particular place depending on the frequency. Theoretical and experimental approaches are compared and a good correlation is observed. The model shows that the attenuation of reflected waves improves the accuracy of tonotopic maps.
Fig. 11.Tonotopic maps obtained experimentally for the plate in water, with (a) or without (b) an acoustic black hole. (For interpretation of the references to color in this figure caption, the reader is referred to the web version of this paper.)
Comparative experiments show coherently that an acoustic black hole used as an anechoic end improves the quality of measurements. Results for the immersed setup might be improved with a redesign of the experimental setup.
This paper uses the acoustic black hole effect only as a way to attenuate wave reflection. Future works will be focused on the analysis of the acoustic black hole. It is used here in an unusual manner with clamped transverse boundary conditions and a normal heavy fluid loading. The comparison of the ABH effects in this experimental setup to classical results could provide interesting results. The modelling approach with the WKB method also presents a great interest for the ABH representation. Wave propagation in the Acoustic Black Hole is not fully understood and the WKB method offers a particularly adapted frame for wave propagation study.
References
[1]H. Shintaku, T. Nakagawa, D. Kitagawa, H. Tanujaya, S. Kawano, J. Ito, Development of piezoelectric acoustic sensor with frequency selectivity for artificial cochlea, Sensors and Actuators A: Physical 158 (2010) 183–192.
[2]R. White, K. Grosh, Microengineered hydromechanical cochlear model, Proceedings of the National Academy of Sciences of the United States of America 102 (2005) 1296.
[3]G. Zhou, L. Bintz, D.Z. Anderson, K.E. Bright, A life-sized physical model of the human cochlea with optical holographic readout, The Journal of the Acoustical Society of America 93 (1993) 1516–1523.
[4]E. De Boer, R. MacKay, Reflections on reflections, The Journal of the Acoustical Society of America 67 (1980) 882. [5] R. White, Biomimetic Trapped Fluid Microsystems for Acoustic Sensing, PhD Thesis, The University of Michigan, 2005.
[6]V. Georgiev, J. Cuenca, F. Gautier, L. Simon, V. Krylov, Damping of structural vibrations in beams and elliptical plates using the acoustic black hole effect, Journal of Sound and Vibration 330 (2011) 2497–2508.
[7]F. Gautier, J. Cuenca, V. Krylov, L. Simon, Experimental investigation of the acoustic black hole effect for vibration damping in elliptical plates, Acoustical Society of America Journal123 (2008) 3318.
[8]J. Bayod, Experimental study of vibration damping in a modified elastic wedge of power-law profile, Journal of Vibration and Acoustics 133 (2011) 061003.
[9]C. Steele, L. Taber, Comparison of wkb calculations and experimental results for three-dimensional cochlear models, The Journal of the Acoustical Society of America 65 (1979) 1007.
[10]M. Holmes, J. Cole, Cochlear mechanics: analysis for a pure tone, The Journal of the Acoustical Society of America 76 (1984) 767. [11] G. Whitham, Linear and Nonlinear Waves, vol. 226, Wiley, New York, 1974.