Any correspondence concerning this service should be sent to the repository administrator: staff-oatao@listes-diff.inp-toulouse.fr
To link to this article : DOI:10.1088/1742-6596/557/1/012025 URL : http://dx.doi.org/10.1088/1742-6596/557/1/012025
This is an author-deposited version published in: http://oatao.univ-toulouse.fr/ Eprints ID: 18319
O
pen
A
rchive
T
oulouse
A
rchive
O
uverte (
OATAO
)
OATAO is an open access repository that collects the work of Toulouse researchers and makes it freely available over the web where possible.
To cite this version: Monthéard, Romain and Airiau, Christophe and
Bafleur, Marise and Boitier, Vincent and Dilhac, Jean-Marie and Dollat,
Xavier and Nolhier, Nicolas and Piot, Eugène Powering a Commercial
Datalogger by Energy Harvesting from Generated Aeroacoustic Noise.
(2014) Journal of Physics: Conference Series, vol. 557 (n° 1). pp. 012025.
ISSN 1742-6588
Powering a Commercial Datalogger by Energy Harvesting
from Generated Aeroacoustic Noise
R Monthéard1,2, C Airiau3, M Bafleur1,4, V Boitier1,5, J-M Dilhac1,2, X Dollat1,4, N Nolhier1,5, E Piot6
1 CNRS, LAAS, 7 avenue du colonel Roche, F-31400 Toulouse, France 2 Univ de Toulouse, INSA, F-31400 Toulouse, France
3 IMFT, Toulouse, France
4 Univ de Toulouse, LAAS, F-31400 Toulouse, France 5 Univ de Toulouse, UPS, LAAS, F-31400 Toulouse, France 6 ONERA – The French Aerospace Lab, Toulouse, France
E-mail : dilhac@laas.fr
Abstract. This paper reports the experimental demonstration of a wireless
sensor node only powered by an aeroacoustic energy harvesting device, meant
to be installed on an aircraft outside skin. New results related to the physical
characterization of the energy conversion process are presented. Optimized
interface electronics has been designed, which allows demonstrating
aeroacoustic power generation by supplying a commercial wireless datalogger
in conditions representative of an actual flight.
1. Introduction
In recent years, Wireless Sensor Networks (WSN) have been considered for various aeronautical applications, including Structural Health Monitoring and flight tests [1]. Isolated from the onboard electrical network, each sensor node needs to be self-powered. Environmental concerns, together with economical and safety-related issues, often prohibit the use of electrochemical batteries. As an alternative solution, energy may be harvested in the sensor’s environment, providing a reliable and sustainable electrical power source.
The energy resource in an aircraft environment is diverse yet non-uniformly distributed, which leaves room for investigating various ambient energy harvesting techniques. Motivated by the opportunity to propose an alternative and complementary solution to those already under investigation (e.g. photovoltaics, vibrations, thermal gradients, …) [2], the goal of this work is to exploit the abundant resource associated with the relative wind.
A very well-known technique for generating electrical energy from airflow relies on the use of a wind turbine. Whereas such a device may be efficient at relatively large scale, its performance decays greatly with downscaling [3]. Alternative airflow energy harvesters have been proposed in recent years, following different approaches [4][5]. One method is based on the aeroacoustic phenomenon, which implies that a membrane is driven into vibration by acoustic waves that result from the
interaction of the airflow with a particular geometry. A few contributions following this approach have been proposed recently, in which the authors employ a Helmholtz acoustic resonator, fitted with an electromagnetic [6] or a piezolectric [7] microgenerator. In [7], Matova et al. achieved 2 µW at 13 m/s airflow velocity, using a mesoscale prototype.
In this work, the aeroacoustic transduction process is investigated, with a focus on demonstrating the potential of such a technique to power a wireless sensor. Unlike earlier work, the target output power lies in the milliwatt range. Additionally, significantly higher airflow speeds are considered, as dictated by typical civil aircraft cruise speeds.
2. Aeroacoustic phenomenon
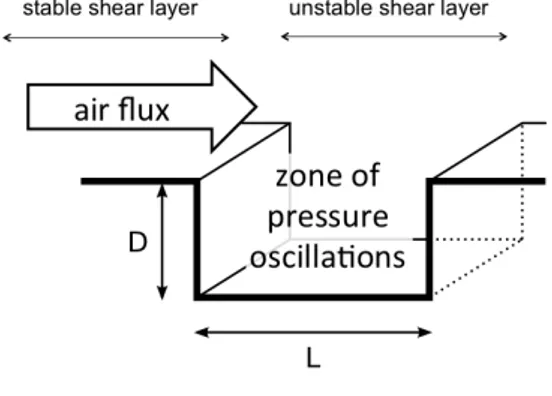
The phenomenon of cavity noise is linked to self-sustained coherent oscillations in the shear layer developing above a cavity in the presence of grazing flow. A complex feedback process can lead to important radiated noise, with both discrete and broadband components [8]. The basic geometry considered in this work is a 2-D rectangular cavity with length L and depth D, as depicted in figure 1, and figure 2 shows typical generated acoustic spectra for different airflow speeds.
Figure 1. Schematic of a rectangular cavity
of length L and depth D.
Figure 2. Generated acoustic spectra at different
airflow speeds (Mach 0,4 to Mach 0,6). Peaks in the oscillation spectrum can be empirically forecasted using Rossiter’s formula [8]. Although based on a semi-empirical model, it provides a fairly accurate estimate of generated frequencies. However, amplitude and direction of the radiated noise must be determined numerically or experimentally only. Additionally, the dominant frequency can be determined according to East analysis [8], depending on the cavity’s aspect ratio.
In previous work [10], experiments have been realized using multiple cavity dimensions and aspect ratios, at different airflow speeds. Experimental results confirmed Rossiter’s model and East’s law, and helped in the process of sizing the device described hereafter.
3. Device design and characterization
The aeroacoustic energy transducer used in this work is made of a rectangular cavity fitted with a piezoelectric membrane at its bottom (see figure 3). Table 1 gives detailed information on dimensions and references. Preliminary measurements reported in [10] show that the dominant acoustic tone produced by this device is situated at about 2300 Hz, with a sound pressure level over 152 dB.
Experiments were carried out in the aeroacoustic test bench "B2A wind tunnel" of ONERA Toulouse. This 4-meter long stainless steel tube of cross-section 50 mm x 50 mm is equipped with a quasi-anechoic outlet, to limit the amplitude of reflected acoustic waves.
0 2000 4000 6000 8000 10000 12000 80 90 100 110 120 130 140 150 160 Frequency (Hz) Amplitude (dB SPL) M0,4 M0,5 M0,6 2
Table 1. Dimensions of the fabricated device. Cavity Length (mm) 27 Depth (mm) 27 Width (mm) 30 Piezoelectric membrane (Murata 7BB-20-6)
Figure 3. Fabricated aeroacoustic energy harvester.
Diameter (mm) 20 Thickness (µm) 420
The transducer has been flush-mounted in the wind tunnel and submitted to a grazing flow up to Mach 0.6. The AC voltage has been measured across a variable resistor directly connected to the piezoelectric membrane. Figure 4 shows the evolution of the RMS power dissipated in the load resistor with respect to the load value, for different airflow speeds. It can be seen that this energy harvester is able to deliver up to 2 mW AC power at Mach 0.5; the corresponding voltage amplitude reaches 8 Volts. Furthermore, the optimal load resistor varies very little with respect to the airflow speed. Nevertheless, as depicted in figure 5, the maximum output power significantly depends on the airflow speed.
Figure 4. RMS output power vs. load resistance Figure 5. Max. output power vs. airflow speed 4. Power management electronics
4.1. Architecture
The power management circuit interfaces the piezoelectric membrane with the wireless sensor node. It comprises two main stages, an AC/DC converter and a DC/DC converter, followed by a storage stage based on supercapacitors as well as regulation and protection circuitry, as depicted in figure 6.
Figure 6. General architecture of the power management circuit
30 mm 27 mm 27 mm PIEZO ø 20 mm 0 10 20 30 40 50 60 70 10−4 10−3 10−2 10−1 100 101 RMS power (mW) Load resistance (k )
RMS power vs. load resistance at different Mach levels M0,2 M0,3 M0,4 M0,5 M0,6 0.2 0.3 0.4 0.5 0.6 0.7 0 0.5 1 1.5 2 2.5
Maximum RMS power at matched load (mW)
Mach Max. RMS power vs. Mach
WSN AC/DC converter piezo storage + regulation, protections, ... DC/DC converter
4.2. AC/DC converter
The first stage is used to rectify the AC voltage generated by the piezoelectric membrane. Reviews in piezoelectric power conditioning circuits highlight the performance of the SSHI (Synchronized Switch Harvesting on Inductor) interface [11][12], especially for pseudo-sinusoidal excitations. In this work, a self-powered parallel SSHI circuit has been implemented. It has been experimentally verified that the SSHI circuit allows doubling the output power compared with a standard, diode bridge rectifier and in the meantime, yields a fourfold increase of the output impedance.
4.3. DC/DC converter
The input impedance of the DC/DC converter must be controlled so as to match the output impedance of the preceding stage, in order to achieve maximum power transfer from the energy harvester. As stated previously, the optimal load varies very little with the airflow speed, which allows the use of fixed input impedance topology. Therefore, it has been chosen to implement a buck-boost converter operating in discontinuous conduction mode, as proposed in [13][14]. This converter has been designed to deal with input powers in the milliwatt range. Efficiency reaches up to 87% and is over 70% over a wide range of output currents.
4.4. Characterization
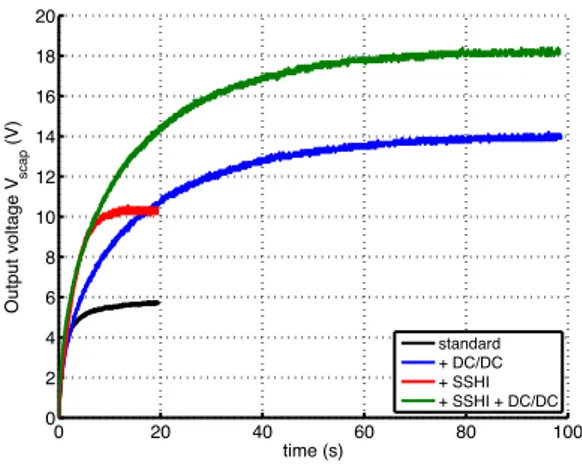
Experiments have been carried out to validate the positive impact of each stage, at an airflow speed of Mach 0.5. Figure 7 illustrates the charging of a 100 µF capacitor using different circuit configurations. It confirms the significant improvement brought by the combination of the SSHI interface and the DC/DC converter, the calculated mean output power is indeed more than six times higher over the first 20-second time interval. A picture of the realized printed circuit board is shown on figure
Figure 7. Charge voltage across a 100 µF
capacitor, for different circuit configurations
Figure 8. Top and bottom view of the printed
circuit board
5. Full system test and validation
The full system includes the architecture as depicted in figure 6, that is, the DC/DC converter connected to two 0.5 F supercapacitors in series, together with an active charge balancing circuit, as well as over- and under-voltage lockout circuits. These protection stages only draw 1-3 µA so as to preserve high efficiency.
This energy harvesting system has been submitted to a Mach 0.5 airflow and used to power a wireless sensor node based on a Jennic JN5148 microcontroller1. Set up to measure the temperature and send the information over a 2.4 Ghz channel, once every 6 s, this module consumes a mean power
1
Note that a video of the experiment can be iewed at the following address: http://youtu.be/1kkq-5g9D_g
0 20 40 60 80 100 0 2 4 6 8 10 12 14 16 18 20 Output voltage V scap (V) time (s) standard + DC/DC + SSHI + SSHI + DC/DC 4
of 181 µW. Figure 9 shows the evolution of the output voltage, which is applied to the datalogger. Initially fully discharged, the system initializes within 42 minutes. Because of the 0.5 J energy consumption at activation, a large capacitance and therefore a long charging time is needed. After a successful startup, the datalogger is activated whereas the storage supercapacitors keep on charging. As the output voltage reaches its maximum value, the system enters regulation. The mean charging power is about 0.8 mW.
Figure 9. Full system output voltage Figure 10. Picture of the experimental bench
6. Conclusion and perspectives
This work has led to the demonstration of a realistic, fully standalone system, made energy-autonomous by means of aeroacoustic energy generation. Future work will focus on refining the transducer design so as to improve its effectiveness over a wider range of airflow speeds, as well as designing a smaller scale prototype.
7. Acknowledgements
This work has been supported by the French government program Investissements d’Avenir, the French Defense Procurement Agency (DGA) and Intesens company.
References
[1] Dilhac JM et al 2009 Proc. Int. Workshop on Structural Health Monitoring (Stanford, USA) [2] Dilhac JM and Bafleur M 2014 IEEE Aerospace and Electronic Systems Magazine 29 pp 18–22 [3] Mitcheson P et al 2008 Proceedings of the IEEE 96 pp 1457–1486
[4] Li S et al 2011 Journal of Applied Physics 109 026104 [5] Humdinger wind energy, www.humdingerwind.com
[6] Kim SH et al 2009 Journal of Micromechanics and Microengineering 19 094010 [7] Matova S et al 2010 Proc. PowerMEMS 2010 (Leuven, Belgium)
[8] Rowley C W and Williams D R 2006 Annual Review of Fluid Mechanics 38 pp 251–276 [9] East L 1966 Journal of Sound and Vibration 3 pp 277–287
[10] Monthéard R et al 2012 Proc. PowerMEMS 2012 (Atlanta, USA) [11] Guyomar D and Lallart M 2011 Micromachines 2 pp 274–294
[12] Szarka G D et al 2012 IEEE Transactions on Power Electronics 27 pp 803–815
[13] Kasyap A et al 2002 Proc. 9th Int. Congress on Sound and Vibration (Orlando, USA) 271 [14] Kong N et al 2010 Journal of Intelligent Materials Systems and Structures 21 pp 1293–1302
0 20 40 60 80 100 120 140 0 1 2 3 4 5 6 time (min) Ou tp ut V ol ta ge (V ) Activation Regulation