Pricing CAC 40 Index Options under
Asymmetry of Information
Sofiane Aboura
E-mail: [email protected]
ESSEC Business School
Av. Bernard Hirsch
95021 Cergy-Pontoise – France
Version : August 2003
Abstract
This article analyses, for the first time, the financial impact on the French market of September 11th, 2001. Was
there any information asymmetry around this date? How deep was the reaction of the French investors? This study measures the magnitude of the shock in the stock price process.
Keywords: Information costs, implied volatility, jump diffusion model
1. INTRODUCTION
One of the strong assumptions underlying the standard financial theory is that investors are perfectly informed about security returns. Tesar and Werner (1995) found strong evidence of a home bias concerning domestic investment portfolios. This home bias can be partly explained by the transaction costs, but also by the information costs that are defined as the cost of collecting, gathering and treating the flow of information required for asset allocation. Merton (1987) introduced a modified capital asset pricing model relaxing the hypothesis of equal amount of information for each investor. This model of capital market equilibrium with incomplete information may provide some insights into the behavior of security prices.
Bellalah and Jacquillat (1995) extended this version of CAPM with incomplete information to option valuation deriving an option formula taking into account an information cost for the option itself and another information cost for its underlying. This model is shown to correct some of the bias of the standard Black-Scholes (1973) model.
In this article, we compare the out-of the sample performance of the information cost model (denoted ICM) with as benchmark, the jump diffusion model (denoted JDM) of Ball and Torous (1983, 1985). The idea is to assess the reaction of the French market during the terrorist attack in September 2001. Let’s recall some aspects of the total financial and economic damages of both events1. For instance, according to the World Bank,
twin towers’ attack may have cast 10 million more people to live in poverty in 2001 and 2002. According to the IMF the total loss is about 21 billion dollars representing around 0.07% of the U.S. total physical assets. The total cost amounts to about a quarter of annual US GDP, i.e. 2500 billion dollars
This paper is organized as follows. Section 2 presents the theoretical models. Section 3 presents the sampling methodology. Section 4 presents the empirical results. Section 5 summarizes and concludes.
2. THE MODELS
2.1. THE INFORMATION COST MODEL
We propose to implement the theoretical model of Bellalah and Jacquillat (1995) which is an extension of the Merton’s (1987) CAPM with incomplete information. The central hypothesis in the Merton’s (1987) model is that an investor includes a security
S
in his portfolio only if he has some information concerning the first and the second moment of the return distribution. The value of a European call as derived by Bellalah and Jacquillat (1995) has the following form:
(
)
(
)
2 1 ) (d
N
Ke
d
N
Se
C
C S r S ICM
where:
2 2 1 1ln
Ke
r SS
d
andd
2
d
1
with
N
(.)
being the cumulative normal density function. The terms
C and
S correspond respectively to the information costs on the option and the underlying asset. When
C=
S= 0, this formula collapses to the Black-Scholes (1973) formula.2.2. THE JUMP DIFFUSION MODEL
After the introduction of geometric Brownian motions, much attention was devoted to Poisson distributions as an alternative specification of stock returns. Large values of returns occur too frequently to be consistent with normality assumption. We assume that
S
follows a log-normal jump diffusion, i.e., the addition of a geometric Brownian motion and a Poisson jump process.Ball and Torous (1983, 1985) proposed a simplified version of the jump–diffusion model, where there will be at most one jump of constant size. If no events occur in the option life, the associated probability is
1
and will be (
) if one event occurs during this time interval. When such event occurs, there is an instantaneous jump in the stock price.
is the average rate of jump occurrence andk
is the size of a jump.
exp
1
1
1
1
N
d
K
r
N
d
k
S
C
JUMP
1
2exp
21
k
k
N
d
K
r
N
d
S
where:
2
1
ln
ln
2 1
S
K
k
r
d
and:
ln
1
2
1
ln
ln
2 2
S
K
k
k
r
d
This formula corresponds to the Black-Scholes (1973) call option value weighted by the probability of a jump and by the probability of no jump with the stock price divided by the expected value of a jump
1
k
. 3. DATA DESCRIPTIONSThe call options database covers every day of September 2001. This database can be given, upon request, by EURONEXT S.A. The twenty days considered in September are the 3 rd, 4th
5,6,7,10,11,12,13,14,17,18,19,20,21,24,25,26,27 and 28th.
These options are short-term European style PXL options written on the CAC 40 Index. We have in total 7015 intra-daily call options. The database contains: the strike price, the futures price, the premium, the maturity and the risk-free interest rate. The maturities that are included go from 27 days to 6 days. The EURIBOR 1 month interest rate is used as a daily proxy of risk-free rate and was downloaded from DATASTREAM. The stream of dividends is also extracted from DATASTREAM.
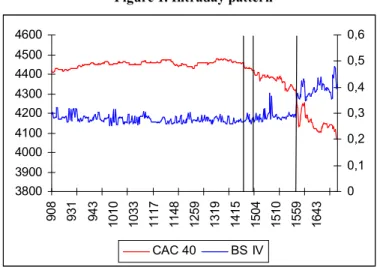
Figure 1 shows the intraday quotes of the CAC 40 index level and the implied volatility (IV) computed from PXL options by inverting the Black-Scholes (1973) formula for the data on September 11, 2001. The attack of the 09/11 occurred at 14h45 (north tower), 15h03 (south tower) and 15h43 (Pentagone) in Paris time. We note as usually the inverse relation between implied volatility and the underlying index. This is not the level of realized volatility, but only the level of an implied volatility computed from closed-to-expiry options. We observe that the implied volatility surged strongly at 15h43 in Paris time.
Figure 1. Intraday pattern
4. THE OUT-OF-SAMPLE VALUATION ANALYSIS 4.1. THE ESTIMATION PROCEDURE
For the information cost model, we estimate the implied volatility
ICM, the option informationcost
C and the underlying information cost
S by minimizing the following loss function :2 j , 1 j , , ,
[
(
,
,
)]
min
ICM ICM C SN j OBS
C
C
S C ICM
)
,
,
(
ICM C S ICMC
is the theoretical call option price of the model.For the jump diffusion model, we estimate the jump occurrence parameter
, the jump size parameterk
and the implied volatility
JDM by minimizing the following loss function :2 j DM, 1 j , , ,
[
(
,
,
)]
min
J JDM N j OBS k JDMC
C
k
)
,
,
(
JDM JDMk
C
is the theoretical call option price given by the jump diffusion model. 4.2. THE IMPLIED PARAMETERS3800 3900 4000 4100 4200 4300 4400 4500 4600 90 8 93 1 94 3 10 10 10 33 11 17 11 48 12 59 13 19 14 15 15 04 15 10 15 59 16 43 0 0,1 0,2 0,3 0,4 0,5 0,6 CAC 40 BS IV
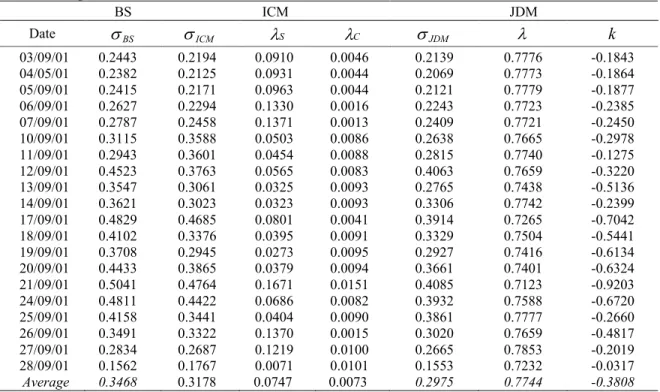
Table 1. Implied Parameters BS ICM JDM Date
BS
ICM
S
C
JDM
k
03/09/01 0.2443 0.2194 0.0910 0.0046 0.2139 0.7776 -0.1843 04/05/01 0.2382 0.2125 0.0931 0.0044 0.2069 0.7773 -0.1864 05/09/01 0.2415 0.2171 0.0963 0.0044 0.2121 0.7779 -0.1877 06/09/01 0.2627 0.2294 0.1330 0.0016 0.2243 0.7723 -0.2385 07/09/01 0.2787 0.2458 0.1371 0.0013 0.2409 0.7721 -0.2450 10/09/01 0.3115 0.3588 0.0503 0.0086 0.2638 0.7665 -0.2978 11/09/01 0.2943 0.3601 0.0454 0.0088 0.2815 0.7740 -0.1275 12/09/01 0.4523 0.3763 0.0565 0.0083 0.4063 0.7659 -0.3220 13/09/01 0.3547 0.3061 0.0325 0.0093 0.2765 0.7438 -0.5136 14/09/01 0.3621 0.3023 0.0323 0.0093 0.3306 0.7742 -0.2399 17/09/01 0.4829 0.4685 0.0801 0.0041 0.3914 0.7265 -0.7042 18/09/01 0.4102 0.3376 0.0395 0.0091 0.3329 0.7504 -0.5441 19/09/01 0.3708 0.2945 0.0273 0.0095 0.2927 0.7416 -0.6134 20/09/01 0.4433 0.3865 0.0379 0.0094 0.3661 0.7401 -0.6324 21/09/01 0.5041 0.4764 0.1671 0.0151 0.4085 0.7123 -0.9203 24/09/01 0.4811 0.4422 0.0686 0.0082 0.3932 0.7588 -0.6720 25/09/01 0.4158 0.3441 0.0404 0.0090 0.3861 0.7777 -0.2660 26/09/01 0.3491 0.3322 0.1370 0.0015 0.3020 0.7659 -0.4817 27/09/01 0.2834 0.2687 0.1219 0.0100 0.2665 0.7853 -0.2019 28/09/01 0.1562 0.1767 0.0071 0.0101 0.1553 0.7232 -0.0317 Average 0.3468 0.3178 0.0747 0.0073 0.2975 0.7744 -0.3808We note that the three volatility measures seem to have the same behavior even if they differ by their values. It is not surprising to see that the Black-Scholes (1973) (denoted BS) implied volatility is the highest in average since the effect of the attack is absorbed by the jump parameter in the JDM and by the two information costs in the ICM. The effect of the attack is overall reflected the September 12th, since it occurred less than three
hours before the closing of the French market.
The BS implied volatility has increased by more than a half (53.68%) from September 11thto 12thwhile the JDM volatility has risen by 44.33%. The ICM volatility remained stable by a neglectible increase of 4.49%. However, on September 17th, the ICM volatility has risen by 55% (33.4% for the BS volatility and 18.4% for the
JDM).
At the same moment, in September 11th, the CAC 40 index has decreased by 4.69% while the VX12
volatility index has increased by an amount of 105% according to the MONEP. The surge of the VX1 seems somehow exaggerated since we recall that this volatility index is computed from 2 calls and not from calls and puts like the German or US volatility indexes. It means that it contains an upward bias.
The option information cost
C has increased by 12% on September 13th. Once it has decreased by half on thenext trading day (September 17th), the underlying information cost has increased by 48%. This means that a flow
of information has appeared on September 17th. It also means that French investors were driving their positions
under information asymmetry from September 11thto September 17th.
The average annualized jump occurrence that is equal to 0.77 times per year. This means that the probability that a jump is observed in average before the option expiration date is equal to 6.45%. The average annualized size of the jump has been multiplied by a factor of 2.52, 4.03 and 5.52 respectively on September 12th
and 13thand 17threlative to the initial value on the 11th. On September 17th, 70.42% of the variation in the stock
price process was explained by a jump.
The French option market has reacted to the attack on September 12th but the strongest reaction
occurred on September 17th. The main explanation is that the NYSE was closed from September, 11th until
September, 17th. It is the longest closure of the NYSE since 1914 war. Therefore, the French market couldn’t
import the necessary amount of volatility from its domestic market. This means that there was not transmission of information concerning the magnitude to give for this event. This explains why the underlying information cost has strongly surged on that date. Maillet and Michel (2002) used the Richter scale to compute the impact of various crises and found that the magnitude of the September 11thwas limited to one month.
Another point must be discussed. The amount of risk has been very high on September 21st. We must
recall that it corresponds to the blow up of the AZF chemical factory at Toulouse (France). On that day and even after, many people made a connection between the accident and the terrorist attack occurred ten days before. It
justifies the overreaction of the French investor on that precise day: 92% of the variation was explained by a jump in the stock price process and not by a volatility phenomenon
4.3. THE OUT-OF-THE-SAMPLE PRICING PERFORMANCE
To discuss the differences between observed prices and theoretical prices for an out-the-sample fit, we use the Absolute Percentage forecast Error (MAPE). We denote
C
, the observed price of the option andCˆ
, the theoretical price of the same option. Forn
being the number of options, the value of the MAPE is given by:
n i i i in
C
C
C
MAPE
1ˆ
ˆ
Note that for the Table 2, the moneyness is computed as
(
S
K
)
1
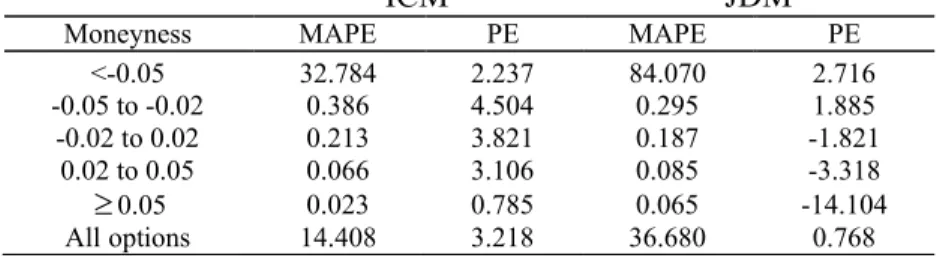
. Deep out-of-the money (denoted DOTM) options corresponds to a moneyness inferior to -0.05; out-of-the money (denoted OTM) options belong to the interval [-0.05; -0.02[; at-the-money (denoted ATM) options belong to the interval [-0.02; 0.02[; in-the-money (denoted ITM) options pertain to the interval [0.02; 0.05[ and deep in-the-in-the-money (denoted DITM) are superior or equal to 0.05. The pricing errors are computed as the difference between the actual call price and the theoretical price.Table 2. Comparison between ICM and JDM prices and observed prices for short term calls
ICM
JDM
Moneyness MAPE PE MAPE PE
<-0.05 32.784 2.237 84.070 2.716 -0.05 to -0.02 0.386 4.504 0.295 1.885 -0.02 to 0.02 0.213 3.821 0.187 -1.821 0.02 to 0.05 0.066 3.106 0.085 -3.318
0.05 0.023 0.785 0.065 -14.104 All options 14.408 3.218 36.680 0.768The best ex-ante fitting is made for DITM options while the worst ex-ante fitting is done by DOTM options. The mispricing is linear with the moneyness. This feature is not surprising and the use of a standard stochastic volatility model would have the same features, i.e, a strong mispricing for DOTM options. The pricing errors indicate that the bias is globally downward since the prices are underestimated. The ICM model performed twice better (in terms of MAPE measure) than a simple jump diffusion model in that turbulent period.
5. CONCLUSION
This article discusses the impact in the French option market of an international major event occurred in September, 11th2001. Two option pricing models are employed to quantify the impact of the terrorist attack on
the French market: an information cost model and a jump diffusion model.
The French market has reacted to the attack on September 12thbut overall on September 17th when the NYSE
re-opened after 4 days of closure. Judging from the implicit parameters, both models have strongly reflected the magnitude of the shock.
REFERENCES
Black F. and Scholes M, (1973), The Pricing of Options and Corporate Liabilities, Journal of Political Economy, 81, 637-659.
Bellalah M. and Jacquillat B., (1995), Option valuation with information costs: theory and tests, The Financial Review, 30, 17-635.
Heston S, A, (1993), Closed Form Solution for Options with Stochastic Volatility with Applications to Bond and Currency Options, Review of Financial Studies, 6, 327-344.
International Monetary Fund, (2001), The World Economy after September 11, World Economic Outlook. Jorion, P., (2002), Risk Management in the Aftermath of September 11, working paper, University of California.
Maillet B. and Michel T., (2002), How deep was the September stock exchange crisis, working paper, Université de Paris I. Merton R., (1987), A simple model of capital market equilibrium with incomplete information, Journal of Finance, 483-511. Tesar L. and Werner I., (1995), Home bias and high turnover, Journal of International Money and Finance, 467-492.