Board Quotas and Director-Firm Matching
Daniel Ferreira
London School of Economics, CEPR and ECGI
Edith Ginglinger
Université Paris–Dauphine, PSL Research University
Marie-Aude Laguna
Université Paris–Dauphine, PSL Research University
Yasmine Skalli
Université Paris–Dauphine, PSL Research University
This version: December 2017
We thank Ulf Axelson, Jean-Noël Barrot, Virginie Beck-Friis (Leyders Associates), Helen Bollaert, Eric de Bodt,
Sabri Boubaker, Mark Chen, Francesca Cornelli, Zsuzsanna Fluck, Laurent Germain, Mariassunta Giannetti, Alberta di Giuli, Moqi Groen-Xu, Camille Hébert, Raj Iyer, Mathias Kronlund, Igor Makarov, Ian Martin, Bill Megginson, Roni Michaely, Daniel Paravisini, Guillaume Pijourlet, Sébastien Pouget, Manju Puri, Estefania Santacreu-Vasut, Antoinette Schoar, Bogdan Stacescu, David Stolin, Michela Verardo, and Shan Zhao, seminar participants at LSE, Paris-Dauphine, Essex, Exeter, Cardiff, Lancaster, Lille, UC Milano, Toulouse, University Paris-Diderot, the European Summer Symposium in Financial Markets (Gerzensee), the CEPR Conference on Incentives, Management and Organization (Copenhagen), the Spring Conference of the French Finance Association, the Summer Finance Conference at IDC Herzliya, the BI conference on Corporate Governance (Oslo), the Corporate Finance Conference at NHH (Bergen), the European Finance and Banking Conference, the Workshop on Corporate Governance at EM Lyon, the Law and Economic Policy Workshop at ESSEC, and the Midwest Finance Association Conference for comments. Edith Ginglinger, Marie-Aude Laguna and Yasmine Skalli acknowledge support from the ANR (10-IDEX0001-02 PSL). Corresponding author: Daniel Ferreira, Department of Finance, London School of Economics, Houghton Street, London WC2A 2AE, Telephone: (+44) 20 7955 7544.
Email addresses: d.ferreira@lse.ac.uk; Edith.Ginglinger@dauphine.fr; Marie-Aude.Laguna@dauphine.fr;
Board Quotas and Director-Firm Matching
Abstract
We study the impact of board gender quotas on the labor market for corporate directors. We find that the annual rate of turnover of female directors falls by about a third following the introduction of a quota in France in 2011. This decline in turnover is more pronounced for new appointments induced by the quota, and for appointments made by firms that regularly hire directors who are members of the French business elite. By contrast, the quota has no effect on male director turnover. The evidence suggests that, by changing the director search technology used by firms, the French quota has improved the stability of director-firm matches.
1 Introduction
A well-functioning labor market for corporate directors contributes to the quality of corporate governance by helping firms attract and retain the right kind of directors. But since no market is perfect, directors and firms may sometimes find themselves matched with the wrong partner. Such poor director-firm matches may persist for some time, especially in the presence of search and matching frictions.1 But such matches tend to be eventually terminated, either because unhappy directors voluntarily step down, or because firms do not reappoint problematic directors. By contrast, high-quality matches are stable. Although we typically cannot observe the quality of a match, we can measure the stability of a director-firm match by the director turnover rate.2 Turnover rates thus allow us to measure how the parties jointly value the match, offering us insights into the functioning of the labor market for directors.3
In this paper, we study the introduction of a mandatory gender balance law in France in 2011, and its immediate effect on corporate director turnover. Beginning with Norway, many European countries have recently passed similar gender quota laws, including Italy, Belgium, The Netherlands, Spain, and Germany. Such laws typically require firms to have a minimum proportion of each gender on their boards. We see the French case as a laboratory for studying the effects of policy interventions on boards’ recruitment and retention policies. The labor market for directors in France is particularly interesting because of its reliance on one particular network – Grande Ecole graduates – whose members are disproportionally represented on
1 Evidence of search and matching frictions in the labor market for directors can be found in Harford (2003), who
finds that directors take many years to replace their board seats lost in takeovers, and in Denis, Denis, and Walker (2015), who show that newly formed boards created due to spinoffs are significantly different from ongoing boards.
2 Here we follow the theoretical matching literature, which typically defines a stable match as one in which no
individual or a pair of agents can unilaterally improve upon their situation by disrupting an existing match (see e.g. Roth and Sotomayor, 1990). In dynamic settings, an originally stable match may eventually become unstable, either because of changes in preferences and agent types, or because of learning. Empirically, the termination of unstable matches generates turnover.
3 The governance literature often interprets the threat of forced turnover as a mechanism for disciplining
underperforming CEOs and other executives. Here we consider director turnover as a measure of match quality. The two approaches are not incompatible with one another; for turnover to measure match quality, we need to control for the variation in turnover that is explained by firm performance and other firm-level outcomes.
corporate boards. This feature allows us to use the quota experiment to study policy interventions in a thin labor market, i.e., a labor market in which most participants come from a relatively small pool.
The introduction of a gender quota is an exogenous shock to the demand for female directors. Such a demand shock has opposing effects on the stability of director-firm matches. On the one hand, the total surplus generated by a director-firm pair may fall after the quota, because firms may hire less-qualified female directors. In addition, female directors may choose to leave their firms more frequently, because of improved outside opportunities. Both of these effects lead to an increase in female director turnover. On the other hand, the quota may increase firms’ costs of replacing female directors. In addition, match quality may improve if the introduction of a quota forces firms to abandon selection and hiring practices (or search
technologies, in the terminology of Diamond and Maskin (1979)) that under-recruit qualified
women.4 Both of these effects lead to a decrease in female director turnover. The overall effect of quotas on director turnover is thus an empirical question.
Because we focus on director-firm matches, our unit of analysis is a director-firm pair. Match surplus and shareholder value are different concepts; the surplus created at the firm-director level may be captured by the firm-director or by a controlling agent, in the form of a private benefit of control. The study of director-firm matches allows us to answer a number of important questions: Do quotas affect director turnover? Are such effects different for male and female directors? Are such effects different for pre-quota and post-quota directors? How do such effects vary across firms? How do quotas affect hiring practices? What does the evidence reveal about the labor market for directors?5
4 This argument has been used in the literature on affirmative action policies: “Whereas the policy is costly when it
distorts the selection of the best qualified individual, this need not be the case when the initial selection is suboptimal. If the best qualified candidates fail to be selected or fail to apply, then the introduction of affirmative action may reduce if not eliminate these costs” (Niederle, Segal, and Vesterlund, 2013, p. 1).
5 A related question is the effect of the quota on director compensation. French boards are similar to US boards: they
typically offer the same compensation package to all outside board members. Committee appointments (including chair assignments) and attendance thus fully explain observed within-board variation in outside director compensation (see Adams and Ferreira, 2008). Controlling for such factors, director compensation has no additional information about the value of directors, making an analysis of compensation uninformative for the purposes of this paper (we do consider though the effect of the quota on committee appointments). For an analysis of director fees in
Our target quantity is the average difference in annual turnover rates between male and female directors. We call this quantity the (gender) turnover gap. The turnover gap in France for the 2003-2014 period is 4.6%: On average, the male turnover rate is 12.2% and the female turnover rate is 7.6%. We show that the introduction of the quota widens the turnover gap, and it is indeed the main reason why this gap exists in the first place: The gap increases from virtually zero before the introduction of the quota to 3%-5% after the quota. We also find that average male director turnover remains unchanged after the quota, implying that we can attribute virtually all of this gap to a decrease in female director turnover. The pre-quota female turnover rate was 11%; the quota has then reduced this rate by about 27%-45%.
To estimate the effect of the quota on the turnover gap, we need to isolate such an effect from other confounding effects. Our approach is to use residual turnover differences: Male-female turnover differences that are not explained by any time-varying firm-level variables (such as size or performance) or some observable director characteristics (such as age or tenure). We are able to perfectly control for any fixed or time-varying firm characteristic by using only within
year variation in turnover rates across directors. By absorbing performance through
firm-year effects, performance-induced turnover cannot explain variation in residual turnover. This approach is possible because we focus on individual director outcomes, and thus our study has some methodological advantages over studies that focus on firm-level consequences of quotas.6
For comparison, we also estimate the turnover gap for US firms during the same period. There has been no real discussion of mandatory quotas in the US, unlike in most European countries. We find that the US has a much lower gender turnover gap: 1.85%, which is fully explained by firm-year fixed effects and director characteristics (in particular age and tenure). Thus, in contrast with France, in the US there is no residual turnover gap. We also find that the empirical determinants of director turnover in the US are very similar to those in France, which validates the use of US directors as a control group. Difference-in-differences estimates, using US directors as the control group, confirm that the quota fully explains the residual turnover gap in France.
France, see Reberioux and Roudaut (2016). For an analysis of director compensation by gender in the UK, where compensation packages are not standardized, see Gregory-Smith, Main, and O'Reilly (2014).
6 Our approach is similar to that of Jiang, Wan, and Zhao (2016), who use within-board variation to study the voting
After establishing our main results, we then investigate the mechanisms behind the decrease in female turnover. First, we find that post-quota appointments explain most of the decrease in turnover: Relative to new male appointments, newly-appointed female directors have lower turnover probabilities. The quota thus appears to have improved the stability of new matches. Importantly, we find that this fact is not explained by newly-appointed female directors being less experienced than female directors appointed before the quota. New appointments after the quota fall into two categories: “rookie” directors (i.e., directors without previous experience) and experienced directors (those who held board seats before the quota). One possibility is that the hiring of rookie directors, who have poor outside options, explains the lower turnover rates. However, we find that, if anything, newly-appointed experienced female directors have even lower turnover rates than rookie female directors.
Second, we find that the decrease in female turnover is more pronounced in firms that regularly employ directors who are members of the French business elite. We measure the degree of board elitism by the proportion of elite Grande Ecole graduates on the board. This is in line with Nguyen (2012) and Kramarz and Thesmar (2013), who argue that a Grande Ecole degree is a good proxy for membership in elite business networks in France. We find that lower turnover of women recently appointed to elitist boards explains virtually all of the effect of the quota.
To interpret the results, we use a simple theoretical framework in which the turnover rate is decreasing in the net surplus from a director-firm match. Net surplus is a natural measure of match quality. Because high-quality matches are less likely to be dissolved, the (residual) turnover rate is an empirical proxy for the (unobservable) net surplus. We use this framework to argue that the evidence suggests that changes in the search technology used by elitist firms explain the bulk of the quota effect on turnover. Consistent with this interpretation, we find that both male and female directors appointed after the quota are less likely to be Grande Ecole graduates. This fact suggests that the quota created incentives for firms to change their search technologies, from networks to executive search firms, regardless of director gender. We discuss some additional anecdotal evidence in line with this interpretation.
Elitist firms recruit directors mostly through their own social networks. Because women are underrepresented in networks of Grande Ecole graduates, a reliance on such a network naturally leads to the underrepresentation of women on boards. In principle, the use of such
networks may be both rational and efficient: Employers may find it easier to evaluate candidates who are similar to themselves (see Cornell and Welch, 1996). However, the use of networks may also be a consequence of search frictions (see Mailath, Samuelson, and Shaked, 2000).7
The quota is also a shock to the demand for male directors. Because firms have fewer vacancies to offer to male directors after the quota, newly-appointed male directors are likely to be better matches with their firms than pre-quota male directors. In addition, male directors may have worse outside opportunities after the quota. Both of these effects tend to reduce male turnover rates. One the other hand, the quota creates incentives for firms to unseat male directors in order to open vacancies for women; this effect should increase male turnover. Thus, from a theoretical perspective, the effect of the quota on male director turnover is also ambiguous. Empirically, we find that total male director turnover does not seem to change after the quota. In the case of newly-appointed male directors, however, turnover rates are slightly lower after the quota, which is consistent with the hypothesis that male directors appointed after the quota also form better matches with their firms. This effect is economically small (just about one percentage point) and statistically imprecise, suggesting that the effect of better matching on male turnover is offset by the need to replace male directors with female directors.
We show a number of additional results. Based on observables – including age, executive experience, and education – post-quota female directors seem no less qualified than pre-quota female directors. We also find that post-quota female directors are more independent and less likely to have family connections to owners than pre-quota female directors. Female director “entrenchment” is thus unlikely to explain the fall in turnover rates after the quota. In addition, we find that – after the quota – experienced female directors are more likely to leave poorly-performing firms and firms with more volatile performances, suggesting that improved labor market opportunities allow experienced female directors to cherry pick the boards on which they sit.
7 A related but different explanation for the importance of networks is the hypothesis that elitist firms may have a
higher propensity to stereotype women as being less competent at board work. Bordalo, Coffman, Gennaioli, and Shleifer (2016a) provide evidence that people tend to overestimate the performance of men in male-type domains (see also Bordalo et al (2016b) for a theory of stereotypes). Under this hypothesis, changes in hiring practices among elitist firms are still the main force behind the change in turnover behavior.
By considering the effect of the introduction of the quota on director turnover, we hope to learn how the market for corporate directors functioned before the quota. As the quota disrupts the existing equilibrium, observing how firms and directors react to this shock helps us learn something about the old equilibrium. A different question is what the new equilibrium will eventually look like. Because the transition period is very long, we cannot answer this question with confidence; turnover rates may still change over the years as they adjust to the new equilibrium, making it difficult to credibly estimate long-run causal effects.
The evidence in this paper makes a number of contributions to the academic literature and policy debates on the topic. First, our evidence highlights the importance of social networks in the market for corporate directors. In their survey of the corporate board literature, when discussing directions for future research, Adams, Hermalin, and Weisbach (2010) ask: “How are
potential outside directors identified? (…) What is the role of social networks in this process?”
(p. 99). Our work complements the existing literature on this topic (e.g., Fracassi and Tate, 2012; Nguyen, 2012; Kramarz and Thesmar, 2013; Fahlenbrach, Kim, and Low, 2017) by showing how networks interact with policy interventions in the market for directors.
Second, in line with the theoretical arguments in Mailath, Samuelson, and Shaked (2000), our evidence suggests that search technologies that disproportionately target candidates from certain groups may constitute a significant matching friction. The largest improvements in female job stability occur precisely in those firms that relied more on the “old boy network” for selecting directors. These are the firms more likely to have – perhaps inadvertently – discriminated against female directors.
Third, a natural concern about board quotas is that they may lead to lower standards for selecting female directors. In the case of Norway, Bertrand, Black, Jensen, and Lleras-Muney (2014) show that this concern has little empirical support; they find that the introduction of the quota improved the observable characteristics of female appointees. We reach a similar conclusion through a different route: The greater stability of post-quota female appointments suggests that the quality of the director selection process has not been compromised by the quota. Finally, our results show that female directors may benefit in multiple ways from the introduction of quotas. Not only quotas make more board seats available to women, they may also increase female director job stability – especially in “elitist” boards – and allow female directors to be more selective about the boards on which they sit. Although the gain in the
number of board seats for women comes largely at the expense of men, the additional gain in job stability does not.
This paper contributes mainly to a recent literature on the labor market for corporate directors, with a focus on director appointments and match formation (see e.g. Akyol and Cohen, 2013; Denis, Denis, and Walker, 2015, 2017; Matveyev 2016; Fahlenbrach, Kim, and Low, 2017; Adams, Akyol, and Verwijmeren, 2017; Becher, Walkling, and Wilson, 2017; Cai, Nguyen, and Walkling, 2017). Our main contribution to this literature is to show how the market for corporate directors functioned before the introduction of the quota, which disrupted the existing equilibrium. Our findings suggest that search frictions and networks are important features of this market.
This paper also contributes to a recent literature on board diversity (Adams and Ferreira, 2009; Adams and Funk, 2012; Adams and Kirchmaier, 2016; Schmid and Urban, 2016; Schwartz-Ziv, 2017; Carter, Franco and Gine, 2017; Bernile, Bhagwat, and Yonkers, 2017; Giannetti and Zhao, 2017), in particular to the literature on the consequence of quotas (Nygaard, 2011; Ahern and Dittmar, 2012; Matsa and Miller, 2013; Bøhren and Staubo, 2014, 2015; Bertrand, Black, Jensen, and Lleras-Muney, 2014; Eckbo, Nygaard and Thorburn, 2016; Reberioux and Roudaut, 2016). More broadly, this paper is related to the literature on male-female differences in behavior and labor market outcomes for executives and other high-skill workers (e.g., Bertrand, Goldin, and Katz, 2010; Huang and Kisgen, 2013). Our paper is also related to the vast literature on CEO and director turnover, which focuses mostly on the links between performance and turnover.8 Our focus is however quite different; by construction, our measure of residual turnover is free from the effect of performance and other firm-level variables.
8 See e.g., Warner, Watts, and Wruck (1988), Weisbach (1988), Denis and Denis (1995), Parrino (1997), Huson,
Parrino, and Starks (2001), Fee and Hadlock (2004), Yermack (2004), Bushman, Dai, and Wang (2010), Kaplan and Minton (2012), Peters and Wagner (2014), Jenter and Kanaan (2015), Cornelli and Karakas (2015), Fahlenbrach, Low, and Stulz (2016), Bates, Becher, and Wilson (2016), and Bonini, Deng, Ferrari, and John (2017).
2 Institutional Background
2.1 Board gender quotas
In France, the Zimmermann-Copé law, adopted on January 27, 2011, requires a minimum of 20% of women on company boards from January 2014 on, rising to 40% on January 1, 2017. When a firm has a dual board (a supervisory board and a management board), the law applies only to the supervisory board. Within boards, the quota applies to all members—insiders and outsiders—with one exception: Directors representing employees, who are usually union representatives.
The law applies to all listed and non-listed companies employing at least 500 employees9 or with revenues of at least EUR 50 million. The legal forms that are subject to this law are limited liability corporations (Sociétés Anonymes), limited partnerships that include at least one general partner and a number of limited partners who buy shares in the entity (known as “commandite par actions” corporations), and Societas Europaea (the European company statutes). All listed companies have to adopt one of these three legal forms. Non-listed companies can opt for other legal forms, which are not subject to quotas (SARL, sociétés à
responsabilité limitée, which have no boards, or SAS, sociétés anonymes simplifiées, in which
boards are optional). Because we consider only large listed firms, the quota applies to all of them. Notice that delisting is not sufficient to avoid the quota. We find no evidence of delisting to adopt a different legal form.
The law was submitted to the French National Assembly on December 3, 2009, and adopted in first reading on January 20, 2010. The parliamentary debates continued throughout 2010 to January 2011, when the law was formally approved. As many companies have anticipated the adoption of the law in 2010, we exclude the 2010 year when comparing the pre-quota period with the post-pre-quota period.
For several years now, European countries have had a number of high-profile policy debates about quotas on company boards. Norway was the first country to adopt such a law in 2003, which was implemented in 2008, requiring a minimum of 40% of board directors from each gender. On November 14, 2012, the European Commission adopted a proposal for a directive setting a minimum objective of having 40% of the under-represented gender in
executive board-member positions in listed companies in Europe by 2020. This directive is still under debate. Meanwhile, several countries adopted regulations requiring greater representation of women on boards. The two countries closest to France are Italy and Belgium. Both countries adopted a one-third quota law, which are effective from 2015 (Italy) and 2017 (Belgium). Even Germany, initially reluctant to consider quotas, adopted in December 2014 a law establishing a gender quota of 30%, effective in 2016 for the largest listed companies.
2.2 Boards in France
Under French law, the size of the board may range from three to 18 members. French firms can adopt either a unitary board or a dual board, with a supervisory board and a management board. The maximum term for a director is six years. The company bylaws determine the duration of directors’ terms. The Association of French Companies’ (AFEP-MEDEF) code, adhered to by many French firms, calls for a maximum of four years. Renewal is permitted.
According to the AFEP-MEDEF code, independent directors should account for at least half the members of the board in widely-held companies. In closely-held companies, independent directors should account for at least a third of the board. After twelve years on the board, independent directors lose their independent status. The governance code recommends that the outside directors meet periodically without the executive directors. An outside director should not hold more than five directorships in listed corporations, including foreign corporations. An executive director should not hold more than three directorships in listed corporations, including foreign corporations. This limit does not apply to directorships held in subsidiaries and holdings.
French law does not cover the number or composition of board committees, which are determined by each board. However, French firms typically have three committees: audit, nomination, and compensation.
2.3 French business elites
The higher education system in France is divided into two separate blocks: universities and elite establishments called “Grandes Ecoles”. In contrast with universities, where entrance after high school is guaranteed by law, Grandes Ecoles are highly selective, and their students represent
only 5% of the total of those who enroll in higher education each year. In addition to excellent high school records, the selection entrance at Grandes Ecoles is based upon an examination that requires two years of intensive preparation (Classes Préparatoires aux Grandes Ecoles).
In France, the majority of business and governmental elites (administrative, scientific, and executive) are former students of the Grandes Ecoles. For instance, around two-thirds of the chief executives in France's largest firms graduated from the Grandes Ecoles (for more details, see Dudouet and Joly, 2010).
Due to historical reasons, those business elites not only benefit from a highly selective education, but also from pervasive political and social connections. After World War II, numerous former civil servants (from the Ministry of Finance or the Ministry of Industry) who graduated from the Grandes Ecoles began to be hired at top-level management positions by big companies (especially state-owned and privatized companies) (for more details, see Bertrand, Kramarz, Schoar, and Thesmar, 2007).
A second distinctive feature of Grandes Ecoles is the under-representation of women among the student body. According to Albouy and Wanecq (2003), among graduates from
Grandes Ecoles who were born during the 1949-1958 period, 2432 are male and 546 are female
(respectively 1829 and 732 among graduates who were born during the 1959-1968 period). Ecole Polytechnique (the top engineering Grande Ecole) did not accept female candidates until 1972, and had in 2015 less than 20% female students. Moreover, between 1989 and 2009, the proportion of female graduates from the Ecole Nationale d’Administration was only around 25-30% (Larat, 2015).
3 Data
We analyze an unbalanced panel of French and US boards over the period 2003 to 2014 using data from Management Diagnostic’s BoardEx database. The sample consists of 3,369 firm-year observations for 414 unique French firms, and of 68,170 firm-year observations for 10,490 unique US firms. All firms are publicly listed. Accounting data are taken from Datastream. If we exclude firm-year observations with missing values for firm size (firm operating performance), the sample consists of 3,126 (3,086) firm-year observations for France and of 45,222 (42,926) firm-year observations for the US.
3.1 Firm and board characteristics
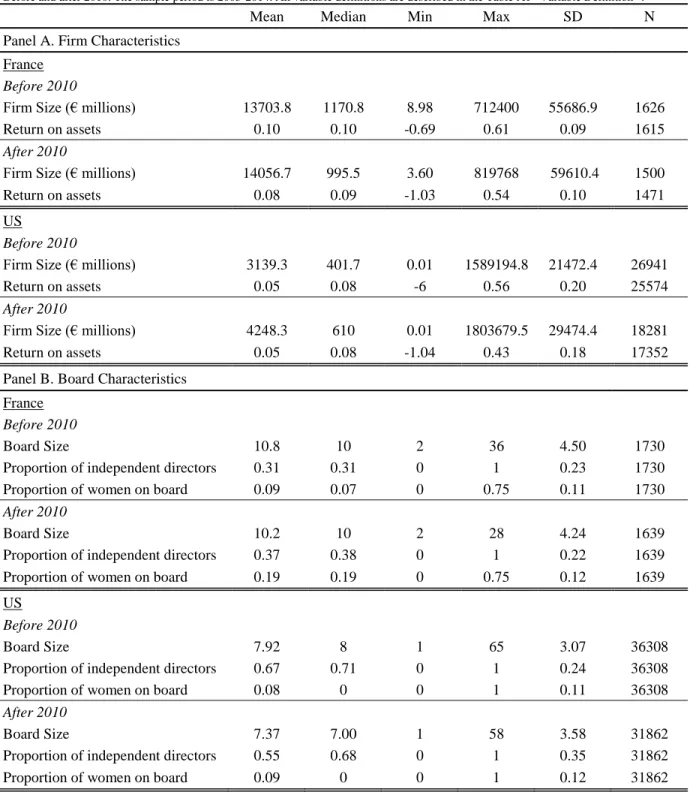
Panel A of Table 1 presents summary statistics of firm characteristics for two subsamples: Before and after 2010 (see Appendix A1 for the definition of all variables used in this section). Firm size is measured as total assets in millions of Euros, and return on assets is the ratio of operating income before interest, taxes, depreciation, and amortization to total assets. Both variables are winsorised at the 1% and 99% levels. Average size and operating performance are very similar before and after 2010, especially in the French sample.
Panel B of Table 1 shows board characteristics. Boards are larger and the proportion of independent directors (i.e., non-executive directors who are classified as independent by BoardEx) is lower in the French sample. The average board size in France is very similar before and after 2010. Before 2010, both France and the US had similar proportions of female directors: 9% and 8%, respectively. After 2010, there is a significant change: France now has 19% of female directors, while the US has 9%. This difference is, of course, explained by France introducing a quota in January 2011.
3.2 Director characteristics
The sample includes 35,233 firm-year observations for France and 521,948 director-firm-year observations for the US. In our regressions we use only outside (i.e., non-executive) directors, thus we also exclude 6,913 director-firm-year observations for France, and 92,357 director-firm-year observations for the US, where the director is an executive of the firm. Finally, we exclude 2,916 director-firm-year observations for France and 8,297 for the US. with missing values for age and tenure. The final sample used in the regression models consists of 21,367 director-firm-year observations for France and 344,552 for the US over the period 2003 to 2014.
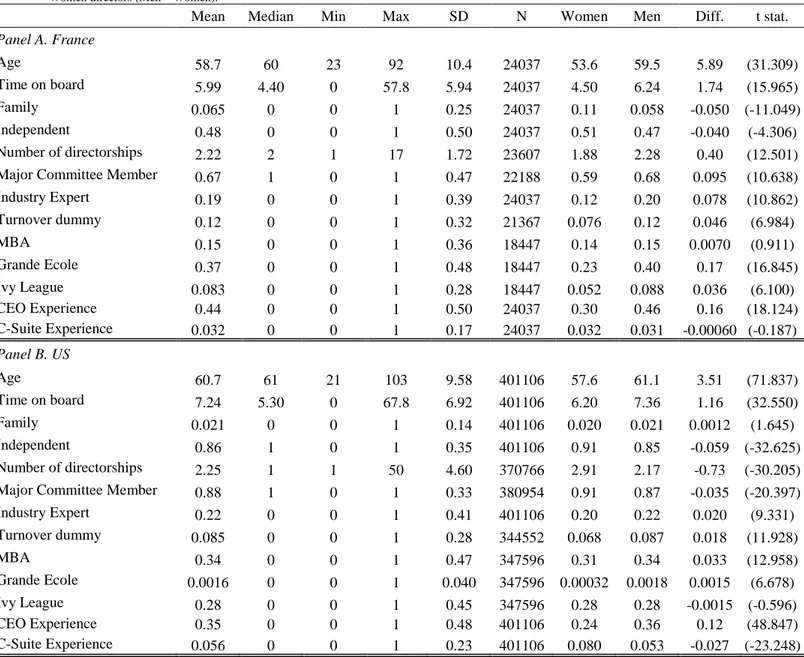
Table 2 compares outside director characteristics between France and the US by gender. In this table, we restrict the sample to outside directors, and include only observations for which age and tenure data are available.10 Relative to male directors, female directors are younger and
more independent, both in the US and in France. However, female directors on French boards are more likely than their male counterparts to be family members, defined (following Ahern and Dittmar, 2012) as directors who share the same last name as another board member.
Overall, there is a gender gap in terms of expertise and board experience, which is slightly more pronounced in France than in the US. Among French boards, female directors hold a lower number of board seats (1.88 seats for female directors versus 2.28 seats for male directors, on average), while among US boards the reverse is true (2.91 seats for female directors versus 2.17 seats for male directors, on average). Moreover, in France, female directors are much less likely to be member of a major committee (audit, compensation, nomination, or governance committees) than in the US. The gender gap in terms of industry expertise is larger in France than in the US (8% in France versus 2% in the US).
In France, female directors are also less likely to be a graduate from a set of nine elite
Grandes Ecoles.11 The difference is substantial: While 40% of all male directors come for this small set of schools, only 23% of female directors hold similar degrees. This is not surprising, given that Grandes Ecoles (especially Ecole Nationale d’Administration and most engineering schools) include (even until recently) only a small proportion of female graduate students. In our sample, the school with the lowest representation of female directors is Ecole Polytechnique, with slightly less than 3% of female directors among its graduate-directors.12 By contrast, in the US, 28% of all directors hold an Ivy League degree, with no difference between male and female directors.
3.3 Turnover rates
To construct turnover rates, we follow the same procedure as in Bates, Becher, and Wilson (2016). We follow a director from one firm-year board report date on BoardEx to the next, where a report date corresponds to the fiscal year end. Directors who are no longer listed at a subsequent report date are classified as turnover directors, while those who remain listed are
11 We consider the following schools as elite Grandes Ecoles: Ecole Polytechnique Paris, Corps des Mines, Mines
Paristech, Centrale Paris, Ecole des Ponts Paristech, Telecom Paristech, Supelec, HEC Paris, and ENA.
12 Tables IA.2 to IA.8, in the Internet Appendix, show detailed descriptive statistics of director characteristics for
classified as non-turnover directors. We cannot measure director turnover when the firm is no longer available in the database the next year. As a result, the sample excludes 4,037 firm-director-year observations for France, and 76,742 firm-firm-director-year observations for the US, for which we cannot identify director turnover.
The unconditional director turnover rates are on average higher in France than in the US and, accordingly, the average director tenure is lower in France (see Table 2). In both the US and France, female directors spend less time on boards than their male counterparts: The board tenure of female directors is on average 1.74 (1.16) years lower than that of male directors in France (US). Female board members are much less likely than male directors to quit boards in any given year: Female directors have lower turnover rates than male directors. These differences in turnover rates are also much larger in France than in the US (4.6% in France versus 1.8% in the US).
4 Descriptive Evidence
Figure 1 shows the speed of adjustment to the new law. While the average proportion of women on French boards is 10% in 2009, it rises monotonically to 25% in 2014.
Firms may adjust to the new requirements in two ways: They may increase the number of female directors and/or reduce the number of male directors. By reducing the size of the board through the dismissal of some male directors, firms may be able to comply with the law without needing to employ many female directors. Figure 2 shows that, on average, firms did not choose such a strategy. The average board size in the unbalanced sample appears to decline both before and after the quota, but this is mostly a composition effect. In balanced samples, we can see that the average board sizes do not change much: For the same set of firms, board sizes in 2014 are very similar to their 2007 levels. This figure does suggest, however, that new entrants to the sample have smaller boards on average.
Figure 3 confirms that most of the adjustment occurs through the selection of new directors: The proportion of newly-appointed directors who are female jumps from about 13% in 2009 to 32% in 2010, and continues to rise afterwards, reaching 50% in 2014. This figure clearly shows that the quota changed firms’ director selection process very quickly. Since the law only passed in January 2011, the significant increase in the proportion of women among new directors
in 2010 suggests that some firms anticipated the passing of the law (see the discussion in Section 2). We see no evidence of anticipation in 2009 or earlier. Figure 3 also shows that, even after the quota, most newly-appointed directors are men.
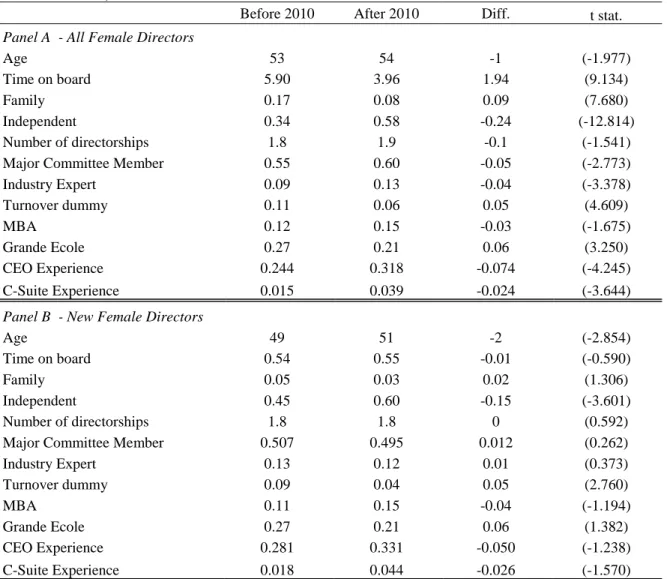
Since firms chose to appoint so many female directors so quickly, a natural question is whether firms have lowered the standards for selecting new female directors. Panel A of Table 3 shows a comparison of female director characteristics before and after the quota. Perhaps the most striking conclusion from this table is that, along a number of relevant dimensions, post-quota female directors appear to have better attributes on average. Post-post-quota female directors are older, have more CEO and C-suite experience, and are more likely to be assigned to major committees, to be industry experts, and not less likely to hold an MBA degree. They have spent significantly less time on their boards, which is to be expected, because many of these directors have only been appointed because of the quota. Post-quota women are also more independent and less likely to be related to the families that control their firms.13 Interestingly, despite having better qualifications in most dimensions, post-quota female directors are less likely to be graduates from an elite Grande Ecole. Finally, we note that the average female turnover rate falls from 11% to 6%.
Panel B shows a comparison between newly-appointed women before the quota and newly-appointed women after the quota. Panel B confirms that post-quota new appointments are slightly older and more independent. Post-quota female directors are again less likely to be
Grande Ecole graduates; the difference is exactly the same as in Panel A, but now it is not
statistically significant (Panel B has a much smaller sample size). All other observable characteristics are, however, very similar. Again, we find significant differences in turnover rates: Post-quota new female directors have a 4% turnover rate, which is substantially lower than the 9% rate for new appointments before the quota.
This simple comparison allows us to draw some preliminary conclusions. On the basis of observable characteristics, there is no evidence that firms select post-quota female directors who are less qualified than pre-quota female directors. There is clear evidence that post-quota female directors are more independent, measured either by family ties or by formal director independence. This latter finding mirrors the evidence from Norway (see Bøhren and Staubo,
13 This is in contrast with the case of Norway, where post-quota women are more likely to be related to the
2014). Whether independence is good or bad however depends on the context (see e.g., Adams and Ferreira, 2007 and 2009).
In Table IA.9, in the Internet Appendix, we replicate Table 3 for male directors. The main finding is that there is little difference in male turnover rates before and after 2010. For all male directors, the turnover rates before and after the quota differ only by 0.4 percentage points. For newly appointed male directors, turnover falls from 9.2% to 8.1% after the quota, a change that is not statistically significant, despite the fact that the male director sample is much larger than the female director sample. Table IA.9 also shows an important result: Post-quota male directors are also less likely to be Grande Ecole graduates.
Figures 4 and 5 show the annual average turnover rate for both men and women over our sample period. The turnover rate for men looks stable over the years and, consistent with the discussion above, does not seem to be much affected by the introduction of the quota. The female turnover rate is much more variable, as is to be expected from a much smaller sample, but does not appear to differ much from the male rate until 2010. After 2010, we observe a persistent gap between these two rates.
Note that we only observe a turnover gap from 2011. Although there are many quota-induced female appointments in 2010, turnover for such appointments obviously can only be observed in 2011. The fact that we do not see a turnover gap in the years just before the quota – 2009 and 2010 – strengthens the hypothesis that such a gap is a consequence of the quota.
5 Empirical Strategy
Here we describe our empirical strategy. Let 𝑦𝑑𝑓𝑡 be an indicator variable that equals 1 if director 𝑑 leaves firm 𝑓 at the end of fiscal year 𝑡, and zero for all 𝑡′< 𝑡, and let 𝑤
𝑑 take the
value of 1 if director 𝑑 is female and zero otherwise. We use 𝑦 and 𝑤 to denote the random variables associated with these indicators. We define the gender turnover gap as
𝑔 ≡ 𝐸(𝑦|𝑤 = 0) − 𝐸(𝑦|𝑤 = 1). (1)
In words, the turnover gap is the difference between the average turnover rates of male and female directors. We can estimate 𝑔 by a simple regression of 𝑦𝑑𝑓𝑡 on 𝑤𝑑 and a constant.
The existence of a turnover gap may be a consequence of endogenous matching of firms and directors. For example, large, mature, better performing, and stable firms may provide more job stability, which could be a characteristic favored by female directors. It is likely that characteristics that are relevant for matching, such as e.g., firm performance, change over time. We thus use firm-year fixed effects 𝛼𝑓𝑡 to eliminate all sources of variation at the firm-year level. Such an approach means that our estimates of the residual turnover gap (i.e., after accounting for firm-year fixed effects) are free from any time-varying endogenous matching at the firm level, including the possibility that directors have a higher probability of turnover after periods of poor firm performance.
Because we only use within firm-year variation, the turnover gap can only be explained by differences between male and female directors, in the same firm, at the same time. Personal characteristics, such as age, tenure, and others, could explain part or all of this gap, leaving nothing to gender. To account for such possibilities, we include a vector of observable director characteristics, 𝒙𝑑𝑡. The residual turnover gap thus reflects characteristics that are not included in
𝒙𝑑𝑡.
Finally, we consider the effect of the board quota by introducing an indicator variable 𝑝𝑡,
which takes the value of 1 for 𝑡 > 2010, and zero for 𝑡 < 2010,14 and interacting it with 𝑤
𝑑. We
thus have the following regression specification:
𝑦𝑑𝑓𝑡 = 𝛼𝑓𝑡+ 𝑎1𝑤𝑑+ 𝑎2𝑤𝑑𝑝𝑡+ 𝑎3𝑝𝑡+ 𝜷𝒙𝑑𝑡+ 𝑢𝑑𝑓𝑡. (2)
Note that 𝑝𝑡 is absorbed by the fixed effects and, therefore, 𝑎3 is not directly recoverable. The effect of the quota on the (residual) turnover gap is thus given by:
𝑔𝐵𝐴 ≡ 𝐸(𝑔|𝑝 = 1, 𝛼, 𝒙) − 𝐸(𝑔|𝑝 = 0, 𝛼, 𝒙) = −𝑎
2, (3)
which can be directly estimated from (2). An estimator for 𝑔𝐵𝐴 is a before-after estimator of the
average effect of the quota on the turnover gap.15
14 2010 is omitted because it is a difficult year to classify.
15 Because our goal is to estimate partial effects, as in (3), we use linear probability models. An alternative is to use
A before-after estimator is all we need if we assume that the gender gap was not trending over time. Although Figure 4 shows no clear trend for the difference between male and female turnover rates, we cannot rule out the possibility that the turnover gap changes over time independently of the introduction of the quota. We thus consider US firms as a control group. The advantage of using US firms is that there has been no realistic threat of legal action against those US firms that do not promote gender balance on boards. This is unlike the case of most leading European economies, where such legal actions have been taken or are being seriously discussed. The obvious drawback is that US firms may operate in a very different environment. Differences in turnover rates between France and the US may exist because of differences in competition, regulation, governance practices, and business cultures, among other reasons.
To address this latter concern, we estimate turnover regressions as in (2), but without 𝑝𝑡,
for both France and the US. We find that the empirical determinants of turnover are remarkably similar in both countries (Table 4 below shows the results). This finding suggests that institutional and environmental differences between US and France have little impact on the turnover behavior of corporate directors. This validation exercise increases our confidence that the US is a reasonable control group.
We then run the following regression with data from both France and the US:
𝑦𝑑𝑓𝑡 = 𝛼𝑓𝑡 + 𝑎1𝑤𝑑+ 𝑎2𝑤𝑑𝑝𝑡+ 𝑎3𝑝𝑡+ 𝑎4𝑤𝑑𝑞𝑓+ 𝑎5𝑤𝑑𝑞𝑓𝑝𝑡+ 𝑎6𝑝𝑡𝑞𝑓
+𝑎7𝑞𝑓+ 𝜷𝒙𝑑𝑡+ 𝑢𝑑𝑓𝑡, (4)
where 𝑞𝑓 is an indicator variable that takes the value of 1 if the firm is in France (i.e., the firm is “treated”) and zero otherwise. Notice that 𝑎3, 𝑎6 and 𝑎7 are absorbed by the fixed effects.16 The
difference-in-differences effect of the quota on the (residual) turnover gap is thus given by:
Logit models in the Internet Appendix (Tables IA.10 to IA.16). The estimates for Logit models with fixed effects are statistically stronger than those for linear models, and they confirm all the results obtained with linear models. A problem with Logit models is that we cannot recover the partial effect in (3) without making assumptions about the distribution of the firm-year fixed effects. A similar problem arises with duration models, with the additional problem of incidental parameters associated with fixed effects. This explains our preference for linear models.
𝑔𝐷𝐷 ≡ 𝑔𝐵𝐴(𝑞 = 1) − 𝑔𝐵𝐴(𝑞 = 0) = −𝑎
5. (5)
If the turnover gap has no trends that are unrelated to the quota, then 𝑔𝐵𝐴 = 𝑔𝐷𝐷. Otherwise,
𝑔𝐷𝐷 is preferred.
Our methodology allows us – under the maintained assumptions – to identify the effect of the quota on the residual turnover gap. But what can we say about the effect of the quota on female turnover levels? If we are willing to assume that the quota had no effect on the turnover behavior of men, then 𝑎3 = 0, and 𝑔𝐵𝐴 is now a difference-in-differences estimator of the
average effect of the quota on female turnover rates, and 𝑔𝐷𝐷 is a triple-difference estimator of
this effect. Although we do not make the assumption that 𝑎3 = 0, we note that, empirically, 𝑎3 indeed appears to be very close to zero. Therefore, in practice it does not make much difference which interpretation we follow: Changes in the gender gap are almost identical to changes in female turnover rates.
6 Main Empirical Results
6.1 The effect of the quota on female director turnover
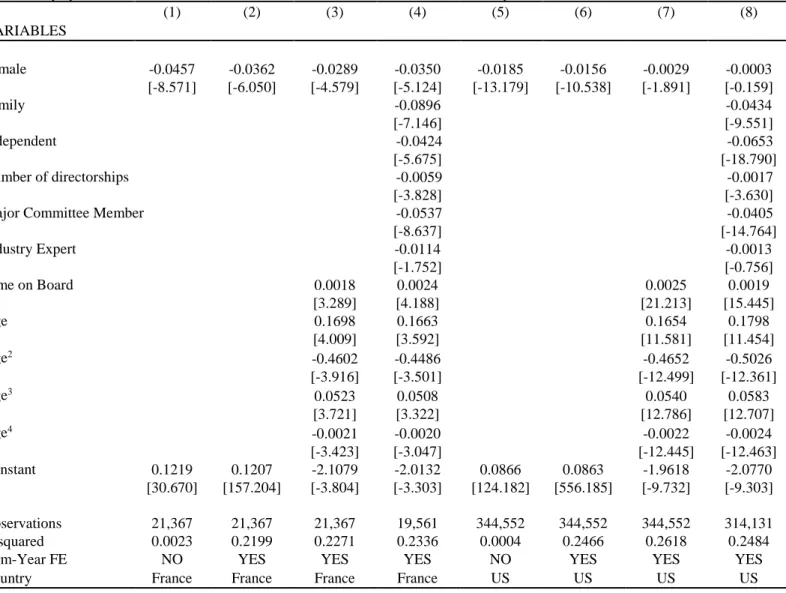
Table 4 shows the outputs of regressions of the turnover variable on the female indicator and other controls, for France (Columns 1 to 4) and the US (Columns 5 to 8), for the whole period of 2003-14. Column 1 shows the estimate of the gender turnover gap in a simple regression without any controls or fixed effects. We find that the “raw” turnover gap in France is 4.6%. Then, in Column 2, we add firm-year fixed effects. The gap falls by roughly 21%, and is now 3.6%. Endogenous matching of firms and directors explain only a small fraction of the gap. In Column 3, we add a measure of director tenure (number of years on the board) and a fourth-order polynomial of age.17 The measured gap is now 2.9%. In Column 4, we add five additional director-level covariates: the number of additional directorships, and indicators for (possible) family connections, independence, membership in major committees, and industry expertise. The number of observations now falls because of some missing data. We see that all director-specific variables appear to affect turnover in a statistically precise way, with the exception of industry
17 Fourth-order polynomials – or quartics – of age are typically used in labor economics when studying gender
expertise, which is only borderline significant. There is an economically and statistically significant gender turnover gap of 3.5%. Adding even more director characteristics reduces sample size but has little impact on the gender gap (we consider educational variables in Table 6).
Columns 5 to 8 replicate the same exercise for US firms. From Column 5 we see that a gender gap also exists in the US, although it is much lower: 1.85%. Note that male turnover is also lower in the US than in France, which is compatible with the hypothesis that the US market for corporate directors is more developed, and thus more stable.18 Column 6 reveals that, as in France, firm-year effects explain only a small portion of the gender gap, which is now 1.56%. The most important difference arises in Column 7: After controlling for tenure and age, the gender turnover gap all but disappears. The estimated gap of 0.29% is economically irrelevant and borderline statistically significant, despite the very large sample. Once the additional controls are added, the turnover gap is obliterated: It is now 0.03% with a t-statistic of 0.16. With a sample size of more than 300,000 observations, we can safely conclude that there is no residual gender tenure gap in the US.
Table 4 allows us to draw two important conclusions. First, firm-year effects and director characteristics cannot fully explain the gender turnover gap in France. By contrast, firm-year effects and director characteristics – in particular age and tenure – explain all of the turnover gap in the US, leaving no room for pure gender effects. In the US, male and female turnover rates are essentially identical to one another, once other characteristics are controlled for. We conclude that there is something specific to French directors, which is not yet captured by the covariates included in our empirical model.
Second, comparing Columns 4 and 8, we find that, with the above noted exception of the gender gap, the empirical determinants of turnover are strikingly similar in both countries. Note that not only all coefficients share the same signs, but their magnitudes are very similar too. The effects of tenure and age are, in particular, very similar. The shape of the age polynomial is remarkably similar, differing only by a level effect. Because constant level effects are differenced out in difference-in-differences estimations, the comparison between Columns 4 and 8 suggests that, at least for the purpose of estimating director turnover, the US is indeed a good control group for France.
18 See Section 7 for interpretation.
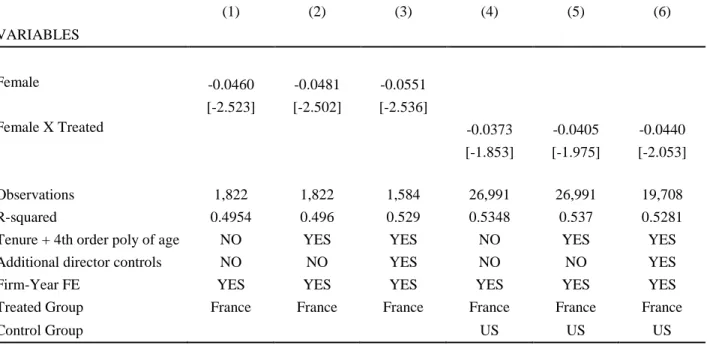
Table 5 displays our main results. In Columns 1 to 4 we run increasingly more saturated versions of the model in (2), from no controls to a full set of controls. In Column 1 we see that, even without any control variable or firm-year effect, the turnover gap is fully explained by the years after the quota. Our before-after estimate of the effect of the quota on the turnover gap is 5.14%. Note that the coefficient of the post-2010 dummy is economically negligible and statistically insignificant. This indicates that the turnover gap is fully explained by a reduction in female turnover after the quota; male director turnover does not seem to be affected by the quota. Thus, we reach the same conclusions independently of whether we interpret the results as a reduction in the gap or as a reduction in female director turnover. Columns 1 to 4 show estimates of the gender gap that range between 3% and 5%. In sum, the post 2010 period explains virtually all of the residual gender gap reported earlier in Table 4.
Columns 5 to 8 show the difference-in-differences estimates as in model (4), using the US as a control. We find estimates of the gender turnover gap that are remarkably similar to those obtained through before-after estimators, suggesting that there are no trends in the differences between female and male turnover rates that confounded the before-after estimates.
We have not used educational variables as covariates in the regressions in Tables 4 and 5, because missing data reduce the sample size significantly. For robustness, in Table 6 we present the results of the full-model regressions when we include an MBA dummy, a Grande Ecole dummy (for France), and an Ivy League dummy (for the US) among the set of director characteristics. We find that the quota effects appear stronger when educational variables are included, with estimated effects in the 4.2%-4.7% range for the full model, in contrast with an effect of about 3% in Table 5.19
We conclude that the French quota has reduced female director turnover. This effect is quite robust and about 3 to 5 percentage points, depending on the specification and the sample.
19 Tables IA.17 to IA.24, in the Internet Appendix, present additional results after controlling for whether directors
are foreigners, have CEO experience, and C-Suite experience. The estimates of the effect of the quota are very similar.
6.2 Why does female director turnover fall?
In this section, we consider additional cuts of the data to investigate some of the reasons why female director turnover falls.
One possibility is that, after the quota, turnover falls because firms become more reluctant to let incumbent female directors go. This would happen if the cost of replacing female directors increases after the quota (that is, if the quota worsens the firm’s outside options; see Section 7). This hypothesis predicts that the gender gap should increase both for existing appointments and for new appointments.
Table 7 shows before-after and difference-in-differences estimates of the effect of the quota on the gender turnover gap, after we restrict the sample to appointments (male and female) made before 2010. We see that, in this sample, the effect of the quota is weaker than that in the unrestricted sample. The quota effect now ranges between 2.3%-3.2% and fails to be statistically significant when all controls are included. These estimates suggest that the quota effect is stronger for post-2010 appointments. Table 8 confirms this suggestion. There we see that the quota effect for new appointments after 2010 ranges from 3.7% to 5.5%, and this effect appears stronger when more controls are included.
What can we conclude? One may think that the stronger effect for new appointments is a somewhat mechanical effect, because new appointments are less likely to be terminated in the near future than old appointments. But note that this cannot be the case, because the turnover gap compares new female appointments with new male appointments; any mechanical effect should also affect new male appointments. In fact, we see from the evidence in Section 3 that turnover for new male appointments after the quota is only slightly lower than that for pre-quota new male appointments (the difference is not statistically significant). It must then be that female director-firm matches formed after the quota are more stable than pre-quota matches.
Another possible explanation for this evidence is as follows. After the quota, firms may hire a number of inexperienced female directors, who have poor outside opportunities, and thus display low voluntary turnover. For this explanation to be true, we need newly-appointed inexperienced directors to display lower turnover rates than newly-appointed experienced directors. Table IA.31 (in the Internet Appendix) shows that, if anything, the opposite is true: experienced directors appointed after the quota have lower turnover rates than “rookie” directors;
the difference is economically but not statistically significant. We conclude that the stronger reduction in turnover for new appointments is not explained by rookie directors with few outside options; experienced directors with new appointments are at least as likely to display lower turnover rates than rookie directors.
It is possible that, when recruiting directors, some boards rely more on some observable director characteristics than others. There is evidence that networks based on common educational backgrounds affect the selection of executives and directors in France (Nguyen (2012); Kramarz and Thesmar (2013)). Thus, here we investigate the effect of board elitism, measured by the proportion of Grande Ecole and Ivy League graduates on the board (we include Ivy League graduates to construct a similar variable for US firms).
With one more interaction, interpreting the coefficients becomes more difficult, so it is important that we define formally which effects we want to estimate. Let 𝑒 be a dummy variable that equals 1 if the board has a proportion of elite school graduates that is below the sample median. We are interested in three quantities (we omit the conditioning variables 𝛼 and 𝒙 to simplify notation):
𝑔(𝑒 = 0) ≡ 𝐸(𝑔|𝑝 = 1, 𝑒 = 0) − 𝐸(𝑔|𝑝 = 0, 𝑒 = 0) (6) 𝑔(𝑒 = 1) ≡ 𝐸(𝑔|𝑝 = 1, 𝑒 = 1) − 𝐸(𝑔|𝑝 = 0, 𝑒 = 1)
∆𝑔(𝑒) ≡ 𝑔(𝑒 = 1) − 𝑔(𝑒 = 0).
In words, 𝑔(𝑒 = 0) is the effect of the quota on the turnover gap for low-elitism boards, 𝑔(𝑒 = 1) is the effect of the quota on the turnover gap for high-elitism boards, and ∆𝑔(𝑒) is the effect of the quota on the difference in turnover gaps between high-elitism boards and low-elitism boards.
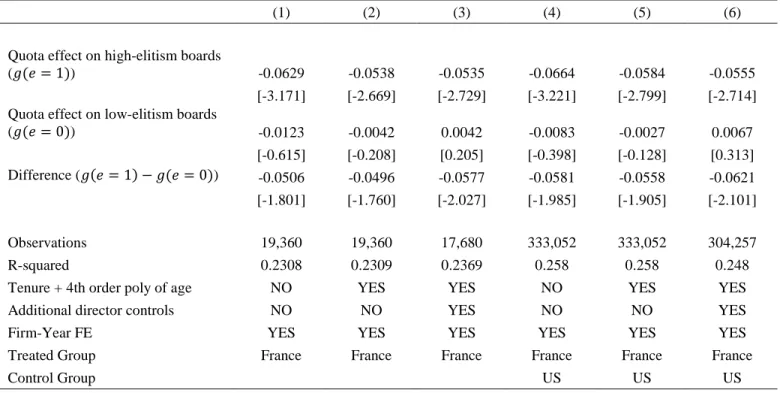
Table 9 presents both before-after and difference-in-differences estimates for the effects in (6). We find that the quota has an economically strong and statistically precise effect on the turnover gap for high-elitism boards: Our estimates all lie in a narrow range between 5.4% and 6.6%. By contrast, the quota has virtually no effect on the turnover gap for low-elitism boards. Finally, the difference between the two effects is about 5 percentage points.
As before, we also split the sample into pre 2010 appointments and post 2010 appointments. Table 10, Panel A, shows that, for pre 2010 positions only, the effect of the quota
for high-elitism board is a bit weakened: It ranges from 3.4% to 4.4%, and its significance is sometimes marginal. As before, the quota effect on low-elitist boards is small and statistically insignificant. Panel B considers post 2010 appointments and shows an even stronger effect of the quota on the turnover gap for high-elitism boards: Our estimates now lie between 5.5% and 7.4%. Again, we see virtually no effect on low-elitism boards. The difference between the two is large – between 4.7 and 6.8 percentage points – but fails statistical significance tests, probably because of the reduction in sample size (there are only 1,882 new appointments in France after 2010).
There are many firm characteristics that could be related to board elitism. Is board elitism just a proxy for other important characteristics that affect turnover? We have investigated some of the main candidate variables: We considered sample splits on firm size, industries with high versus low number of female employees, the fraction of women on boards pre-2010,20 (partial) government ownership, and firm location (Paris versus the rest of the country). The effect of the quota on turnover does not seem to vary across these characteristics (results are omitted for brevity, but available in the Internet Appendix, Tables I.25 to I.29).
In sum, French boards that rely more on educational networks are the ones most affected by the quota. Female directors hired by those boards after the quota experience much lower turnover rates (relative to men) than before. Again, this effect is particularly strong for new appointments.
6.3 Has the quota improved female director job market opportunities?
An additional effect of gender quotas on female director turnover operates through the labor market for directors. Board quotas increase the demand for female directors and thus improve their job market opportunities. With more opportunities, experienced female directors may choose to work only for some of the best companies. Such directors may then voluntarily depart from boards that they no longer find attractive. This labor market effect increases voluntary turnover.
20 Note that splitting the sample by the proportion of women on boards before the quota is exactly equivalent to
Figure 6 shows the number of directorships held by directors appointed before 2010, for three cohorts of incumbent directors: 2007, 2008, and 2009. While the number of directorships held by incumbent men appears fairly stable from 2007 to 2014, the number of directorships held by incumbent female directors increases significantly from 2010. For example, female directors who are incumbents in 2007 experience an increase in their average number of directorships from 1.7 seats in 2007 to 2.6 seats in 2014. While in 2007 this cohort holds significantly fewer board seats than its equivalent male cohort, in 2014 the same cohort holds more seats than its male counterpart. Finally, notice that earlier cohorts tend to hold more seats throughout the sample period than later cohorts, suggesting that experience is a valuable attribute in the market for corporate directors.
Figure 6 shows clear evidence that the quota has improved the job market opportunities of experienced female directors. If the quota significantly improves the market for incumbent female directors, such directors may “cherry pick” the boards on which sit: They can now afford to leave poor-performing firms because there are additional seats available to them. We then have an apparent puzzle: When faced with more opportunities for board appointments, shouldn’t female directors display higher turnover rates? Directors cannot hold too many seats, either because of regulations21 or simply because they may not have sufficient time available. Directors may also choose to depart from boards of poor performing or volatile firms to avoid negative reputational effects (see e.g., Fahlenbrach, Low, and Stulz, 2016).
Our evidence shows that turnover rates decrease for both new and existing appointments (see Tables 7 and 8). This effect is, however, weaker for existing appointments, which is consistent with the hypothesis that female directors become more likely to engage in cherry-picking behavior after the quota. To investigate the cherry-cherry-picking hypothesis more directly, we estimate the effect of the quota on the turnover gaps for low and median/high performing firms. We define a low-performance indicator as a dummy variable that takes the value of 1 if the ROA (return on assets) of firm f in year t is in the lowest quintile relative to other firms in the benchmark. We use a set of European firms as the benchmark for France and US firms as the benchmark for the US. The use of percentiles of performance is standard in the most recent literature on CEO and director turnover (see, e.g., Jenter and Lewellen, 2016; Jenter and Kanaan,
21 French regulations recommend that a non-executive director should not hold more than five directorships in listed
2015; Bates, Becher, and Wilson, 2016) and helps substantially when interpreting the results. The choice of the lowest quintile as a measure of poor performance is made for convenience; different thresholds lead to similar results.
Table 11 reports the results in which we interact the poor-performance dummy with the quota and the female dummy. In the sample of pre 2010 appointments, we find that the quota
reduces the turnover gap for low-ROA firms: This effect ranges from 15,3% to 18,4%. The
difference in the turnover gaps between low-performing and high/median-performing firms ranges between 18,6 to 21,6 percentage points and is statistically significant. By contrast, in the sample of post 2010 appointments, the quota increases the turnover gap for both low and high/median performing firms and the difference between the two groups is never statistically significant.
In the internet appendix, we replicate the analysis in Table 11, now using the absolute value of the change in ROA as a measure of recent volatility. In the sample of pre 2010 appointments, the gender gap increases for volatile firms and decreases for firms with stable profitability. The difference in the turnover gap between volatile and stable firms ranges between 18.9 to 20.8 percentage points and is statistically significant. Similar to previous results for profitability, in the sample of post 2010 appointments, the difference in impact on turnover gap between volatile and stable firms is not statistically significant.
We conclude that, after the quota, experienced female directors are more likely to depart from poor-performing and volatile firms than experienced male directors. This evidence and the evidence of a disproportionate increase in board appointments for experienced female directors jointly suggest that the quota has allowed these directors to cherry pick the boards on which they sit.
7 Interpretation
7.1 The effect of the quota on female turnover rates: Possible explanations
In the Appendix, we provide a simple theoretical framework that is helpful for interpreting the evidence. Here we present an informal version of this framework.
𝑄𝑓𝑑 ≡ 𝑆𝑓𝑑− 𝑉𝑓− 𝑈𝑑, (7)
where 𝑆𝑓𝑑 is the gross surplus from the match (or the internal match quality), and 𝑉𝑓 and 𝑈𝑑 are the parties’ outside options, for the firm and the director, respectively. We may interpret these outside options as what each party expects to receive under an alternative match, minus searching and matching costs. Because a match should be continued only when the net surplus is sufficiently high, it is natural to interpret 𝑄𝑓𝑑 as a measure of (net) match quality. This implies that the probability of turnover is decreasing in match quality (the Appendix formalizes this claim).
It is important not to confuse match quality with shareholder value; increases in match quality can actually reduce firm value, for two reasons. First, note that the unit of analysis is a firm-director pair (𝑓, 𝑑), and thus 𝑄𝑓𝑑 measures the joint net surplus from this match, without any reference to how this surplus is shared between the parties. An increase in net surplus that is accompanied by an increase in directors’ bargaining power can thus reduce shareholder value. Second, an important aspect of (7) is that the firm is represented by its controlling agent (i.e., the party who effectively controls board appointments), such as the CEO or a controlling shareholder. The controlling agent maximizes her objective function, which may include private benefits. To give a concrete example, suppose that the quota is used as an excuse to appoint some of the controlling agent’s female relatives to the board. This may increase match quality from the joint perspective of the controlling agent and the director, but it is certainly bad news for the non-controlling shareholders.
What is the effect of a board gender quota on match quality? The effect of the quota on outside options is unambiguous: Because the quota increases the demand for female directors, if director d is female, 𝑉𝑓 decreases and 𝑈𝑑 increases. By contrast, the effect of the quota on the gross surplus from the match, 𝑆𝑓𝑑, is ambiguous. Note the quota can only affect 𝑆𝑓𝑑 by influencing the formation of new matches. If the quota induces firms to hire less-qualified female directors, 𝑆𝑓𝑑 falls after the quota. On the other hand, if the quota induces firms to hire more-qualified female directors, 𝑆𝑓𝑑 increases after the quota.