HAL Id: tel-03200594
https://pastel.archives-ouvertes.fr/tel-03200594
Submitted on 16 Apr 2021
HAL is a multi-disciplinary open access
archive for the deposit and dissemination of sci-entific research documents, whether they are pub-lished or not. The documents may come from teaching and research institutions in France or abroad, or from public or private research centers.
L’archive ouverte pluridisciplinaire HAL, est destinée au dépôt et à la diffusion de documents scientifiques de niveau recherche, publiés ou non, émanant des établissements d’enseignement et de recherche français ou étrangers, des laboratoires publics ou privés.
Synthèse et caractérisation de différentes nanoparticules
up-conversion à base de fluorures cubiques dopées
Yb/Er dans le NIR au VIS
Zhenyu Yang
To cite this version:
Zhenyu Yang. Synthèse et caractérisation de différentes nanoparticules up-conversion à base de flu-orures cubiques dopées Yb/Er dans le NIR au VIS. Matériaux. Université Paris sciences et lettres, 2019. Français. �NNT : 2019PSLEC031�. �tel-03200594�
Préparée à Chimie ParisTech
Synthèse et Caractérisation de Différentes
Nanoparticules Up-conversion à Base de Fluorures
Cubiques Dopées Yb/Er dans le NIR au VIS
Soutenue par
Zhenyu YANG
Le 17 décembre 2019
Ecole doctorale n° 397
Physique et Chimie des
Matériaux
Spécialité
Chimie Physique
Composition du jury : Géraldine, DANTELLE
CR, INSTITUT NEEL, CNRS Rapporteur
Nathalie, DUPONT
PR, CSPBAT, Université Paris Nord Rapporteur
Souad, AMMAR
PR, ITODYS, Université Paris Diderot Président
Patrick, GREDIN
MCF, CNRS, ENSCP, Université PSL Examinateur
Michel, MORTIER
DR, CNRS, ENSCP, Université PSL Directeur de thèse
blissement de préparation de la thèse
Acknowledgement
I
Synthesis and characterization of Yb/Er co-doped different
cubic fluoride-based NIR to VIS up-conversion
nanoparticles
Acknowledgement
This work was carried out in the Institut de Recherche de Chimie Paris (IRCP), Chimie-Paristech CNRS of Paris-Sciences-et-Lettres (PSL) University, supervised by Prof. Michel Mortier and Prof. Patrick Gredin. The financial support is from the China Scholar Council (CSC).
First of all, I would like to express my deep and sincere thanks to my supervisors Prof. Michel Mortier and Prof. Patrick Gredin for their continuous guidance and help. Thanks for sharing of immense knowledge and endless help on all aspects of this work. Their encouragement helped me to pass through the hard times in process of pursuing the PhD degree.
Besides, I also want to express my sincere thanks to Prof. Géraldine Dantelle and Prof. Nathalie Dupon for reviewing the thesis and for the valuable insightful comments.
I would like to thank Karmel de Oliveira Lima for her help and advice for this thesis work. I wish to thank Prof. Gerard Aka for his care and help.
Thank Patrick Aschehoung for his help in photoluminescence spectra and luminescence lifetime characterization. I express my gratitude to Patricia Beaunier and Philippe Vermaut for their help in the measurement of transmission electron microscope (TEM). Thanks Prof. Zhuoying Chen and Dr. Hengyang Xiang from
Acknowledgement
II
ESPCI for their help in the measurement of the internal quantum yield.
I express my thanks to the colleagues and staffs in IRCP for the good working atmosphere. It is impressed that some of you gave me assistance in my characterization experiment.
Thank China Scholar Council for providing the founding and support in this thesis work for the whole three years.
I also want to express great thanks to my parents for their never-ending support and encouragement through the work.
Content
iContent
Acknowledgement ... I Content ... i Introduction ... 1Chapter 1 State-of-the-art of up-conversion in RE-doped solids ... 5
1.1 Historical background and development of up-conversion in RE-doped solids ... 5
1.2 The mechanisms of up-conversion process ... 6
1.2.1 Excited-state absorption ... 7
1.2.2 Energy-transfer up-conversion ... 7
1.2.3 Photon avalanche ... 8
1.2.4 The efficiency of different mechanisms ... 9
1.3 The constitution of up-conversion nanoparticles ... 9
1.3.1 Host materials ... 10
1.3.2 Activators ... 15
1.3.3 Sensitizers ... 20
1.4 Fluoride-based up-conversion nanoparticles ... 21
1.5 Applications of up-conversion nanoparticles ... 23
1.5.1 Biology analytical applications ... 23
1.5.1.1 Biology assays ... 23 1.5.1.2 Chemical sensors ... 24 1.5.1.3 Biological imaging ... 24 1.5.2 Lasers ... 25 1.5.3 Diodes ... 25 1.5.4 Displays ... 26
1.5.5 Inks for security printing ... 26
Content
ii
1.6 Conclusion ... 28
Chapter 2 Experimental section ... 31
2.1 Reagents and materials ... 31
2.1.1 Precursors utilising in KYF4:10%Yb/5%Er UCNs ... 31
2.1.2 Precursors utilising in BiF3:10%Yb/5%Er UCNs ... 31
2.1.3 Precursors utilising in K0.3Bi0.7F2.4:10%Yb/5%Er UCNs ... 31
2.1.4 Precursors utilizing in BaYF5:20%Yb/2%Er coated with BaYF5 UCNs... 32
2.2 Synthesis procedure ... 32
2.2.1 Synthesis method of KYF4:10%Yb/5%Er ... 32
2.2.2 Synthesis method of BiF3:10%Yb/5%Er ... 33
2.2.3 Synthesis method of K0.3Bi0.7F2.4:10%Yb/5%Er ... 34
2.2.4 Synthesis method of BaYF5:20%Yb/2%Er@ BaYF5 ... 35
2.3 Characterization experiment ... 36
Chapter 3 Results and discussion ... 41
3.1 KYF4:10%Yb/5%Er ... 41 3.1.1 Structure ... 42 3.1.2 Morphology ... 49 3.1.3 Photoluminescence properties ... 52 3.1.4 Conclusion ... 65 3.2 BiF3:10%Yb/5%Er ... 67 3.2.1 Structure ... 68 3.2.2 Morphology ... 78 3.2.3 Photoluminescence properties ... 81 3.2.4 Conclusion ... 90 3.3 K0.3Bi0.7F2.4:10%Yb/5%Er ... 91 3.3.1 Structure ... 91 3.3.2 Morphology ... 98
Content
iii
3.3.3 Photoluminescence properties ... 101
3.3.4 Conclusion ... 110
3.4 BaYF5:20%Yb/2%Er coated with BaYF5 ... 111
3.4.1 Structure ... 111
3.4.2 Morphology ... 115
3.4.3 Photoluminescence properties ... 118
3.4.4 Conclusion ... 124
Chapter 4 General conclusion and perspective of UCNs ... 125
4.1 General conclusion ... 125
4.2 Perspective of UCNs ... 127
Bibliography ... 129
Content
Introduction
1
Introduction
Up-conversion is an anti-Stokes type emission process where the doped activators ions absorb two or more photons from a low energy source to emit a high energy light.1–14 It was discovered and developed by Dr. Auzel in 1966. And then, he presented the principles and application of up-conversion independently.8,13 A normal schematic diagram of Yb/Er co-doped NaYF4 nanoparticle model was shown in
Figure 1.15
Figure 1 The schematic diagram of the up-conversion process in Yb/Er co-doped NaYF4 nanoparticles model.15
Up-conversion nanoparticles (UCNs) have achieved considerable attentions in recent years owing to many advantages. For instance, low autofluorescence background, the absence of blinking and photobleaching, superior photostability, tunable and sharp-band emission, long lifetimes, and large anti-Stokes shifts.16–21
Among the multitude of reported host materials, the fluoride nanoparticles especially get increasing attentions mainly for their low lattice phonon energy that can reduce non-radiative losses and therefore enhance photoluminescence efficiency.22 In
Introduction
2
combination with its high chemical and thermal stability, it is particularly suitable for NIR to visible conversion.19,23
Though many efforts have been devoted to studying up-conversion materials, it is still far from deep applications for the following several reasons. Firstly, the current widely-used synthesis approaches are cumbersome and stringent.4,24 The stringent conditions lead to the high cost and low repeatability. Secondly, the employ of complex frequently-used organic solvent may have potential hazards when using at high temperature.20 Furthermore, the biggest obstacle of current UCNs is the quite low quantum yield. For example, 100 nm β-NaYF4:20% Yb3+, 2% Er3+ shows 0.3±
0.1% internal quantum yield at 540 nm emission under 980 nm excitation with 150 W/cm2 irradiance.25 It is the most efficient UCNs with the optimum doping concentration of Yb and Er so far. Even so, many published works are far from efficient ones.
The first aim of this thesis is to synthesize and characterize some novel fluoride-based UCNs co-doped with Yb/Er pairs to realize the near-infrared to visible light conversion. This research can enrich the kinds of fluoride-based host materials of UCNs. Additionally, it features simple methods and environment-friendly reagents and solvents. Based on completing the first aim, the second aim is to pick some optimal UCNs from the prepared compounds, which should possess strong emission, long luminescence lifetime, and high up-conversion quantum yield. Such UCNs have potential applications in biological imaging, which needs small nanoparticles, and in solar cells, which needs a long lifetime.
This thesis was organized as follows: After an introduction, Chapter 1 summarized the development and state-of-the-art of up-conversion in RE-doped solids. The
Introduction
3
historical background and development of up-conversion were exhibited. The three normal classic mechanisms of ESA (excited-state absorption), ETU (energy-transfer up-conversion), and PA (Photon avalanche) were presented. The constitution of normal up-conversion materials, including host materials, activators, and sensitizers were introduced, respectively. Meanwhile, some potential applications of UCNs were given.
Chapter 2 described the details of the utilized reagents and materials, synthesis methods and experimental characterization approaches in this thesis work.
Chapter 3 made a specific discussion on the results of the four series of the prepared UCNs, including KYF4:Yb/Er, BiF3:Yb/Er, K0.3Bi0.7F2.4:Yb/Er, and
BaYF5:Yb/Er@BaYF5. The nanocrystal phase structure, calculated average crystallite
size, morphology, nanoparticle size distribution, absorption spectra, internal quantum yield, emission spectra, and the decay times were analyzed and discussed. Meanwhile, the effects of nanoparticles size on photoluminescence were analyzed.
Introduction
Chapter 1 State-of-the-art of up-conversion on RE-doped solids
5
Chapter 1 State-of-the-art of up-conversion in
RE-doped solids
1.1 Historical background and development of up-conversion in
RE-doped solids
For fluorescence light emitters, rare-earth-doped solids usually follow the well-known principle of the Stokes law that simply states excitation photons are at higher energy than the emitted ones.26 For example, down-conversion process is one traditional type of the Stokes emission.27
Nevertheless, up-conversion is an anti-Stokes type emission process in which the emitted photons are at higher energy than the exciting ones.6,10–12 Actually, the anti-Stokes type emission was known to exist before the 1960s at the earliest. For instance, fluorescence anti-Stokes emission (that is so-called thermal bands), or in Raman Effect for the well-known anti-Stokes bands, or “super-excitation” which is raising an already excited electron to a still higher level but with very weak emissions. Unfortunately, the differences of emission energies above the excitation energies in these processes are not higher than about kT.
The concept of up-conversion emission started from an idea that infrared (IR) photons could be detected and counted through sequential absorption within the given ion energy levels by Bloembergen in 1959.28 The initial idea started in a short proposal for an infrared quantum counter (IRQC) detector. However, it was quite difficult to realize sequential photons absorption within the same single doping ion during the limited lifetime of the first excited state.12,13
Chapter 1 State-of-the-art of up-conversion on RE-doped solids
6
In 1966, Auzel found that the luminescence intensity of Er3+, Ho3+, and Tm3+ ions was almost enhanced by two orders of magnitude when doping Yb3+ into the host material under near-infrared light excitation.12–14 Until then, Auzel proposed that the energy transfer could happen between two ions and made the role of energy transfer recognized. In 1973,8 he presented the principles and application of up-conversion accompany with some later reviews by Mita and Nagazawa in 1974,29,30 by Garlick in 1976,31 and by Wright in 1976.32 The emitted energies are found to exceed excitation energies by 10 to 100 times kT in the up-conversion process.
1.2 The mechanisms of up-conversion process
There are many processes that could result in photons conversion from a long wavelength into the shorter ones.33 Among them, only several mechanisms result in up-conversion process and they can be roughly classified into three classes: APTE effect (for “addition de photons par transferts d’energie”) later also named ETU for energy-transfer up-conversion,32 excited-state absorption (ESA), and photon avalanche (PA).33,34 They are collected and reported in several review articles.11,12,35 The Figure 1.1 (a), (b), and (c) shows the ESA, ETU, and PA conversion process occurring in up-conversion, respectively.
Chapter 1 State-of-the-art of up-conversion on RE-doped solids
7
Figure 1.1 The schematic of common mechanisms in up-conversion processes: (a) excited-state absorption (ESA); (b) energy-transfer up-conversion (ETU); and (c) photon avalanche (PA).35
1.2.1 Excited-state absorption
In the case of the ESA process, two pump photons from the excitation laser are successively absorbed by a single ion (Figure 1.1 (a)). Firstly, if the excitation energy is resonant with the transition energy gap value that between the level G and the first-excited metastable level E1, the ion populating on G level will absorb the
excitation energy and populate on E1 level. Afterward, a second absorption occurs
which excites the ion from E1 to the higher level E2 with another pump photon
absorption during the lifetime of this ion on E1 level. Finally, the ion radiatively
decays from E2 to ground state G with up-conversion emission.
1.2.2 Energy-transfer up-conversion
The ETU process is similar to the ESA in that they all utilize successive absorption of at least two pump photons to excite the ions from the ground state to the first-excited
Chapter 1 State-of-the-art of up-conversion on RE-doped solids
8
state E1 and then E2. The difference is the source of the second absorption photon
which excites the ion from E1 to E2 state. In ETU, two different ions participate in the
process. In this case, two neighboring ions absorb the excited photons and populate on E1 state. Then the left ion (Figure 1.1 (b)) non-radiatively relaxes from its excited
level E1 to G state and transfers the energy to the neighboring right ion to promote it
from E1 to the higher E2 state. The following UC process is the same as that of ESA
(Figure 1.1 (a)). In this case, the doping concentration has a strong influence on the up-conversion efficiency as it determines the average distance between the neighboring doping ions.35 Too high doping levels can lead to cross-relaxation between the neighboring ions, resulting in quenching of the excitation energy.
1.2.3 Photon avalanche
Photon avalanche (PA) phenomenon was first discovered in an investigation of the infrared quantum-counter (IRQC) process in Pr3+ doping LaCl3 and LaBr3 crystal by
Chivan et al in 1979.36 PA-induced UC features an unusual pump mechanism (Figure 1.1 (c)). It requires the intensity of the pump is above a certain threshold value. The PA process starts with populating the level E1 by non-resonant weak ground state
absorption. It is followed by resonant ESA to populate upper visible-emitting level E2.
After that, cross-relaxation energy transfer (or ion pair relaxation) occurs between the excited ion and a neighboring ground-state ion, resulting in both ions occupying the intermediate level E1. Finally, the two ions populating on E1 level are further excited
to populate on E2 level by ESA, producing strong UC emission with the avalanche
Chapter 1 State-of-the-art of up-conversion on RE-doped solids
9 1.2.4 The efficiency of different mechanisms
Up-conversion process involves the sequential absorption of two or more photons (Figure 1.1). It is especially different from the multi-photon process where the absorption of photons occurs simultaneously.
Actually, the different mechanisms in up-conversion processes have been recognized to be worked either alone or in combination.12 Different mechanisms, ESA, ETU, and PA, result in different photoluminescence efficiency. The ESA is the least efficient up-conversion process. It requires the excited ion on E1 level to possess
enough long lifetime, which ensures the ion to absorb another photon and to be excited to populate on a higher energy state. However, it was difficult to acquire successive photons absorption for the same single doping ion during the limited lifetime of the first-excited state.12,13 The PA should have the highest efficiency among them. However, the PA depends on pump power and has a long response time (up to several seconds) to excitation due to numerous looping cycles of ESA and cross-relaxation process. In contrast, ETU has a quick response and be independent of the source laser. Therefore, it has been widely used to produce high efficient UC over the past decades. The up-conversion efficiency of ETU is two orders of magnitude higher than that of ESA.12
1.3 The constitution of up-conversion nanoparticles
The up-conversion nanoparticles are usually composed of two sets of elements: host materials which constitute the matrix, and activators which participate in the up-conversion process. The host materials provide the ambient environment and
Chapter 1 State-of-the-art of up-conversion on RE-doped solids
10
determine the average distance between activators in combination with doping levels.33 The activators absorb sequential photons to stimulate from ground state to high emitting-level state and then radiatively decay to ground state.
However, in the case of Er3+, Tm3+, or Ho3+ single-doped UCNs, it is quite difficult to successively absorb another photon after the first absorption for the same ion during the limited first-excited state lifetime.26 In other words, the single-doped UCNs belong to the ESA mechanism whose efficiency is very low owing to only one ion participating in completing up-conversion process. In 1966, Auzel presented that the energy transfer could occur between the two RE ions.8 Afterward, the status of sensitizers was noticed and he presented the ETU mechanism. The sensitizer (e.g. Yb3+) is excited to populate on exciting-level by absorbing the photon and then non-radiatively relaxes back to ground state. Meanwhile, the energy is transferred to the neighboring activators ion (e.g. Er3+), which populates on the first-excited state, to continue populating on a higher emitting-level state.
1.3.1 Host materials
The host materials are quite significant for the activators to generate emission light by absorbing the phonons and radiatively decaying to the ground state. It provides the ambient circumstance for the activators and sensitizers. Among the numerous groups of chemical materials, many of them are all found to have the up-conversion phenomena when doped with suitable activators, such as the frequently-used lanthanide (Ln) ions (Table 1.1). Additionally, the Pr3+ and Ce3+ could also induce a luminescence up-conversion process when doping them into suitable host materials.
37,38
Chapter 1 State-of-the-art of up-conversion on RE-doped solids
11
utilizing of lanthanides as activators is well-known suitable activators.
Table 1.1 Several kinds of host materials from researches of recent decades.
Materials References
Oxides Y2O3;42–44 Gd2O3;45,46 TiO2;47–49 Al2O3;50 ZrO2;51
PbO-Bi2O3-Al2O3-B2O3;52 CaWO4;53 Y3Al5O12(YAG);37,54–57
Y3Ga5O12 (YGG); 38,58
Fluorides NaREF4(RE:La-Lu);12,16,18,23,39,59–63,64–68, LiYF4;37,69–71 KYF4;72–74
KY3F10;75–77 YF3;78,79 LaF3;80–82 CaF2;83,84 SrF2;85,86
Chlorides NaCl;40,87 BaCl2;88,89 SrCl2;90 CaCl2;91 ThCl4;41 CsCdCl3;40
CsCaCl3;92 RbMnCl3;93
Bromides ThBr4;41 CsCaBr3;92
Iodides CsCaI3;92 RbCaI3;94
Oxysulfides Y2O2S;95,96 Gd2O2S;97,98 La2O2S;99–101
Oxyfluorides YOF;102–104 GdOF;104,105 LaOF;104,106
Phosphates YbPO4;107–110 LuPO4;110–112 LaPO4;113,114
Table 1.1 gives some kinds of host materials, including oxide, fluoride, chlorides, bromides, iodides, oxysulfide, oxyfluorides, and phosphate. It indicates that many materials could be utilized as host materials. The trivalent rare-earth ions (Ln3+) have similar ionic size and chemical properties. So, the inorganic compounds are ideal host materials for Ln3+ doping up-conversion materials.35 In addition, alkaline earth ions (Ba2+, Sr2+, and Ca2+) and some transition metal ions, such as Zr, also exhibit close ionic size with lanthanide ions.115 Thus, their inorganic compounds, such as SrF2,
Chapter 1 State-of-the-art of up-conversion on RE-doped solids
12
CaF2, ZrO2, and CaCl2, could also be used as host materials. Besides, rare-earth
oxysulfides (e.g. Y2O2S, Gd2O2S, and La2O2S) have been known for a long time as
excellent phosphor host materials and used in cathode ray tubes, emission displays, and X-ray luminescent screens field. The up-conversion oxysulfide phosphor has higher up-conversion efficiency when compared to the respective oxide. The enhancement in the visible up-conversion efficiency is owing to the lower phonon energy in yttrium oxysulfide when compared to yttrium oxide.
Up to now, the main attention on up-conversion materials is to get high efficiency UCNs. In terms of host materials, the most significant factor affecting the up-conversion efficiency is indeed phonon energy of the host materials. The phonon energy of host materials should be low enough compared with the gap energy between the E1 and the G energy state of activators and sensitizers. It reduces the
non-radiatively relaxation by host lattice and guarantees the doping maximize the radiative up-conversion emission.116
Chapter 1 State-of-the-art of up-conversion on RE-doped solids
13
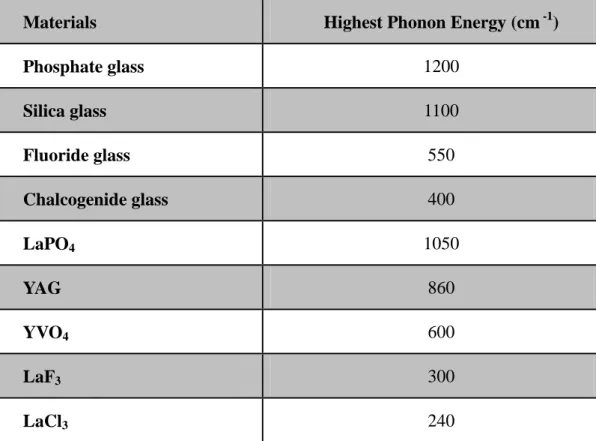
Table 1.2 Highest lattice phonon energy of commonly used Ln3+ doped materials.11,117
Materials Highest Phonon Energy (cm -1)
Phosphate glass 1200 Silica glass 1100 Fluoride glass 550 Chalcogenide glass 400 LaPO4 1050 YAG 860 YVO4 600 LaF3 300 LaCl3 240
Table 1.2 exhibits the highest lattice phonon energy of some common compounds. Heavy halides like chlorides, bromides, and iodides generally exhibit low phonon energies of less than 300 cm−1. However, their utilizing is limited owing to hygroscopic property. The sulfide, oxide, and phosphide have high phonon energy. In comparison, fluoride have lower phonon energy that ranges in 300 to 400 cm-1.11,118
The usually used pump laser is ~ 980 nm pulsed laser whose energy is similar to the
2
F5/2 - 2F7/2 level of Yb3+ around 10,000 cm-1 from Figure 1.3. The host lattice, with
lower phonon energy, has the smaller probability to participate in non-radiative relaxation process. Therefore, the rare-earth doped fluoride UCNs have got numerous and increasing interests in recent decades.
Chapter 1 State-of-the-art of up-conversion on RE-doped solids
14
Figure 1.3 The excitation and decay ways in 4f energy levels of Yb and Er.
The current works on UCNs are done to explore novel host materials with high efficiency that mainly depends on synthesizing well-dispersed and shape-controlled nanoparticles with uniform particle size for a given host lattice. These several factors are known to favor up-conversion efficiency until now but still need more studies to be extended and perfected.5,10,20,119
In addition, crystal structure exhibits significant influences on the photoluminescence properties. For example, the most efficient UCNs, Yb/Er co-doped hexagonal NaYF4, exhibits about one order of magnitude enhancement of
up-conversion efficiency compared with cubic counterparts.120,121 It demonstrates that the crystal structure of the phase is also a significant fact.3,23,65,121–123 The variation of
Chapter 1 State-of-the-art of up-conversion on RE-doped solids
15
the crystal structure in the host materials can significantly affect the optical properties of the nanocrystals. The phase-dependent optical property can be ascribed directly to the different crystal fields around the trivalent lanthanide ions in matrices of various symmetries. Low symmetry hosts typically exert a crystal field containing more uneven components around the doped ions compared to the high symmetry counterparts. The uneven components enhance the electronic coupling between the 4f energy levels and higher electronic configuration and subsequently increase f–f transition probabilities of the doping ions. In addition, the decrease in the cation size (or unit-cell volume) of the host can result in an increase in the crystal field strength around the doping ions and lead to the enhanced up-conversion efficiency.34
Besides, the shape and size of nanoparticles also show great impacts on the photoluminescence efficiency. In this case, the important factor is the quenching ways from some high-frequency ligands onto the surface of the particles, such as NO3-, OH-, CH-,and so on. These high-frequency modes of ligands onto the nanocrystal surface could activate many non-radiative channels to decrease the UC efficiency.2 Sphere nanoparticles have smaller surface-to-volume ratios than nanoparticles with random morphology. Large size particles have smaller surface-to-volume ratios in comparison to small size. The smaller surface-to-volume ratios could result in fewer ligands onto the surface, that subsequently reduce the probability of the non-radiative relaxation to enhance the UC efficiency.
1.3.2 Activators
The activators are the key factor in the whole up-conversion process. They determine the choice of the excitation laser, the emission spectra, and the photoluminescence
Chapter 1 State-of-the-art of up-conversion on RE-doped solids
16
lifetime in combination with host materials. The activators, used in up-conversion nanoparticles, are mostly Ln3+ ions. In very few reports, the Pr3+ and Ce3+ were also adopted as activators when doping in suitable host materials.37–41
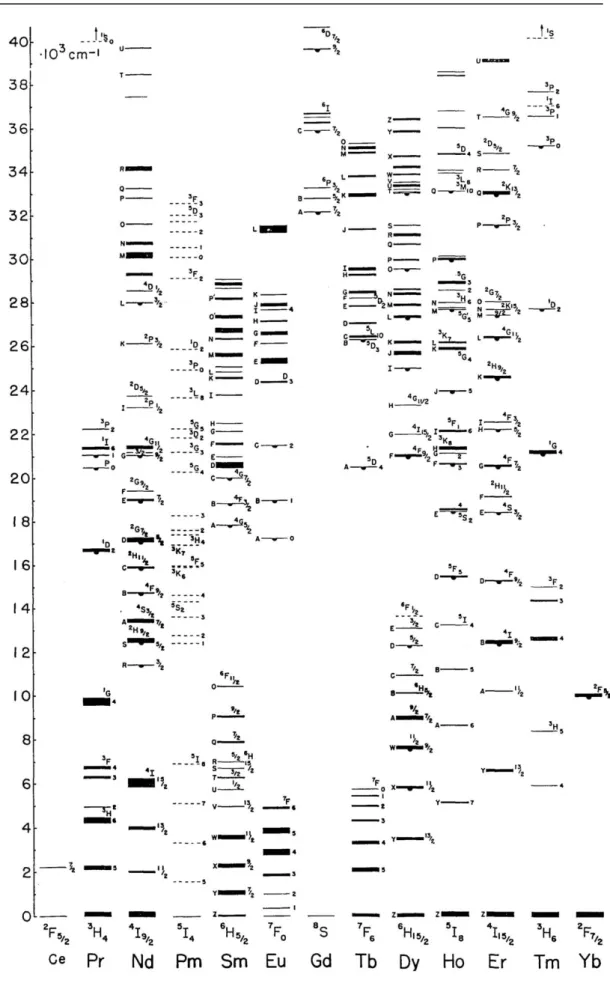
However, the features of multiple energy levels distribution of lanthanide ions make them well-suited for utilizing in up-conversion (Figure 1.4). The lanthanides, starting from lanthanum to lutetium, are associated with the filing of the 4f-shell. The trivalent ions Ln3+ is the most stable oxidation state and main existing substance. The completely filled 5s2 and 5p6 sub-shells act as the shield of the 4f electron of Ln3+. This particular electron structure leads to some important phenomenon such as sharp and narrow f-f transition bands. Moreover, the Laporte forbidden f-f transition results in low transition probabilities and substantially long-lived (up to 0.1s) excited states.35 The common lanthanide ions have more than one exciting 4f energy level except for La3+,Ce3+,Yb3+, and Lu3+.(Figure 1.4)
Chapter 1 State-of-the-art of up-conversion on RE-doped solids
17
Chapter 1 State-of-the-art of up-conversion on RE-doped solids
18
As a result, most lanthanide ions could be used into up-conversion emission theoretically. Nevertheless, to generate substantively useful UC emission, the energy difference between each exciting level and its ground level should be close enough to facilitate photon absorption and energy transfer steps involved in UC processes. Concerning this requirement, only Er3+, Tm3+, and Ho3+ typically possess such ladder-like arranged energy levels (Figure 1.5). Therefore, they are frequently-used activators.
In the ETU process, the two main factors that affect the up-conversion processes are the distance between the two neighboring doped ions and the absorption cross-section of the ions.125 Too high doping levels can lead to deleterious cross-relaxation, resulting in quenching of the excitation energy. The concentration of the activator ions should be kept low and precisely adjusted to avoid the quenching phenomenon. For up-conversion process, the internal quantum yield is limited to less than 50% owing to at least two low energy photons were absorbed to generate one high energy photon. In addition, most lanthanide activator ions exhibit low absorption cross-sections, leading to the low pump efficiency.
Another important factor is the non-radiative multi-phonon relaxation rate between the activators energy levels. This rate dictates the population of intermediate and emitting levels and subsequently determines the efficiency of the UC process. The multi-phonon relaxation rate constant knr for 4f levels of lanthanide ions 35,86,126 is
given as follows:
Where β is an empirical constant of the host, ΔE is the energy gap between the populated level and the next lower-lying energy level of a lanthanide ion, and ℏωmax is
Chapter 1 State-of-the-art of up-conversion on RE-doped solids
19
the highest-energy vibrational mode of the host lattice. The energy gap law implies that the multi-phonons relaxation rate constant decreases exponentially with increasing energy gap. As shown in Figure 1.5, Er3+ and Tm3+ have a relatively large energy gap, which means low probabilities of non-radiative transitions among various excited levels of the ions. According to this energy gap law, the known most efficient UC nanocrystals to date are acquired from Er3+ and Tm3+ activators.
Figure 1.5 Schematic energy level diagrams of typical UC processes for Er3+, Tm3+, and Ho3+. The dashed-dotted, dotted, and full arrows stand for excitation, multi-phonon relaxation, and emission processes, respectively.35
The above lanthanide activators, Er3+, Tm3+, and Ho3+, are always co-doped with sensitizer Yb3+ and excited by a ~ 980 nm pulsed laser. For example, in the case of Er3+ activator, the energy difference between the 4I11/2 and 4I15/2 levels (~10,350 cm-1)
is similar to that (~ 10,370 cm-1) between the 4F7/2 and 4I11/2 levels. Therefore, the ~
980 nm (~ 10,204 cm-1) was used to excite the ion which populates from 4I15/2 to 4I11/2
energy level and then from 4I11/2 to 4F7/2 level to generate green emission light. The
Chapter 1 State-of-the-art of up-conversion on RE-doped solids
20
→ 5
I8 excitation, respectively (Figure 1.6). The necessary energy of the first excited
transition from Er3+, Tm3+, and 3H6 are all close to the energy of ~ 980 nm laser.
Figure 1.6 Photon energy state levels of Yb/Ho, Yb/Er and Yb/Tm.105
1.3.3 Sensitizers
In lanthanide single-doped nanocrystals, such as Er3+ and Tm3+, it is very difficult for the same ion on the first-excited level to continue absorbing the second photon to populate on a higher emitting-level in the limited lifetimes of the first-excited level. Therefore, the overall up-conversion efficiency of single-doped nanocrystals is quite low.
In 1966, Auzel found that the luminescence intensity of Er3+, Ho3+, and Tm3+ ions was almost enhanced by two orders of magnitude when doping Yb3+ into the host material under near-infrared light excitation.8,12 The Yb3+ was used as frequent sensitizers from then on. Yb3+,with a sufficient absorption cross-section in the NIR region, is usually co-doped with the activator to take advantage of the efficient ETU process between the sensitizer and activator. Trivalent ytterbium possesses an extremely simple energy level scheme including only one 4f exciting-level of 2F5/2.
Chapter 1 State-of-the-art of up-conversion on RE-doped solids
21
The absorption band of Yb3+, that is located around 980 nm due to the 2F7/2 → 2F5/2
transition, has a high absorption cross-section (11.7 ± 1.0 × 10⁻²¹ cm2).129 The absorption cross-section of Yb3+ at 980 nm is larger than other lanthanide ions. For example, it is one order of magnitude higher than that of the Er3+. Additionally, the
2
F7/2 → 2F5/2 transition of Yb3+ is well resonant with many f–f transitions of typical
up-conversion lanthanide ions (e.g. Er3+, Tm3+, and Ho3+), thus facilitating efficient energy transfer from Yb3+ to other ions. Thereby, these optical characteristics make Yb3+ particularly suitable as an up-conversion sensitizer.
The Dy3+ ion can act as a sensitizer in a YBr3:Dy3+/Er3+ co-doped materials and
BaCl2:Dy3+/Er3+ UCNs.130,131 To be specific, the Dy3+ ion has an absorption band
(6H9/2) around 7,700 cm-1 (1,300 nm) higher than the ground state (6H15/2). The energy
can then transfer to the 4F9/2 level of Er3+ and finally cause a radiative transition from
the 4F9/2 to the 4I15/2 ground level causing luminescence at around 660 nm. However,
there are two energy levels (6H11/2 and 6H13/2) between the ground state 6H15/2 and
emitting-level 6H9/2, which may cause the non-radiative relaxation to quench the UC
process.
1.4 Fluoride-based up-conversion nanoparticles
In comparison with sulfide, oxide, and phosphide, the fluoride nanoparticles especially get considerable interest owing to the low phonon energy of fluoride which ranges in 300 to 400 cm-1.11,118 The low lattice phonon energy of fluoride can reduce
non-radiative losses and therefore enhance luminescence efficiency.22 In combination with high chemical and thermal stability and narrow emission lines, fluorides are particularly suitable for NIR conversion.
Chapter 1 State-of-the-art of up-conversion on RE-doped solids
22
Many kinds of fluoride-based up-conversion nanoparticles have been developed, such as NaREF4 (RE: La-Lu),12,16,18,23,37,54–58,59–63 LiYF4,37,69–71 KYF4,72–74
KY3F10,75–77 YF3,78,79 LaF3,80–82 CaF2,83,84 and SrF285,86. NaREF4 type fluoride
nanoparticle has got the most researches and Yb/Er co-doped hexagonal NaYF4 is
found to be the most efficient UC material up to now.23,61 Even so, the up-conversion nanoparticles are still far from deep application due to the low up-conversion efficiency. For example, the internal up-conversion quantum yield of the most efficient β-NaYF4:20%Yb/2%Er nanoparticles at 540 nm is 0.3 % under a 980 nm of
excitation laser according to a review paper.25 At present, low efficiency is the biggest obstacle in practical applications for up-conversion phosphors.132,133
Therefore, the up-conversion nanoparticles need more and deep studies to optimize the photoluminescence properties such as increasing the luminescence lifetime and enhancing the conversion efficiency. As we discussed in chapter 1.3, the suitable kinds of activators and sensitizers are always picked from the frequently used activators Er3+, Yb3+, or Ho3+ and sensitizers Yb3+. The doping concentrations of them are recommended to such as ~ 20% Yb and ~ 2% Er.35 However, the kinds of the candidate host materials are numerous and various even in terms of fluoride-based materials. Therefore, more researches should be focused on synthesizing and developing more novel host materials. This may help to overcome the current limitation faced by UCNs and accelerate the development to obtain ideal host materials.
In very recent years, many novel host materials have been researched and reported. For example, NaBiF4,20 which was prepared via an ultrafast room temperature
Chapter 1 State-of-the-art of up-conversion on RE-doped solids
23
non-lanthanide and “green” bismuth element; La0.45Yb0.50Er0.05F3,132 which developed
a novel hetero-looping-enhanced-energy-transfer (hetero-LEET) up-conversion process; and BaY2F8,136 which have been reported as a good candidate host material
in crystal field with high quantum yields values. Therefore, the first goal of this thesis is to prepare several novel host materials. KYF4, BiF3, K0.3Bi0.7F2.4, and BaYF5 based
up-conversion nanoparticles co-doped with Yb and Er will be synthesized in this thesis.
1.5 Applications of up-conversion nanoparticles
1.5.1 Biology analytical applications
1.5.1.1 Biology assays
Up-conversion phosphors are available to be utilized in various ligand binding assays. The narrow photoluminescence emission bands at 520 – 550 nm and at 650 – 670 nm are at shorter wavelengths. They are totally discriminated from autofluorescence and scattered excitation light even without temporal resolution. The transparent solution of colloidal bead-milled up-converting phosphor nanoparticles provides intense green emission visible to the human bare eye under illumination by an infrared laser pointer.137,138 Therefore, up-conversion materials have been devised for detection of cell and tissue surface antigens as luminescence bioassays.138–141
The inorganic lanthanide-doped crystals have been proven to be useful in bioaffinity assays. About the immunoassays, up-conversion nanoparticles have been used, for example, in enzyme activity assays and DNA-hybridization assays taking advantage of the up-conversion phenomenon.34,139
Chapter 1 State-of-the-art of up-conversion on RE-doped solids
24
1.5.1.2 Chemical sensors
The chemical sensors are small instruments that were used to detect the presence of certain analytes by producing a signal that can be measured. They usually include two connected units: a chemical receptor for analyte recognition and a physicochemical transducer for producing a signal proportional to the concentration of the analytes. The analyte objects are oxygen, carbon dioxide, hydrogen peroxide, glucose, proteins, nucleic acids, anions, metal ions, cofactors, and coenzymes.34
Traditionally, chemical sensors have contained organic dye molecules, such as rhodamine, that was utilized as luminescent compounds. Currently, there has been increasing interest in using NIR emitting lanthanide ions and up-conversion nanoparticles for better tissue penetration. For example, up-converting nanoparticles have been applied in sensor systems to detect pH, temperature,142 NH3,143 and O2.144
1.5.1.3 Biological imaging
The NIR excitation takes advantages of deep tissue penetration with minimized photodamage, eliminating autofluorescence and increasing the detection sensitivity. In addition, up-conversion nanoparticles are readily internalized by many cell types and in the imaging of blood vessels. As a result, the non-toxic up-conversion nanoparticles are very promising application in biologic imaging fields.139 For example, Gd3+/Yb3+/Er3+ co-doped NaYF4 nanophosphors have been used in vivo combining
luminescence imaging with PET (positron emission tomography) and UCL (up-conversion luminescence) imaging.145 Currently, there is an increasing interest towards dual-mode down- and up-conversion in imaging.
Chapter 1 State-of-the-art of up-conversion on RE-doped solids
25 1.5.2 Lasers
The optically pumped lasers are originally based on a Stokes pumping process. One basic problem is how to obtain a high-density pumping source at a shorter wavelength than their emitting wavelength.146 One research about this up-conversion laser is LiYF4:Er3+ where green (551 nm) and red (619 nm, 669 nm and 702 nm) lasing has
been demonstrated by pumping into either 4I9/2 level with wavelengths around 800 nm
or the 4I11/2 level with wavelengths around 970 nm.147
1.5.3 Diodes
Laser diodes (LD) and light-emitting diodes (LEDs) have got fruitful results with many kinds of researches. Infrared up-conversion devices were once extensively investigated since the devices were considered to be candidates for green and blue display devices. Infrared up-conversion devices generally consisted of Yb3+-sensitized and Er3+- or Tm3+-activated fluoride phosphors and GaAs:Si light-emitting diodes (LEDs) as excitation sources.148 A 980 nm emitting LD has been developed for pumping an Er3+-doped fiber amplifier for optical communication systems. The LD has a higher output (over 50 mW) and good reliability. Since the LD output light can be finely focused, adoption of LD has pronouncedly increased the infrared excitation density and also made it possible to accomplish effective optical confinement.148
However, the subsequent researches about this application are rare since the overall efficiency of the up-conversion display devices were generally low and inferior to green emitting GaP LEDs. The promising applications count on the enhanced efficiency of up-conversion materials.
Chapter 1 State-of-the-art of up-conversion on RE-doped solids
26
1.5.4 Displays
A three-color, solid-state, volumetric display based on two-step, two-frequency up-conversion in rare-earth-doped heavy metal fluoride glass is designed.149 This device uses infrared laser beams that intersect inside a transparent volume of active optical material to address red, green and blue voxels by sequential two-step resonant absorption. Three-dimensional wire-frame images, surface areas, and solids are drawn by scanning the point of intersection of the lasers around inside of the material. The prototype device is driven with laser diodes, uses conventional focusing optics and mechanical scanners, and is bright enough to be seen in ambient room lighting conditions.
1.5.5 Inks for security printing
Security inks are specialized inks used for authentication, anti-counterfeiting, and loss or theft prevention34. Up-conversion phosphors are suitable for various kinds of printing application and can be mixed with several types of inks. These security inks can be added e.g. in plastics, papers, cloths, ceramics, glasses or solutions. Invisible inks contain unconventional dyes or pigments which become visible when exposed to an excitation light source which causes luminescence. Invisible inks are a subcategory of a class of security inks. Such inks are widely used in banknotes or currency as an anti-counterfeiting measurement.
A mono-dispersed dumbbell-shaped lanthanide-doped up- and down-conversion NaYF4:Ln3+@NaGdF4:Ln3+ core-shell nanocrystals (CSNPs) were successfully
Chapter 1 State-of-the-art of up-conversion on RE-doped solids
27
luminescent inks for inkjet printing to create a variety of dual-mode fluorescence patterns (peacock, temple, and logo) on different paper-based substrates (A4 paper,
envelope, and postcard). Primary additive coloured red-green-blue
β-NaYF4:17%Yb3+/3%Er3+ UCNPs inks were successfully synthesized to do
red-green-blue printing.151 These up-conversion based inks provide promising materials and technique for anti-counterfeiting applications.
1.5.6 Solar cells
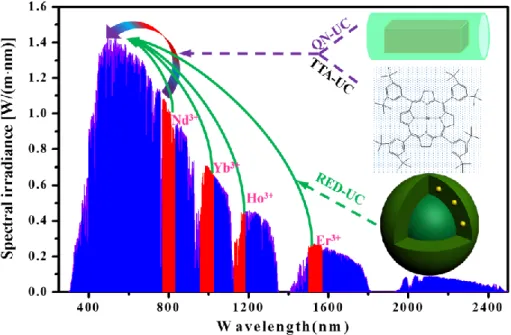
The efficiency of current photovoltaics is significantly impeded by the transmission loss of sub-band-gap photons. Photon up-conversion is a promising route to circumvent this problem by converting these transmitted sub-band-gap photons into above-band-gap light, where solar cells typically have high quantum efficiency (Figure 1.7).152
Chapter 1 State-of-the-art of up-conversion on RE-doped solids
28
materials. QN-UC (purple): up-conversion in quantum nanostructures; TTA-UC (purple): triplet-triplet annihilation up-conversion; and RED-UC (green): Rare-earth-doped up-conversion materials.152
The inability to absorb infrared (IR) light (700 – 2500 nm), which constitutes 52 % of the energy of the entire solar spectrum, forms the major energy loss mechanism of conventional solar cells. Crystalline silicon (c-Si) photovoltaic (PV) cells are the most used among all types of solar cells on the market.153 However, even for single crystalline silicon (Si) PV cells with a rather small semiconductor band-gap (1.12 eV, corresponding to a wavelength of ~1100 nm), the transmission loss of sub-band-gap photons can still amount to about 20% of the sun’s energy irradiated onto the Earth’s surface.154
Some related application has been reported.25,152,155–158 For example, the NIR to red/green or blue up-conversion lattice NaYF4 co-doped with Er3+, Yb3+/Er3+ or
Yb3+/Tm3+. It was demonstrated that as much as 50% of the NIR excitation photons contribute to the up-conversion emission.159
1.6 Conclusion
Chapter 1 gives a general introduction about the state-of-the-art of RE-doped up-conversion. Brief historical background and development of up-conversion have been presented. Three main mechanisms of up-conversion, including excited-state absorption, energy-transfer up-conversion, and photo avalanche have been exhibited. A description of the up-conversion materials constitution, including host materials, activators, and sensitizers has been presented, respectively. A particular introduction
Chapter 1 State-of-the-art of up-conversion on RE-doped solids
29
about fluoride-based up-conversion nanoparticles has been illustrated. Some obstacles that limit the UCNs development have been analyzed. Finally, some related and promising applications about up-conversion materials have been presented, such as utilizing in biology analytical, lasers, diodes, displays, inks for security printing, and solar cells.
Chapter 1 State-of-the-art of up-conversion on RE-doped solids
Chapter 2 Experimental section
31
Chapter 2 Experimental section
2.1 Reagents and materials
The purity of KNO3.6H2O, Y(NO3)3.6H2O, Er(NO3)3.6H2O, Yb(NO3)3.6H2O,
Bi(NO3)3.6H2O, and NH4F reagents are all 99.99 %. The Ba(NO3)2.6H2O has a purity
of 99.999 %. The purity of ethanol is ≥ 99 %. The assay of ethylene glycol is 99 %. The assay of oleic acid is 90 %. The cyclohexane has a 100 % assay on anhydrous substance. The assay of absolute anhydrous pure ethanol is 99.9%.
2.1.1 Precursors utilising in KYF4:10%Yb/5%Er UCNs
In synthesis procedure of KYF4:10%Yb/5%Er samples, all reagents, including
KNO3.6H2O, Y(NO3)3.6H2O, Er(NO3)3.6H2O, Yb(NO3)3.6H2O, and NH4F, were
purchased from Aldrich and used as received without further purification or modification. The absolute anhydrous pure ethanol was purchased from CARLO ERBA Reagents and used as received without purification or modification.
2.1.2 Precursors utilising in BiF3:10%Yb/5%Er UCNs
The reactants Bi(NO3)3.6H2O, Er(NO3).6H2O, Yb(NO3).6H2O, and NH4F were all
purchased from Aldrich and used as received without further purification or modification. The ethylene glycol for dissolving Bi(NO3)3.6H2O was purchased from
Sigma-Aldrich and used as received without further purification.
2.1.3 Precursors utilising in K0.3Bi0.7F2.4:10%Yb/5%Er UCNs
Chapter 2 Experimental section
32
and NH4F, were all purchased from Aldrich and used as received without further
purification or modification. The ethylene glycol for dissolving Bi(NO3)3.6H2O was
purchased from Sigma-Aldrich and used as received without further purification.
2.1.4 Precursors utilizing in BaYF5:20%Yb/2%Er coated with BaYF5 UCNs
The precursors, including Ba(NO3)2.6H2O, Y(NO3)3.6H2O, Er(NO3)3.6H2O,
Yb(NO3)3.6H2O, and NH4F, were all purchased from Aldrich and used as received
without further purification or modification. The ethylene glycol, oleic acid, and cyclohexane were purchased from Sigma-Aldrich, Alfa Aesar, and VWR, respectively. They are all used as received without further purification.
2.2 Synthesis procedure
2.2.1 Synthesis method of KYF4:10%Yb/5%Er
For comparison, three different initial K/Y/F ratios (Table 2.1) were designed, including K/Y/F=2/1/5 (A1 and B1), K/Y/F=2/1/7 (A2 and B2), and K/Y/F=2/1/9 (A3
and B3). Moreover, two different reaction conditions A and B at each ratio were
designed. The capital letter A stands for the samples prepared only in deionized water while letter B stands for samples prepared in a mixed medium of deionized water and ethanol. The utilizing of mixed deionized water and ethanol could reduce the number of introduced ligands, which populate onto nanoparticles surface to quench the UC process compared with other widely used complicated organic solvents. They are safer, more economical, and more accessible than the complex organic solvents.
Chapter 2 Experimental section
33
Table 2.1 Specifications of the samples composition synthesized with different initial K/Y/F ratios and reaction solvents.
Samples Deionized water Mixed deionized water-ethanol solution
K/Y/F=2/1/5 A1 B1
K/Y/F=2/1/7 A2 B2
K/Y/F=2/1/9 A3 B3
In a typical procedure, 2 mmol KNO3.6H2O, 0.85 mmol Y(NO3)3.6H2O, 0.05 mmol
Er(NO3)3.6H2O, and 0.1 mmol Yb(NO3)3.6H2O were added into 15 ml deionized
water and stirring for 5-10 minutes. m (5/7/9) mmol NH4F was added into 20 ml
deionized water (A1, A2, and A3) or the mixture of 10 ml ethanol and 10 ml deionized
water (B1, B2, and B3) and stirring for 5-10 minutes. Then the first solution was added
dropwise into the second solution to form white precipitation in the final solution. After stirring the above mixture solution for only 2 minutes, the final solution was washed and dispersed with deionized water and ethanol several times, respectively. The final obtained white samples were dried for 12 h in the dried oven at 90 ℃. The samples were annealed at 400 ℃ for 4 h in a furnace under an argon stream. Not any surfactant, chelator or capping reagents were used.
In addition, other samples synthesized with different initial K/Y/F ratios were also prepared in a similar way except for the different adding amount of the reagents.
2.2.2 Synthesis method of BiF3:10%Yb/5%Er
Three different initial Bi/F ratios, including Bi/F=1/3, Bi/F=1/5, and Bi/F=1/7, were designed. At each ratio, undoped samples and 10 mol% Yb and 5 mol% Er co-doped
Chapter 2 Experimental section
34
samples were prepared. Otherwise, Bi/F=1/9 Yb/Er co-doped BiF3 sample has also
been prepared.
In the procedure of preparing undoped samples, 1 mmol Bi(NO3).6H2O was
dissolved into 15 ml ethylene glycol (EG) and stirring for 5-10 minutes. Then, m (3/5/7; marked with A, B, and C, respectively) mmol NH4F was dissolved into 15 ml
deionized water (DW) and also stirring for 5-10 minutes. Afterward, the above solution dissolved with nitrate was added dropwise into the solution with ammonium fluoride to form white precipitation in the mixed solution. After stirring the solution for only 2 minutes, the final solution was successfully obtained. The products are then washed and dispersed in deionized water and ethanol several times. The white products were dried for 12 h in a dried oven at 90 ℃. Not any surfactant, chelators or capping reagents were used.
For synthesizing Yb/Er co-doped samples, 0.85 mmol Bi(NO3)3.6H2O, 0.05 mmol
Er(NO3)3.6H2O, and 0.1 mmol Yb(NO3)3.6H2O were dissolved into 15 ml deionized
water and stirring for 5-10 minutes. m (3/5/7; marked with D, E, and F) mmol NH4F
was added into 15ml deionized water and stirring for 5-10 minutes. The following processes are similar to that of the undoped samples. Besides, in a furnace under an argon stream, the sample E, the Yb/Er doped BiF3 prepared witH Bi/F = 1/5, was
annealed at 400 ℃ for 4 h.
The sample marked with G, which has a similar synthesis process with A except for using ethylene glycol to dissolve NH4F instead of deionized water, was also prepared
2.2.3 Synthesis method of K0.3Bi0.7F2.4:10%Yb/5%Er
Chapter 2 Experimental section
35
(1/2/3) mmol KNO3.6H2O, 0.85 mmol Bi(NO3)3.6H2O, 0.05 mmol Er(NO3)3.6H2O
and 0.1 mmol Yb(NO3)3.6H2O were added into 15 ml ethylene glycol and stirring for
5-10 minutes. Afterward, 7 mmol NH4F was dissolved into 15 ml deionized water and
stirring for 5-10 minutes. Afterward, the first solution was added dropwise into the solution dissolved with NH4F to form white precipitation in the final solution. After
stirring the solution for only 2 minutes, the compounds were obtained. The compounds were washed and dispersed with deionized water and ethanol several times. The obtained white samples were then dried for 12 h in a drying oven at 90 ℃. The samples were annealed at 400 ℃ for 4 h in a furnace under an argon stream. Not any surfactant, chelator or capping reagents were used.
In the procedure of synthesizing undoped K0.3Bi0.7F2.4 nanoparticles, m (1/2/3)
mmol KNO3.6H2O and 1 mmol Bi(NO3)3.6H2O were dissolved into 15 ml ethylene
glycol and stirring for 5-10 minutes. The following processes are the same as that of the Yb/Er co-doped samples.
2.2.4 Synthesis method of BaYF5:20%Yb/2%Er@ BaYF5
In a typical procedure of preparing BaYF5:20%Yb/2%Er nanoparticles: 1 mmol
Ba(NO3)2.6H2O, 0.78 mmol Y(NO3)3.6H2O, 0.02 mmol Er(NO3)3.6H2O, and 0.2 mmol
Yb(NO3)3.6H2O were dissolved into the mixed solution of 5 ml deionized water, 5 ml
oleic acid, and 10 ml ethylene glycol to stirring for 5-10 minutes. Afterward, 5 mmol NH4F was dissolved into 5 ml deionized water and 5 ml ethylene glycol after 5-10
minutes stirring. Then the first solution was added dropwise into the solution dissolved with NH4F and stirred for 5-10 minutes. The obtained solution was moved
Chapter 2 Experimental section
36
temperature, the compounds were separated by centrifugation. Then 1:4 volume mixed cyclohexane and ethanol were used to wash the compounds several times. Afterward, ethanol was still used to wash the compounds several times. The final obtained white samples were dried for 12 h in a drying oven at 90 ℃.
In a typical procedure of synthesizing BaYF5:20%Yb/2%Er coated with BaYF5
nanoparticles: 1 mmol Ba(NO3)2.6H2O, 0.78 mmol Y(NO3)3.6H2O, 0.02 mmol
Er(NO3)3.6H2O, and 0.2 mmol Yb(NO3)3.6H2O were dissolved into the mixed solution
of 5 ml deionized water, 5 ml oleic acid, and 10 ml ethylene glycol to stirring for 5-10 minutes. 12 mmol NH4F was dissolved into 5 ml deionized water and 5 ml ethylene
glycol for 5-10 minutes stirring. Then the first solution was dropwised into the second solution and stirred for 5-10 minutes. The final solution was moved into a sealed autoclave to react at 200 ℃ for 12 hours. When cooling down to room temperature, 5 ml deionized water with 1 mmol Y(NO3)3.6H2O and 1 mmol Ba(NO3)2.6H2O was
added into the prepared solution with BaYF5:20%Yb/2%Er compound and stirred for
5-10 minutes. The solution was resealed in an autoclave to react at 180 ℃ for 4 h. After cooling down to room temperature, the compounds were collected by centrifugation. The mixed cyclohexane and ethanol with 1:4 volume were used to wash the compounds several times. Then, the ethanol was used to wash the compounds several times. The obtained white samples were dried for 12 h in a drying oven at 90 ℃.
2.3 Characterization experiment
The powders X-ray diffraction (XRD) data were measured on an X’Pert Pro Diffractometer (Panalytical) with Cu K ( = 1.5406 Å) radiation (40 kV, 45 mA ).
Chapter 2 Experimental section
37
The program Fullprof Suite was used to do the profile refinement of XRD patterns. Williamson-Hall method was adopted to calculate the average crystallite sizes.160 Based on the XRD data, crystallite sizes were acquired from full-widths at half-maximum (FWHM) of the given peaks. The Bragg peak breadth Bmeasurement is the
squares sum of sample Bsample and instrumental contributions Binstrument:
(1)
Standard LaB6 was used to determine the instrumental broadening Binstrument
allowing calculating Bsample using Equation (1).
Actually, microstrains are very common in nanoparticle materials and therefore the peak broadening Bsample is due to both microstrains, Bmicrostrains = 4sin()/cos(), and
crystallite size, Bsize = Kλ/Dcos() (Scherrer Formula). The Equation (2) is given as
follow:
(2)
Where is the diffraction angle, is Scherrer constant, is the microstrain coefficient, λ is X-ray wavelength (λ = 0.15046 nm), and D is crystallite size. The Scherrer constant K depends on the crystal shape, size distribution and particular the method used to estimate the broadening of the peaks. For spherical particles, a cubic symmetry and a full width at half maximum method was used to estimate the broadening, the is taken as 0.94. is the microstrain coefficient, which is mainly caused by no-uniform lattice distortions, dislocations, antiphase domain boundaries,
Chapter 2 Experimental section
38
grain surface relaxation, and so on. Rearranging Equation (2) gives:
(3)
Then Bsamplecos() was plotted as function of 4sin(). The slope and y-intercept of
the linear regression lines stand for strain effect and size effect, respectively. Once the y-intercept was acquired from the fitting lines, substituting it into y-intercept = Kλ/D equation to calculate crystallite size D.
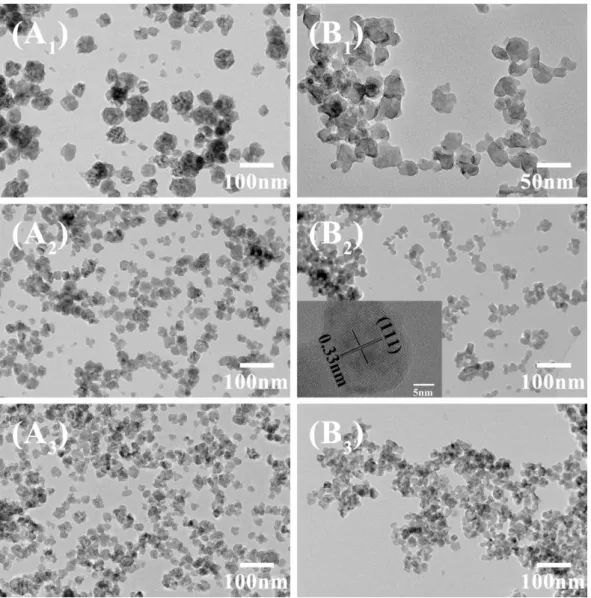
Transmission electron microscope (TEM) images were captured on a JEOL JEM 2100Plus (equipped with a LaB6 filament) microscope operating at 200 kV. The
images were collected with a 4008 × 2672 pixel CCD camera (Gatan Orius SC1000). The size distribution histogram was draw from the TEM images with ImageJ software.
The absorption spectra were measured with the Cary 6000i UV-Vis-NIR Spectrophotometer.
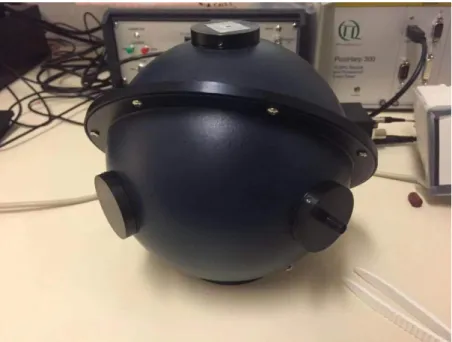
The internal quantum yields (QY) of the prepared powders were calculated by the emission spectra, which were collected by an integrating sphere. The integrating sphere is shown in Figure 2.1. The ~ 974 nm excitation laser source with 1080 mA power was from a laser diode & temperature controller of Unique-Mode laser technology. The Ocean Optics HR 4000 spectrometer (200 – 1100 nm) was used to collect the emission spectrum.
For an internal quantum yield measurement, two experiments are necessary. The first experiment was done only with a transparent glass slide in the sphere. The
Chapter 2 Experimental section
39
second experiment measured the samples onto the glass slide, which was put into the integrating sphere. The emission spectra of these two experiments were obtained. After calculating the difference of the emission peaks area near 974 nm of these two experiments, the absorption was obtained. Afterward, the area at red and green emission light was calculated from the spectrum of the second experiment. Finally, internal UCQY was obtained. The configurations of the experimental instrument and the detailed processes are similar to a measurement of external quantum yield by Prof. R. H. Friend.161
Figure 2.1 The integrating sphere that was used in the measurement of internal UCQY.
The emission spectra and fluorescence decay time measurement were all excited under a tunable Ekspla NT342B OPO laser with 7 ns pulsed duration. A CCD camera (Princeton Instruments) equipped with a monochromator (Acton Research, 300 lines/mm) was used to measure the fluorescence spectra. An RCA 8850
Chapter 2 Experimental section
40
photomultiplier was used to detect the decay curves. All measurements were performed at room temperature.
Chapter 3 Results and discussion
41
Chapter 3 Results and discussion
3.1 KYF
4:10%Yb/5%Er
KYF4 melts non-congruently, which makes crystal growth rather critical. It is a good
optical quality crystal. The KYF4 has low phonon energy and shows a similar
structure with NaYF4.
The crystal structure of KYF4 has been determined by single-crystal X-ray
analysis.162 Tetragonal KYF4 is recognized as a fluorite-related superstructure and
hexagonal KYF4 is distorted fluoride structure.163 However, we do not find the cubic
phase information in the current database of XRD patterns as far as we know. There are only a few articles reporting the cubic KYF4-based UCNs.162,164–166
Chapter 3 Results and discussion
42
3.1.1 Structure
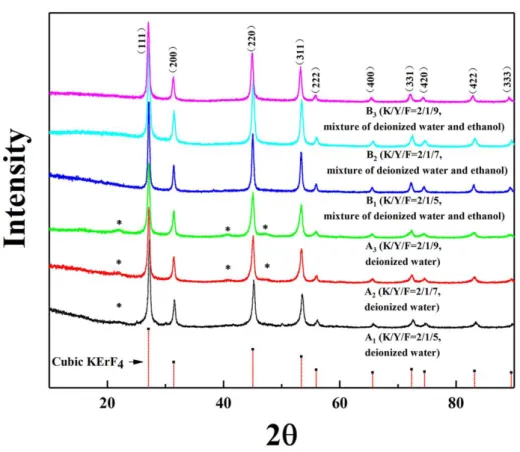
Figure 3.1.1 X-ray powders diffraction patterns of cubic KYF4:10%Yb/5%Er
compounds with different K/Y/F ratios.
Figure 3.1.1 shows X-ray diffraction (XRD) patterns of the as-prepared powders and this of the cubic KErF4 (space group Fm-3m, PDF 00-065-0575) for comparison.
Indeed, XRD patterns of KYF4:10%Yb/5%Er showed in Figure 3.1.1 is unmatched
with the XRD patterns of hexagonal or tetragonal KYF4 compounds recorded in the
databases while they are in good accordance with that of cubic KErF4. This result is in
agreement with previous works. For example, Schafer et al.162 firstly reported in 2008, cubic KYF4:Yb/Er nanoparticles with a mean size of 13 nm that were synthesized in
Chapter 3 Results and discussion
43
200 °C. They used cubic α-NaYF4 as a structural model and explained that the two
patterns had similar diffraction intensity and all peaks of the α-NaYF4 shift towards
high angle compared with their samples.162 Later, several articles reported cubic KYF4
UC nanocrystal including KYF4:Nd3+ by microwave-hydrothermal crystallization,164
KYF4:Eu3+ by hydrothermal method,165 and KYF4:Eu3+ by modified thermal
decomposition method.166
As a result, it was demonstrated that pure cubic KYF4 nanoparticles were
synthesized by co-precipitation method at room temperature in a deionized water-ethanol solvent (B1, B2, and B3), which is an extremely facile and fast method
compared with other ones.162,164–166 To our knowledge, it is the first time at room temperature that Yb/Er co-doped KYF4 UCNs are prepared in the water-ethanol
medium.
However, some very weak diffraction peaks are found and marked with the asterisk in the XRD patterns of KYF4:10%Yb/5%Er prepared only in deionized water (A1, A2,
and A3) in Figure 3.1.1. In previous works,162,164 similar weak diffraction peaks were
observed in the XRD patterns of KYF4 compounds synthesized with an analogous
method, but the phases due to these peaks were not discussed and identified. After a careful analysis of the positions and intensities of these diffraction lines, it appears that these ones may belong to another potassium yttrium fluoride compounds cubic KY3F10 (PDF-01-084-5197).
In conclusion, the use of the mixed ethanol-water medium for syntheses of KYF4
compounds at RT leads to the systematic presence of impurities in the samples synthesized in deionized water only, while they are absent in the ones synthesized in a mixed ethanol-water medium.
Chapter 3 Results and discussion
44
Figure 3.1.2 X-ray powder patterns of the cubic KYF4 with different initial K/Y/F
ratios for comparison.
Meanwhile, in the following experiments, we found that the peaks due to impurities disappear if the quantity of potassium is increased in the K/Y ratio (from 2/1 to 3/1) in the samples prepared only in deionized water. The result is shown in Figure 3.1.2. This result indicates clearly that it is necessary to work in a large excess of potassium when only deionized water is used. Otherwise, the large F/K ratio is also essential. For example in K/Y/F = 3/1/3 XRD pattern, the situation is worse compared with K/Y/F =3/1/7. So, the impurity peaks are due to low amounts of initial adding K+ and F- that are not sufficient to form pure cubic KYF4. Apart from enhancing the amounts
Chapter 3 Results and discussion
45
of K+ and especial F-, the previous statements about the use of mixed ethonal-water medium rather than, which changes the reaction equilibrium constants, can also promote the expected reaction and acquire pure cubic KYF4 phase.
Figure 3.1.3 Refinement of XRD pattern of B3 sample.
Figure 3.1.3 exhibits the XRD profile refinement of the sample B3 recorded with a
slow scanning speed. The calculated profile fits well with the observed XRD pattern. Cubic Yb/Er co-doped KYF4 crystallizes in a fluorite-like crystal structure in which
cations sites are statically occupied by Y3+, Yb3+, and Er3+ cations. The refined lattice parameter of the cubic unit cell is a = 5.6926 Å. It is larger than that of KErF4 whose
is 5.6862 Å.167 The Shannon ionic radius of Y3+, Yb3+, and Er3+ with Ⅷ coordination number is 1.159 Å, 1.125 Å, and 1.144 Å, respectively.115,168 The Y3+ has a bigger Shannon ionic radius than Er3+, it is the reason why KYF4:10%Yb/5%Er
Chapter 3 Results and discussion
46
nanoparticles have a larger lattice parameter than KErF4.
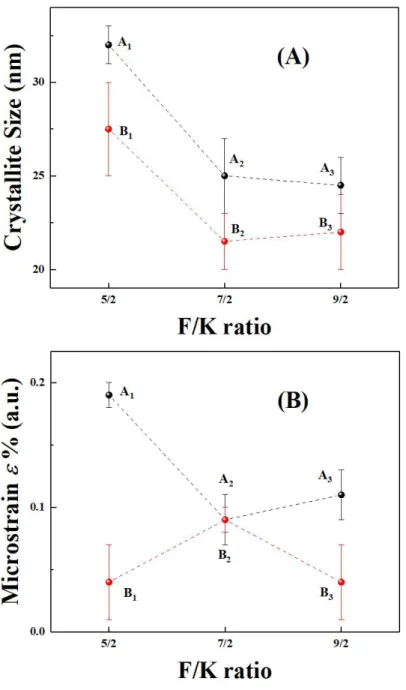
Figure 3.1 4 Linear fitting Bsample cos() versus 4sin() of the sample A1,A2, A3, B1,
B2, and B3.
Williamson-Hall method was adopted to calculate the average crystallite sizes. According to the XRD data, crystallite sizes were obtained from full-widths at