HAL Id: hal-01204720
https://hal.archives-ouvertes.fr/hal-01204720
Submitted on 28 Sep 2015
HAL is a multi-disciplinary open access
archive for the deposit and dissemination of
sci-entific research documents, whether they are
pub-lished or not. The documents may come from
teaching and research institutions in France or
abroad, or from public or private research centers.
L’archive ouverte pluridisciplinaire HAL, est
destinée au dépôt et à la diffusion de documents
scientifiques de niveau recherche, publiés ou non,
émanant des établissements d’enseignement et de
recherche français ou étrangers, des laboratoires
publics ou privés.
On the Legacy Amplifier Limitation in Flexgrid Optical
Networks
Djamel Amar, Mohamad Kanj, Jean-Luc Augé, Nicolas Brochier, Esther Le
Rouzic, Catherine Lepers, Bernard Cousin
To cite this version:
Djamel Amar, Mohamad Kanj, Jean-Luc Augé, Nicolas Brochier, Esther Le Rouzic, et al.. On the
Legacy Amplifier Limitation in Flexgrid Optical Networks. Photonics in Switching Conference (PS
2015), Sep 2015, Florence, Italy. pp.172 - 174, �10.1109/PS.2015.7328990�. �hal-01204720�
On the Legacy Amplifier Limitation in Flexgrid
Optical Networks
Djamel Amar(1,3), Mohamad Kanj(2), Jean-Luc Auge(1), Nicolas Brochier(1), Esther Le Rouzic(1), Catherine Lepers(3),
Bernard Cousin(2,4) (1)Orange Labs, Lannion, France, [email protected] (2)b<>com, Cesson-Sévigné, France
(3) Institut Mines-Telecom/Telecom SudParis, CNRS UMR 5157 SAMOVAR, Evry, France (4)University of Rennes 1, IRISA, Rennes, France
Abstract—Flexgrid technology is an interesting solution to
improve network capacity. However, for a given spectral band, it gives rise to the increase of the number of channels, requiring more amplification power in respect with the conventional fixed grid technology. In this work, we demonstrate that re-engineering the link margins allows supporting this increase while keeping in use legacy amplifiers.
Keywords—optical power limitation; link design; flexgrid; network dimensioning
I. INTRODUCTION
Flexgrid optical network is a promising future generation of transport optical networks [1]. Its main idea consists in squeezing as much data as possible into the spectrum in such a way that spectral efficiency is maximized. However, the deployment of flexgrid optical nodes and more powerful amplifiers makes flexgrid technology expensive for operators despite its capacity increase promises.
Legacy optical amplifiers are an interesting case to study in this respect, and have to be taken into account in migration policies, when moving from the conventional fixed grid to the flexgrid technology. Indeed, considering the same spectral bandwidth (C band), the total required optical power per span depends on the number of optical channels. For this reason, physical links in flexgrid optical networks need more power than before, and the legacy amplifiers can probably exceed their maximum limits if they are not replaced by more powerful ones.
In addition, during system design, physical links are designed to support the same maximum capacity a WDM system can transport. This consequently leads to resource overdimensioning with considerable link margins, due to the non-uniform distribution of traffic. Different strategies have been discussed with the aim of reducing different margins, taking benefit from transponder flexibility [2].
In this work, we evaluate how optical power margins can be used to support the increase of the number of channels in flexgrid optical networks. We also consider real coherent uncompensated transmission link design using dual-stage Erbium doped fiber amplifier model over non-identical spans.
II. LINK DESIGN
Given a physical link with many different spans, the link design consists in specifying the channel power and the set of amplifiers that optimize signal performances at the receiver side, in such a way that amplifier limits are not exceeded. Under specific assumptions these performances can be estimated by the Signal to Noise Ratio (SNR), considering both amplification and non-linear noise. The LOGON strategy [3] performs a local optimization of the SNR, assuming that the spans are independent of one another. The optimum power spectral density is given in (1), where h, µ, Fn, and ρNLI,n stand
for the Planck’s constant, the electromagnetic wave frequency, the noise figure of the amplifier at the output of the nth span,
and its non-linear effect contribution respectively [3].
This approach leads to global optimal solutions in case where all spans are identical (same span loss an), and
associated with the same non power-limited amplifier. We point out that for two successive spans, the optimum launch powers of both spans depend on the gain Gn of the amplifier to
be deployed between them. Therefore, they cannot be set independently, especially if the spans are not identical. It is shown in (2) where the gain of the nth amplifier is computed as
a function of the launch power of the n+1th span.
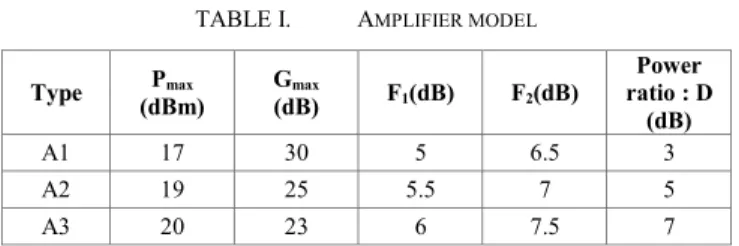
We consider different types of variable gain dual-stage amplifiers without mid-stage access (Table I) with parameters (F1, F2, Gmax, Pmax, D) where F1and F2 are the noise figures for
the first and the second stage respectively, Gmax is the
amplifier maximum gain, Pmax is the amplifier maximum
This work was partly supported by the DGCIS, in the frame of the CELTIC-Plus project SASER-SIEGFRIED.
𝑃𝑛= (2𝜌ℎµ𝐹𝑛 𝑁𝐿𝐼,𝑛) 1 3 (1) 𝐺𝑛= 𝑎𝑛𝑃𝑛+1𝑃 𝑛 (2) 𝐹𝑛 = 𝐹1+𝐹2×𝐷×𝐺𝐺 𝑚𝑎𝑥 𝑛2 (3) 𝐺𝑛 𝑜𝑝= √4 𝐹2𝐷 𝐺𝑚𝑎𝑥 3 𝐹1 𝑠𝑖𝑛ℎ ( 1 3 asinh ( 𝜌𝑁𝐿𝐼,𝑛(𝑎𝑛𝑃𝑛+1)3× √(𝐹2𝐷 𝐺𝑚𝑎𝑥)327 𝐹1 ℎµ )) (4)
power, and D denotes the power ratio for both stages to account for the difference between preamp and booster performance. The resulting noise figure, which varies according to gain adaptation, can be written as in (3). Solving the non-linear equation resulting from the compilation of (1), (2) and (3), we obtain the optimum required gain (Gnop) of (4). This last
equation is the key element of our design method, as it ensures that optimum powers are used for all channels in every span while respecting the power propagation model in the physical link of (2).
The link design is performed from the last span to the first one; we choose the amplifier type that can satisfy both required gain and optimum power while achieving smallest noise figure. If no amplifier can satisfy these requirements, the one with the closest maximum power (Pmax) is chosen. The difference to the
required power is subsequently recovered by re-tuning the gain(s) of the following (downstream) amplifier(s).
III. DIMENSIONING SCENARIOS
As mentioned above, the optimum optical power may exceed the limitations of existing amplifiers, when moving from the conventional fixed channel spacing to the flexible one. In fact, once the initial fixed grid design is accomplished, most of the amplifiers have an extra power margin, since the required powers in the design are not necessarily equal to the maximum powers of the amplifiers. Nevertheless, this power margin varies from one span to another and can be insufficient to support flexgrid additional channels over some links. This is a strong limitation if the saved spectrum cannot be used over these links, due to the need for optical power, bringing into question flexgrid expected gains.
A straightforward solution consists in replacing all the deployed amplifiers with more powerful ones, and performing a new design for flexgrid based links. However, this procedure is expensive and can lead to power overdimensioning.
Another possible and more pragmatic way is to give up on using optimal powers. Indeed, maximizing the SNR at the receiver is not always effective, since it wastes power margins for the channels that do not have stringent requirements in terms of modulation format and optical reach. Therefore, tailoring the SNR to the actual needs seems interesting to save on optical power, and consequently increase link capacity [4].
According to this discussion, we evaluate the following scenarios using the offline dimensioning tool, the 32 Gbaud 16QAM and QPSK transponder/superchannel type and cost model presented in [5].
Fixed grid (FG): the initial design is performed for 80 channels over a 50 GHz grid. This scenario is representative of nowadays core optical networks. Flexgrid (FX106): the links are designed to support the
maximum number of channels in flexgrid optical networks (i.e. 106, considering the same 4 THz band as for FG and 37.5 GHz spacing). Network dimensioning is that of a greenfield deployment with new well adapted-to-flexgrid amplifiers thus leading to an extra cost.
Flexgrid (FX80D and FX80DP): the existing amplifiers are kept unchanged with respect to the FG initial design with 80 channels (no extra amplifier cost). In FX80D, the power aware dimensioning takes benefit from the extra power margin of the amplifiers. The span with the smallest power reserve will therefore limit the other spans along the link. Lastly, FX80DP (extension of FX80D) with the possibility of adjusting individual channel powers to the real requirements according to the minimum SNR accepted value.
IV. RESULTS
Simulations are performed on a 32-node and 42-link European backbone network using single mode fiber spans (chromatic dispersion = 17 ps.nm-1.km-1, fiber attenuation = 0.22 dB/km, non-linearity coefficient = 1 W-1.km-1). Links are designed using the three amplifier types of Table I and assuming non identical span lengths, randomly drawn according to a realistic distribution. Filtering penalties induced by transit across one optical node are 0.05 dB and 0.64 dB for 50 GHz and 37.5 GHz channel spacing respectively [5]. The minimum accepted SNR at the receiver side, using 0.1 nm noise reference bandwidth, including operational margins, is 13.5 dB for QPSK and 22 dB for 16QAM.
Dimensioning process is triggered for seven successive forecasted periods of time, assuming a 35% traffic growth rate. This is the maximum number of periods that every scenario can support without blocking (due to the lack of resources). 20 initial traffic matrices, normalized to 6 Tbps, have been randomly drawn according to a tree logical topology. Demands are optimally served choosing the set of transponders (with regenerator placement) that first minimizes cost and then spectrum occupancy [5].
TABLE I. AMPLIFIER MODEL
Type Pmax (dBm) Gmax (dB) F1(dB) F2(dB) Power ratio : D (dB) A1 17 30 5 6.5 3 A2 19 25 5.5 7 5 A3 20 23 6 7.5 7
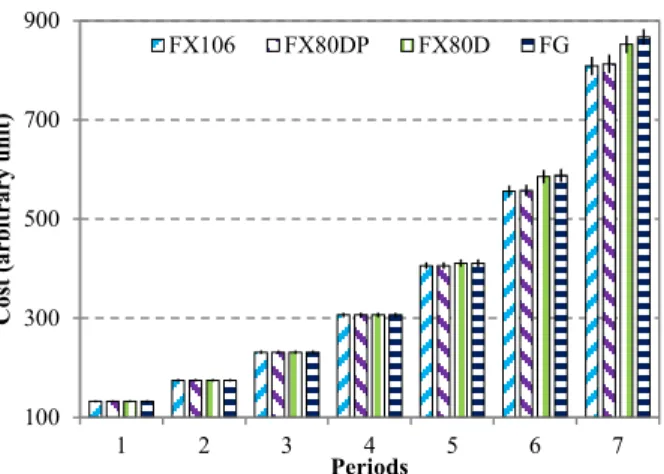
Fig. 1 shows network cost evolution as a function of time period for all scenarios. This cost is identical until the sixth period when the routing process starts leaving the shortest paths, giving rise to an additional cost due to signal regeneration. Interestingly, FX106 and FX80DP give equivalent results, and save around 10% of cost with respect to conventional FG in the last period. This is obtained thanks to flexible grid saved spectrum, which permits to avoid some longer paths and consequently potential regenerators. However, FX106 scenario has an extra optical cost (not accounted herein), as it leads to use higher power amplifiers, potentially more expensive and less performing (noise figure). Lastly, when power adaptation is not allowed with the traditional design (FX80D), flexible grid has almost no cost saving. This is because of the lack of power, which makes FX80D start using longer paths as early as conventional FG does.
Fig. 2 shows the saved spectrum percentage for flexgrid scenarios compared to conventional fixed grid network. Again, the power adaptation approach (FX80DP) provides almost the same performance as flexgrid specific design (FX106), while keeping legacy amplifiers in place. This is explained by the SNR margin, which permits to reduce the channel launch powers to fit the exact requirements, leading therefore to significant power savings. By contrast, in FX80D where only amplifier power margins are taken advantage of, there is no guarantee that the freed spectrum can be used. In other words, the difference between FX80D and FX80DP is larger than it appears, as most of the 20% spectrum saving in FX80D will not be usable due to amplifier power limitation.
V. CONCLUSIONS
In this paper, we have addressed the amplifier optical power limit issue that an operator network planner will face,
when migrating from fixed grid to flexgrid optical networks. We have proposed a link design approach based on the LOGON strategy, using dual-stage amplifier model over non identical spans. Simulations revealed that flexible grid optical network savings can substantially decrease if legacy amplifiers are used with the traditional power design.
More interestingly, we have shown that adapting optical launch powers to the real per-channel requirements in terms of SNR is an efficient method to keep in use legacy amplifiers and still benefit from flexible grid capacity gains.
Further work will deal with the online resource provisioning, considering power adaptation approach in the control plane.
REFERENCES
[1] O. Gerstel, M. Jinno, A. Lord, and S. J. Ben Yoo "Elastic optical networking: a new dawn for the optical layer?," Communications Magazine, IEEE , vol. 50, no. 2, pp. s12 - s20, February 2012.
[2] J-L. Auge, "Can we use Flexible Transponders to Reduce Margins?," Optical Fiber Communication Conference and Exposition and the National Fiber Optic Engineers Conference (OFC/NFOEC), pp. 1-3, 17-21 March 2013.
[3] P. Poggiolini, G. Bosco, A. Carena, R. Cigliutti, V. Curri, F. Forghieri, et al., "The LOGON Strategy for Low-Complexity Control Plane Implementation in New-Generation Flexible Networks," Optical Fiber Communication Conference and Exposition and the National Fiber Optic Engineers Conference (OFC/NFOEC), pp. 1-3, 17-21 March 2013.
[4] A. Bononi, P. Serena, and A. Morea, "Regeneration savings in coherent optical networks with a new load-dependent reach maximization,” Optical Communication (ECOC), European Conference on, pp. 1-3, 21-25 Sept. 2014.
[5] D. Amar, E. Le Rouzic, N. Brochier, J-L. Auge, C. Lepers, N. Perrot, et al., "How problematic is Spectrum Fragmentation in operator's Gridless network?," Optical Network Design and Modeling, International Conference on, pp. 67-72, 19-22 May 2014.
Fig. 1: Cost evolution per period for all scenarios (with a 90%
confidence interval). The extra design cost of FX106 scenario is not shown here. 100 300 500 700 900 1 2 3 4 5 6 7 C ost ( ar bi tr ar y un it ) Periods FX106 FX80DP FX80D FG
Fig. 2: Flexgrid saved spectrum evolution with respect to conventional
fixed grid network (FG) using a 90% confidence interval. 10 15 20 25 30 1 2 3 4 5 6 7 Sa ve d sp ec tr um % Periods FX80D FX80DP FX106