GEN-190-1
EFFECT OF THE DESIGN RESISTANCE OF STRUCTURES ON THE
EXTENT OF TRANSMISSION LINE CASCADING FAILURES
Oussama Lamine Naouali1, Sébastien Langlois1, Eng., Ph.D and Frédéric Légeron2, Eng., Ph.D 1Department of Civil Engineering, Universite de Sherbrooke, Sherbrooke, Qc, Canada
2Parsons, Abu Dhabi, United Arab Emirates
Abstract: Transmission line structures may suffer catastrophic losses when cascading failures occur.
These events are caused by dynamic loads often related to the sudden ruin of conductors or other mechanical equipment. One strategy that is commonly used to mitigate the risks of large losses is the insertion of more robust, anti-cascading supports at specific locations along the line, for example at every 10 towers. This strategy limits the maximum number of failed supports. However, to further reduce financial losses, it would be interesting to better control the extent of these events. On the other hand, many authors have developed numerical models to reproduce the dynamic behaviour of transmission lines subject to a broken conductor event. This paper studies, using a non-linear time history finite element model, the possibility to limit the extent of cascading failures simply by designing the supports to resist a certain portion of the dynamic load caused by a broken conductor. A parametric study is performed on a typical line section composed of tubular steel poles to provide graphs for the number of supports affected as a function of the structure resistance. Variables studied are the following: conductor mechanical tension, behaviour law of supports, span length, and insulator length. The results of this study show that the numerical method and the strategy presented could allow transmission line designers to make decisions on their structure resistance that could limit the extent of possible cascading failures to a certain desired number of supports.
1 INTRODUCTION
In past years, cascading failures of transmission lines have caused catastrophic losses to power utilities. Despite large efforts invested to mitigate cascading risks, such events were still reported in recent year (CIGRE 2012). They are triggered by dynamic loads often related to the sudden ruin of conductors or other mechanical equipment. Traditionally, suspension supports were designed mostly for vertical and transverse loads and offered very little resistance in the longitudinal direction, making them very vulnerable to cascading failures. Nowadays, design codes propose to consider longitudinal load cases to reduce the risks of cascades. For example, IEC 60826 standard (2003) proposes to consider torsional and longitudinal security loads to apply at conductor attachment points for the design of transmission structures. IEC 60826 also proposes, as an additional security measure, to place anti-cascading supports every 10 supports. This is a common strategy used by utilities to limit the potential losses due to cascading failures. However, to further reduce financial losses, it would be interesting to better control the extent of these events
On the other hand, many authors have developed numerical models to reproduce the dynamic behaviour of transmission lines subject to a broken conductor event. The first finite element models to study this phenomenon were developed by Thomas and Peyrot (1982). Then, the works of McClure and Tinawi (1987) and McClure and Lapointe (2003) used a commercial software to perform such studies and allowed to include a more precise definition of the structure’s model. More recently, Berubé (2012) introduced material non linearity in the behaviour of the structures during cascading events. The numerical tools now available allow to closely reproduce the dynamic behaviour of transmission lines. Such numerical models may help researchers and designers to optimize the design of transmission line structures and minimize the risks associated with cascading failures.
This paper studies, using a non-linear time history finite element model, the possibility to limit the extent of cascading failures simply by designing the supports to resist a certain portion of the dynamic load caused by a broken conductor. A parametric study is performed on a typical line section composed of tubular steel poles to provide graphs for the number of supports affected as a function of the structure resistance.
GEN-190-2
Variables studied are the following: conductor mechanical tension, behaviour law of supports, span length, and insulator length. Section 2 presents the line section studied and the hypotheses for the numerical model. Section 3 presents the parameters studied and Section 4 presents the results of the parametric study.
2 NUMERICAL MODEL
2.1 Line section studied
The transmission line section studied is based on the typical section presented by Mozer (1978). It represents a 230 kV line composed of 17 leveled spans with length 152.4 m. This line section contains: – 16 suspension tubular steel supports
– 2 dead-end towers
– 3 phases with single conductors 1590 kcmil 45/7 ACSR (Aluminium Conductor Steel Reinforced) – 1 steel ground wire with 7 strands and global diameter 13 mm.
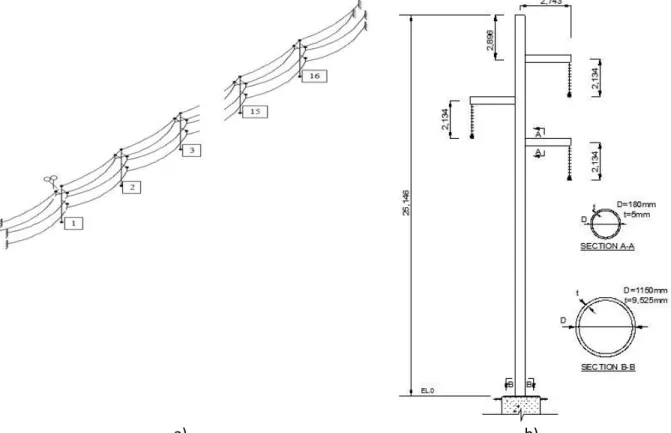
Cable properties and initial horizontal tensions are given in Table 1. A sketch of the line section is presented in Figure 1a. The main dimensions of the reference suspension supports are shown in Figure 1b. Unlike for the supports proposed by Mozer (1978), a constant diameter for both the main pole and the cross-arms is considered to simplify the model. The diameter and thickness of the main pole were selected to reach the yield stress at the base of the pole for the extreme loading considered. This will be further explained in Section 3. A diameter of 524 mm instead of 1150 mm would have allowed to match the overall horizontal stiffness of the tapered support proposed by Mozer (1978). The reference support considered is then much stiffer than the one from Mozer. However, the properties of the main poles will be varied over a large range of value in this study to analyse the effect of the deign resistance of the supports on the extent of cascading failure. The poles are made of steel with an elastic modulus of 2.1E11 Pa and density 7850 kg/m3. All
suspension supports in the line section are identical. It should be noted that the dimensions shown in Figure 1b are those for the reference model. These dimensions, as well as the span length, will be changed during the parametric study.
Table 1: Cable properties
Cable type Horizontal tension (kN) Weight (kg/m) Area (mm2) Elastic modulus (N/m2) Rated tensile strength (RTS) (kN) Conductor 1590 KCMIL 45/7 ACSR 44.48 2.667 861.29 6.48E10 178 Ground
GEN-190-3
a)
b)
Figure 1: a) Sketch of the line section. b) Sketch and dimensions of the suspension support.
2.2 Numerical method
The study was performed with the open finite element software Code_Aster (EDF 2015). The main pole and cross-arm is modeled with multi-fiber Timoshenko beam elements. This type of element was selected because it allowed to take into account both geometrical and material non-linearity. The insulators chains, conductors and ground wires were modeled with cable elements, which allow to consider geometrical non linearity.
Figure 2 shows the number of mesh elements used for each mesh group in the model. To verify that the mesh selected is adequate, two other models were considered: a first model where the number of mesh elements in the supports was doubled; a second model where the number of mesh elements in the cables was doubled. The model with refined mesh for the supports showed differences less than 5% for the peak base moment at the supports when compared to the model with the reference mesh. The refinement of the cable mesh had a negligible effect on the response of the system. For the models with increased span length, it was decided to keep constant the initial horizontal tension and conductor ground clearance for this tension. Therefore, the height of support was increased accordingly. Four and eleven mesh elements (with the same mesh element length as in the reference model) were added in group 2 for the span length of 304.8 and 457.2 m respectively.
The numerical analysis contains two main steps: the first step is a static analysis that allows to place the cables under the gravity loads; the second step is a non-linear dynamic analysis that allows to simulate the response of the line section in the event of broken conductors.
In the initial mesh, all cables are represented as straight lines between their attachment points. During the static analysis, two actions are applied to the model: i) a fictitious temperature variation is applied to the cables to ensure the cable length corresponds to the installed length of cable before elastic deformations; ii) the gravity load is applied to the cable and supports. Both actions are performed gradually to ensure
GEN-190-4
convergence of the model. During the static analysis, there are no cables in the first span. Instead, a horizontal longitudinal force corresponding to the horizontal tension and a vertical force corresponding to the weight of the cable for half of the span are applied to the conductors and ground wire attachment points on support 1. At the other end of the line section, the dead-end tower is not modeled and the cables are rather fixed at their respective attachment points. All suspension supports are rigidly fixed at their base. At the end of the static analysis, the cables are placed at the desired sag and tension.
The dynamic analysis starts with the output of the static analysis in terms of force and displacement. However, the vertical and horizontal forces applied at the cable attachment points of support 1 are removed, hence simulating the sudden failure of all phases of conductors and ground wire. The analysis uses the direct integration scheme HHT-alpha with α=-0.3. This induces numerical damping in the model that helps to stabilize the model. No other damping was added to the model. The time step is 0.01 second and the analysis is performed over 4 seconds. In Naouali (2014), this approach for modeling transmission line sections subject to broken conductors was validated with the experiments of Mozer (1978) on a small-scale three-span line section. A very similar model was also used by Berubé (2012) where it is compared to experiments on a small-scale line section composed of five spans with length 7.5 m.
Figure 2: Number of mesh elements per group in the model
3 Parameters studied
Starting from the reference model inspired by the line section presented by Mozer (1978), a parametric study was performed to better understand the influence of support resistance on the extent of cascading failures. Along with structure resistance, the following parameters were studied: conductor mechanical tension, behaviour law of the pole, span length, and insulator length.
In order to evaluate the effect of conductor loading on the extent of cascading failures, six levels of conductor mechanical tensions were considered. The reference tension of 44.48 kN corresponds to 25%
GEN-190-5
of the rated tensile strength (RTS) of the conductor. The other cases considered for conductor tension are 30%, 40%, 50% and 60% of RTS. The increase in conductor tension was supposed to be due to ice loading and therefore the density of conductors was adjusted to obtain the desired tension. From this conductor density, the equivalent uniform radial ice thickness was then calculated using IEC 60826 standard (2003). To get a realistic density for ground wires, this same radial thickness was applied.
The second studied parameter was the behaviour law of the steel poles. Three hypothesis were considered: i) an perfectly elastic behaviour with the modulus of elasticity of 2.1E11 Pa; ii) an elastic-perfectly-plastic behaviour with a yield stress of 345 MPa; and iii) a bilinear behaviour with a yield stress of 345 MPa and a plastic modulus of elasticity of 1E10 Pa.
Three values of span length and insulator length were also considered. Apart from the reference span length of 152.4 m, two other values were selected: 304.8 m and 457.2 m. Insulator length, Liso, for the reference case is 2.13 m. Two other values were considered: 0 m and 4.26 m.
For each line configuration the resistance of pole structures was varied. As mentioned earlier, the reference diameter and thickness of the main pole was selected to reach the yield stress at the base of the pole structure for the maximum dynamic loading. This is done iteratively by modifying the pole diameter and performing a dynamic analysis on the line section. The maximum loading always occurs at support 1 where the unbalanced load caused by the broken cables cause very large longitudinal forces. The maximum elastic moment, Me, is identified from the dynamic analysis (Figure 3, for example) for which the maximum stress (including both bending and axial stresses) at the base of the structure reaches a yield stress assumed to be 345 MPa. To simplify the procedure, the thickness was kept constant for all structures for a given span length and only the pole diameter was varied. Once the reference pole geometry and elastic moment for a given configuration is known, nine other pole designs with lower resistance were identified. The diameter of these pole structures are selected such that they have a normalized resistance of supports, α, between 0.1 and 0.9. This normalized resistance is defined by the moment resistance of the pole, Mr, divided by the elastic moment Me. Table 2 shows the pole geometry obtained for all line configurations and pole resistances. For a given analysis, all suspension supports in the line section have the same resistance. Using the equations provided by ASCE 48-11 (2011), it was verified that the local buckling does not affect the capacity of the poles for all pole geometries considered.
GEN-190-6
Table 2: Pole geometry for various line configurations and support resistances
Diameter of pole (mm) for all values of α Span length (m) Liso (m) Thickness (mm) 0.1 0.2 0.3 0.4 0.5 0.6 0.7 0.8 0.9 1.0 152.4 0 9.525 320 440 540 620 680 740 800 860 920 960 2.13 380 520 640 740 820 900 960 1040 1100 1150 4.26 420 580 700 820 900 1000 1080 1140 1220 1280 304.8 0 12.70 360 500 620 720 800 860 940 1000 1060 1110 2.13 380 540 660 760 840 920 500 1060 1120 1190 4.26 460 640 780 880 1000 1080 1160 1240 1320 1400 457.2 0 19.05 360 500 600 680 780 840 900 960 1020 1070 2.13 380 520 640 720 800 880 960 1020 1080 1130 4.26 380 540 640 740 820 900 960 1040 1100 1150 4 Results
This section shows the most significant results obtained from the parametric study. As observed in Figure 4, the model allows to study the dynamic behaviour of the line section after the failure of all cables at support 1. The results obtained allow to evaluate the structural response of the system as a function of time during the 4 seconds of the numerical analysis. However, the main interest of this study is to evaluate how many supports would be affected by a cascading failure as a function of the support resistance. The criteria for defining the failure of supports is simply assumed to be the exceeding of the yield stress in the main pole of the support.
Figure 4: Example of structural response of span 2 after the failure of cables.
4.1 Conductor mechanical tension
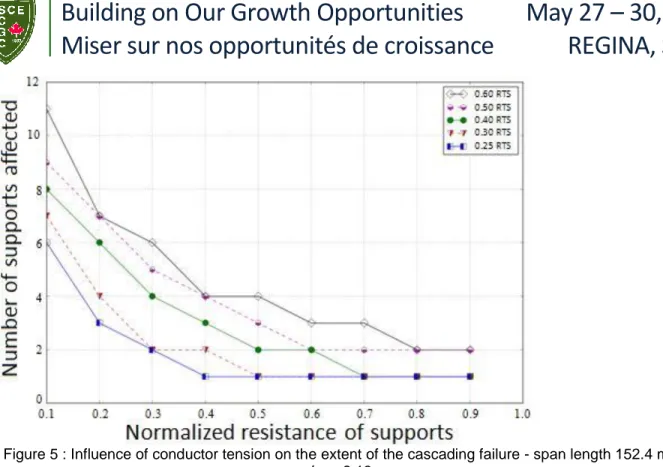
Figure 5 shows the number of supports affected as a function of the support resistance for five levels of mechanical tension in the conductors and an elastic behaviour of the supports. First, it shows that, as expected, the number of supports affected consistently decreases as the design resistance of the structures increases. Second, it shows that for the configuration studied, when the normalized resistance is below 0.4, the number of supports affected increases rapidly with a decreasing resistance. Third, the figure shows the important effect of conductor tension on the number of supports affected. This means that designers should carefully select the load case under which they consider broken conductors to occur.
GEN-190-7
Figure 5 : Influence of conductor tension on the extent of the cascading failure - span length 152.4 m and Liso= 2.13 m.
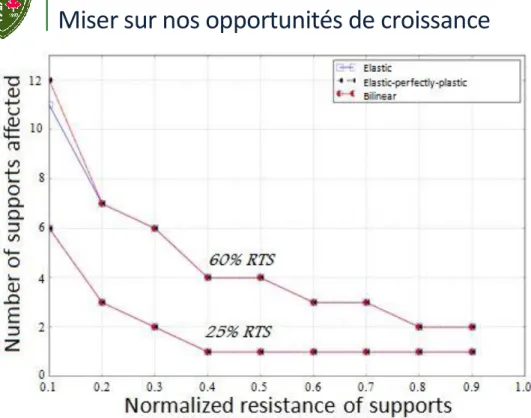
4.2 Behaviour law
Figure 6 shows that the different hypotheses regarding the linear or non-linear behaviour law of the steel pole structures have a very limited impact on the number of supports affected by the failure. However, this conclusion may be different if the failure criteria was not the exceeding of the yield stress and was instead the exceeding of a certain ductility demand. Such approach could allow to take advantage of the capacity of the structure to undergo permanent deformations before its complete failure. Although the number of supports affected does not differ much according to the behaviour law, the response of the system is still significantly different.
4.3 Span length
The results from the parametric study showed that the response of the line section varies greatly with span length. However, as shown in Figure 7, the extent of the failure does not vary much with span length.
4.4 Insulator length
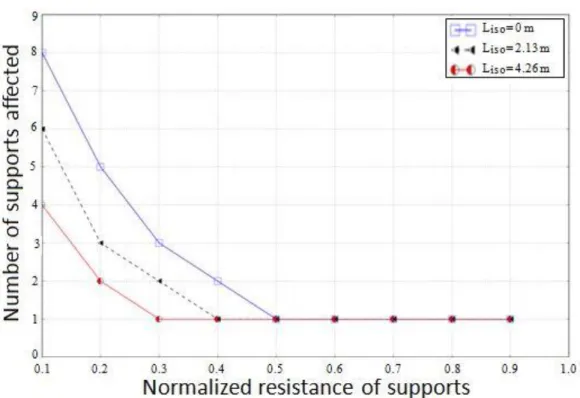
As for the span length, the insulator length has a large influence on the dynamic response of the line section. Again, its effect of the extent of the failure is limited. Figure 8 shows some effect of the normalized resistance on the extent of failure for a span length of 152.4 m. For normalized resistance below 0.5, short insulators cause a higher number of supports affected. However, Figure 9 shows that the trend for larger spans is less clear. Figure 9 shows the results for a tension of 60% RTS. However, for a tension of 25% RTS, the three curves are actually perfectly matching. Hence, the effect of insulator length for larger spans becomes less significant.
GEN-190-8
Figure 6: Influence of the behaviour law on the extent of the cascading failure – span length 152.4 m and Liso= 2.13 m.
Figure 7 : Influence of span length on the extent of the cascading failure - span length 152.4 m and Liso= 2.13 m, and elastic behaviour.
GEN-190-9
Figure 8 : Influence of insulator length on the extent of the cascading failure - span length 152.4 m, tension 25% RTS, and bilinear behaviour.
Figure 9 : Influence of insulator length on the extent of the cascading failure - span length 457.2 m, tension 60% RTS, and bilinear behaviour.
5 Conclusions
This paper presented a parametric study to evaluate the influence of support design resistance on the extent of cascading failures of transmission line subject to broken conductors. The study was performed on a typical tubular steel pole line section composed of 17 spans. A non-linear time history analysis was done
GEN-190-10
to evaluate the dynamic response of the structural system. The parameters studied are the conductor mechanical tension, the behaviour law of the supports, the span length, and the insulator length. For the line configuration studied, the following conclusions can be drawn from this study:
- As expected, the number of supports affected by the failure decreases as the normalized design resistance increases.
- An increase in mechanical tension, simulated by increasing the cable densities to reproduce ice accretion, increases significantly the number of supports affected.
- Considering the non-linear behaviour of poles does not have a significant effect on the number of supports affected, as long as the failure criteria considered is exceeding of the yield stress in the steel pole.
- The effect of normalized resistance on the extent of failure is very similar for various span lengths.
- For small span lengths, shorter insulators means more supports affected. For higher span lengths, the trend is less clear.
The method proposed in this study could be applied to other line configurations. This approach could help designers to control the risks associated with cascading failures by selecting a design resistance for the supports. To do so, the designer needs to make decisions on the following aspects: the number of conductors broken during the accidental event, the loading case on conductors to be considered, the failure criteria for the supports, and the acceptable number of supports failed during an event. Future works include the application of the modeling method to lattice towers and the consideration of the ductility of structures in the failure criteria of supports.
Acknowledgements
This work was financially supported by Hydro-Québec, RTE and the National Sciences and Engineering Research Council of Canada (NSERC).
References
ASCE 48-11 (2011). Design of Steel Transmission Pole Structures. American Society of Civil Engineers. Bérubé, L. P. 2012. Effets de l'ajout d'un mécanisme ductile à la console sur la réponse d'un pylône aux
bris de conducteurs. Mémoire de maîtrise. Département de génie civil, Université de Sherbrooke. CIGRE (2012). Mechanical Security of Overhead Lines - Containing Cascading Failures and Mitigating
their Effects (Technical Brochure No 515). Working Group B2.22, International Council on Large Electric Systems.
Code Aster software. EDF, 2015. [Online]. Available: http://www.code-aster.org
IEC 60826, 2003. Design Criteria of Overhead Transmission Line. International Standard, International Electrotechnical Commission, Switzerland.
Mozer, J. D. 1978. Longitudinal unbalanced loads on transmission line structure (Technical report EL-643). Electric Power Research Institute.
McClure, G., and Lapointe, M. 2003. Modeling the structural dynamic response of overhead transmission lines. Computers & Structures, 81: 825-834.
McClure, G., and Tinawi, R. 1987. Mathematical modeling of the transient response of electric transmission lines due to conductor breakage, Computers & Structures, 26(1/2): 41-56.
Naouali, O. L. 2014. Étendue des ruines en cascade des structures des lignes de transport d’énergie en fonction des charges de conception. Mémoire de maîtrise. Département de genie civil, Université de Sherbrooke.
Thomas, M., and Peyrot, A.H. 1982. Dynamic response of ruptured conductors in transmission lines. IEEE Transactions on Power Apparatus and Systems, PAS-101(9): 3022-3027.