This is an accepted manuscript of an article published by Elsevier in Accident Analysis & Prevention on May 5 2017, available at http://dx.doi.org/10.1016/j.aap.2017.04.015
This manuscript version is made available under de CC-BY-NC-ND 4.0 license http://creativecommons.org/licenses/by-nc-nd/4.0/
Please cite as:
Cloutier, Marie‐Soleil, Ugo Lachapelle, Andrée‐Anne d’Amours‐Ouellet, Jacques Bergeron, Sébastien Lord, and Juan Torres. 2017. "“Outta my way!” Individual and environmental correlates of interactions between pedestrians and vehicles during street crossings." Accident Analysis & Prevention 104 (July):36‐45. doi: 10.1016/j.aap.2017.04.015.
“OUTTA MY WAY!” INDIVIDUAL AND ENVIRONMENTAL CORRELATES OF INTERACTIONS BETWEEN PEDESTRIANS AND VEHICLES DURING STREET CROSSINGS
ABSTRACT
Because pedestrian crash rates remain lower than other collision types, surrogate
measures such as traffic interactions are now used in road safety research to complement crash history. Using naturalistic data collection, we sought to assess 1) the likelihood of occurrence of interactions between pedestrians and vehicles based on individual and crossing characteristics; and 2) differences in interaction characteristics between children, adult and senior pedestrians. Observations of pedestrian crossing behaviours (n=4687) were recorded at 278 crossings. For recorded interactions (n=843), information was collected to characterize the behaviours of involved parties. A mixed-effect logit regression model was performed to assess the factors associated with interactions. Chi-square tests evaluated differences between age groups and characteristics of observed interactions. Older adults were those more likely to be involved in an interaction event. Bicycle paths, different crossing surface material and one-way streets were significantly associated with fewer interactions with vehicles, while parked vehicles nearby and crossings on arterial roads were significantly associated with more interactions. Children and the elderly (80 years of age or more) did have distinct patterns of interaction, with more careful drivers/cyclists behaviours being observed towards children and lesser regulation compliance towards the elderly. Given the growing emphasis and adoption of
active transportation in many cities, the number of interactions between pedestrians and vehicles during street crossings is likely to increase. Educating drivers and pedestrians to respect each other’s space requires an understanding of where, between whom, and under what circumstances interactions occur. Such an approach can also help identify which engineering and enforcement programs are needed to ensure safe pedestrian crossings since interactions can be good markers of uncomfortable crossing situations that may deter walking and lead to more collisions.
Keywords: Traffic conflict techniques; interactions; pedestrians; children; seniors; street crossing behaviour.
1. PEDESTRIANS CRASH RISK IN CITIES: WHAT TO MEASURE? A growing number of North American cities have been actively promoting
non-motorized transportation and developing road infrastructure to support the use of these travel modes. Despite this, crash statistics show that many unsafe conditions still exist for vulnerable road users such as pedestrians, partly because modern cities were (and are still) mostly built for cars [1-3].
On the other hand, local pedestrian crashes can be considered “rare events,” at least from a statistical perspective [4, 5]. Pedestrian crash counts are usually lower than those of any other type of road users at the city level, making it difficult for cities to effectively plan and justify preventive measures at specific site. In fact, past collisions alone are
considered by many researchers to be inefficient at predicting future ones [6-8]. As a result, surrogate measures such as traffic conflicts and interactions are increasingly used in road safety research as complementary to crash history [9, 10] in order to have a better portrait of the situation and plan road design accordingly.
1.1 Surrogate measures of crash risk: Traffic conflict techniques and interactions
The concept of “traffic conflict techniques” was first proposed in the 1960s as a
complementary approach to typical collision-based safety analysis. A traffic conflict was first described as an event where “two or more road users approach each other in space and time to such an extent that a collision is imminent if their movement remains unchanged” [11]. This definition has been extended throughout the years to include less critical conflicts—in other words, situations where road users adapt their behaviour ahead
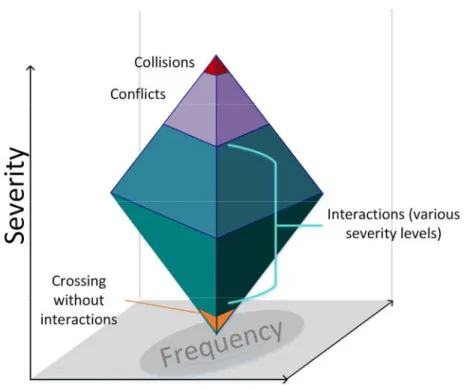
of the “conflicting zone”, leaving time and space for fluid movement while both users are on the street. Those common pedestrian-vehicle conflicts, referred to as “interactions,” can be seen as part of the road safety continuum shown in the diamond-shaped
representation proposed by several authors (see Figure 1) [6, 7, 12]. This broader definition of interactions, as event where both a vehicle and a pedestrians are on the roadway at the same time and adapt their behaviour consequently to avoid a collision, is the one used here.
While there are more published accounts of conflicts between motorists, traffic conflict literature that focuses on pedestrians [3, 13] is less frequent. So far, there is no reason to think that this surrogate measure of crash risk is not applicable to pedestrian/vehicle conflicts, even if the predictability of the pedestrian behaviour is more complex than that of motorists. However, the reflection on how suitable the usual conflict and interaction indicators are when pedestrians are at stake still needs to be undertaken, as stated in a recent report [14]. Moreover, even when interactions do not lead to injuries, they may be symptomatic of environments that are not adapted to pedestrians. In this context, studying interactions can provide insight into the initial circumstances that may lead to crashes (or not). It is even more important to have a better understanding of interactions involving the most vulnerable pedestrians, namely children and seniors. In a context where these sub-populations are already targeted in active living and transportation policies and programs [15, 16], these interactions might contribute to their risk perception while on the street and consequently have an effect on the decisions they make to move around as pedestrians.
FIGURE 1: Road safety continuum for vehicle-pedestrian interactions
1.2 Objectives
This paper seeks to provide a better understanding of the individual and environmental determinants associated with the occurrence of interactions between pedestrians and other road users (cars and bikes, other) during pedestrian crossings at intersections. As a
secondary objective, it seeks to explore differences in interaction characteristics when comparing observed children, adult and senior pedestrians. By providing findings related to these objectives, we seek to strengthen the research background on pedestrian
interactions through an important observational study.
2. INDIVIDUAL AND ENVIRONMENTAL DETERMINANTS OF PEDESTRIAN-VEHICLE COLLISIONS AND INTERACTIONS
Individual and environmental determinants of pedestrian crashes are well known and have unfortunately changed very little in the past 25 years, especially in the Western hemisphere [17]. Similarly, research using surrogate measures highlights the same causal patterns in both near misses (conflicts) and crashes [10, 18, 19], at least for car-to-car events. Since pedestrians are rarely targeted by this research, our analytical framework below is based on both collision, conflict and interaction literature and explores
relationships to sociodemographic, behavioural and physical crossing environment characteristics.
When evaluating associations between individual characteristics and pedestrian-vehicle collisions, age and gender are two variables often taken into account. Compared to the general population, ageing pedestrians are overrepresented in crashes compared to their relative proportion of the population [20, 21]; up to 50% of all injured pedestrians in OECD countries are seniors [2]. They are also more severely injured in road crashes and experience longer hospital stays (3 to 5 times more than injured pedestrians between 15 to 64 years old) [22, 23], due to their prior physical condition. Children generally experience fewer injuries [24], but within the 0- to 18-year-old group, 5- to 9-year-olds are most at risk due to cognitive (less mature), physical (shorter, less visible through traffic) and exposure (beginning of independent mobility) reasons [25, 26]. As for gender, middle-aged men are the most at-risk pedestrians [24, 27], along with younger boys (5 to 9), who might be more involved in collisions because of their greater exposure to traffic (more independent mobility than girls) [25]. Lastly, behaviour such as walking
speed has been the focus of much attention lately, namely for elderly pedestrians. In fact, some have hypothesized an association between their slower walking speed, due to the process of ageing and change in their capabilities, and their injury risk, referring to this as the “slow walking speed hypothesis” [28], which was positively tested in a recent paper on elderly pedestrians who complete their crossing on a red light [29]. If we consider the time spend on the street as a measure of exposure to risk at the crosswalk level [30], this walking speed variable should be analyzed accordingly.
Beyond these individual characteristics, streets and intersections have also been studied for their associations with pedestrian crashes, but also with pedestrian behaviours. Characteristics such as presence of arterial roads are known to increase collision rates [31-33]. On the contrary, signalized intersections (traffic lights) are known to decrease the probability of collisions for children [25, 34] and the probability of fatal collisions for adults [35]. However, Svensson and Hydén [36] found that signalized intersections seem to produce more high-severity interactions than non-signalized ones. One-way streets are related to more collisions in children [34, 37], but Dai et al. [38] found the opposite on university campuses. As for marked crosswalks, the higher collision rates found for adults [33, 39], seniors [40] and children [34] might be explained by the fact that there is more traffic and/or a greater number of pedestrians at these particular crosswalks [41]. Inversely, experiments involving different pavement marking configurations found a reduction in pedestrian-vehicle conflicts and an increase in the yielding distance [42]. Of all the variables in the models proposed by Lachapelle and Cloutier [29], the presence of cycling infrastructures had the strongest odds of being associated with an elderly
pedestrian finishing on a red light when crossing. The cognitive complexity of dealing with this added infrastructure (needing to look both ways more than once) was thought to cause this effect.
Visibility, both for pedestrians and drivers, is crucial for avoiding collisions at intersections. Accordingly, parking bans (or presence of parked vehicles) and traffic calming devices such as curb extensions have been put forward as measures to increase visibility. However, the presence of vehicles parked at the curb revealed contradictory effects in different studies: while Tom and Granié [43] show that pedestrians display more cautious crossing behaviour when there are no parked vehicles nearby, Yannis et al. [44] found that the presence of illegally parked vehicles at mid-block crossings makes pedestrians more careful because of reduced line of sight. In the case of child pedestrians, where visibility is even more important because of their height, several authors found an association between the presence of parked cars and increased collision rates [34, 45]. Curb extensions, for their part, are known to be effective at improving visibility [46, 47], but few studies have examined their effectiveness at reducing collisions or interactions (for some of them, see Mead et al. [48]).
In terms of behaviours associated with the number of interactions, the work of Kaparias
et al. [3] shed light on the fact that “there are no generic behavioural criteria that can be
used to examine lower severity interactions in different traffic situations.” However, their work suggested that key traits related to pace (drivers and pedestrians) and direction
from the Swedish researchers added two other elements: road safety regulation
compliance (e.g.: yielding) from both drivers and pedestrians, and looking behaviours [6,
36]. Accordingly, pedestrians who did not look before they crossed a signalized intersection had more risk of being involved in a traffic conflict [6].
3. ANALYTICAL MODEL
The relatively small number of research on pedestrian-car conflicts and interactions has typically collected data either through video (and post-collection coding grid) or direct observation of behaviours (3; 6; 13; 36; 42). Analyses are based on several indicators, some related to the pedestrian (looking, yielding to cars), to the driver (speed changes, yielding to pedestrians) or both (yielding distance, time-to-collision, etc.), but almost none of those research studied the effect of the crossing site characteristics on those indicators. In addition, they either focus on one specific age group (e.g. seniors) or do not compare age groups within their sample. Finally, their definition of “conflict” is fairly narrow, including only events under a specific threshold such as a short time-to-collision indicator or a small yielding distance.
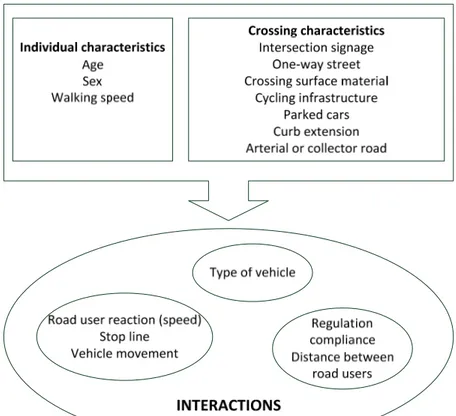
In order to assess the occurrence of interactions between pedestrians and other motorized road users as an outcome, we posit that information on the individual, behavioural and environmental characteristics as well as location of the crossing must be observed. Our analytical framework answers some of the conceptual and methodological limitations found in previous research, such as a comparison between age groups, a broader definition of “interaction” and the inclusion of environmental variables to explain the occurrence of interactions between pedestrians and vehicles. The manner in which we
organized these concepts around our objectives is presented in Figure 2. As seen in the previous section, existing research both in conflict and crash literature has identified some of these correlates, but seldom studied them jointly using a naturalistic research design like the one proposed here, which include direct non-participatory observation of pedestrians in their “natural” environment, when they cross the street.
FIGURE 2: Analytical model for interactions involving crossing pedestrians and vehicles
4. METHODS
Child, adult and senior pedestrians were observed crossing as part of two road safety research projects on the association between street environment and pedestrian road risk (one targeting children and the other, seniors). Data collection was undertaken between May and November 2013 in five different cities in the province of Quebec, Canada: Montreal, Laval, Longueuil, Quebec City and Gatineau. Those cities were chosen for their representativeness of the North American urban form and for their involvement in walk-to-school programs. Observation sites were selected to represent a variety of street crossing situations at intersections, because the majority of collisions occur at
intersections [49]: 1) near elementary schools (n=23) located in different urban forms (urban, suburban, dense and less dense) in order to get a sufficient number of
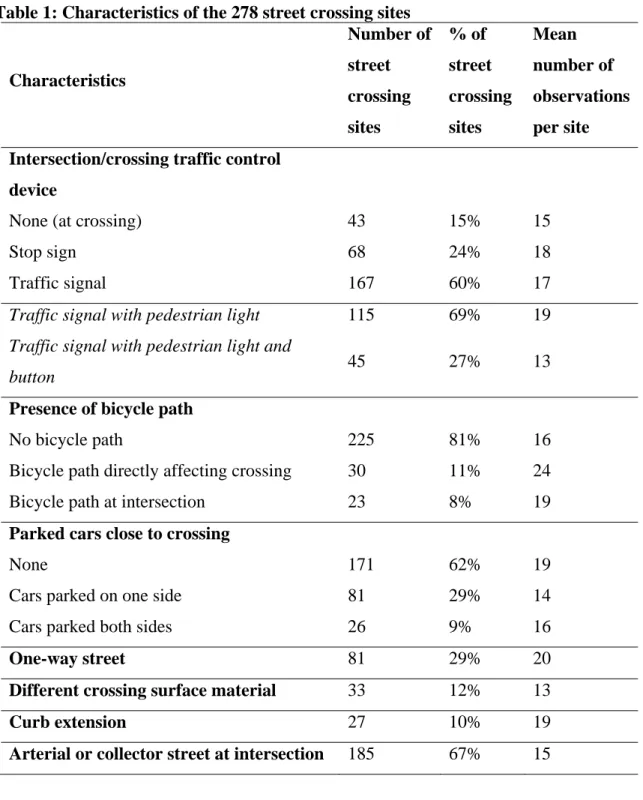
observations in a short period of time (before and after school); 2) “points of interest” for seniors around these schools: drugstores, banks, clinics, coffee shops, etc. [50]; and 3) either where higher proportions of elderly people reside (2006 Canadian census) or where major seniors’ residential complexes are located. Observers were given a list of initial intersections within the vicinity of schools to observe children before and after school, but were allowed to move to other nearby locations if few adult and senior pedestrians were crossing there during the day. In the summer, intersections near parks were added to the initial ones to observe more children during daytime. Retained characteristics of crossing sites are presented in Table 1, where we can see a greater proportion of sites with traffic signals, with arterial or collector street at intersection, with no bicycle path or with parked cars. One third of the crossing sites were on one-way streets, and around 10% had either a curb extension or different surface material to mark the crossing.
Table 1: Characteristics of the 278 street crossing sites Characteristics Number of street crossing sites % of street crossing sites Mean number of observations per site Intersection/crossing traffic control
device
None (at crossing) 43 15% 15
Stop sign 68 24% 18
Traffic signal 167 60% 17
Traffic signal with pedestrian light 115 69% 19
Traffic signal with pedestrian light and
button 45 27% 13
Presence of bicycle path
No bicycle path 225 81% 16
Bicycle path directly affecting crossing 30 11% 24
Bicycle path at intersection 23 8% 19
Parked cars close to crossing
None 171 62% 19
Cars parked on one side 81 29% 14
Cars parked both sides 26 9% 16
One-way street 81 29% 20
Different crossing surface material 33 12% 13
Curb extension 27 10% 19
Arterial or collector street at intersection 185 67% 15
Student observers (team of 3) were trained to fill out three different observation grids, linked together by unique IDs: 1) characteristics of the street crossing environment (up to 4 pedestrian crossings per 4-way street intersection); 2) observation of pedestrian
characteristics (if applicable) during the crossing. Street crossings were recorded in the morning and afternoon for children (half an hour before and one hour after school hours, typically between 7:30–8:00 a.m. and 3:30–4:30 p.m.) and mid-day for adults and seniors (between 9:00 a.m. and 4:00 p.m.). These periods were selected to ensure that a
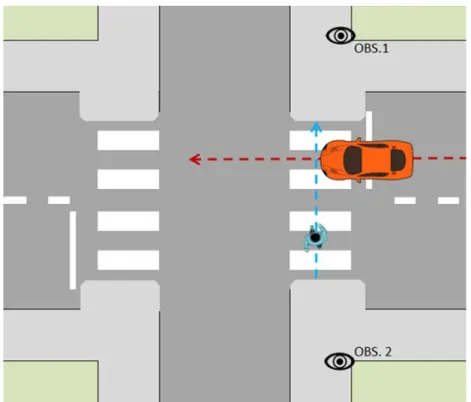
reasonable amount of observations could be conducted since they are the time period with the most pedestrians in two of the targeted age group (children and seniors). Teams of two observers (one for pedestrians, the other for interactions with vehicles) were positioned, one on each side of the street, slightly set back from the crossing to avoid contact with observed pedestrians (see Figure 3).
4.2 Street crossing environment characteristics
As previously mentioned, the street crossing environment grid refers to the pedestrian crossing and surroundings at the curb. After initial data analysis, six elements of the original grid are included in this paper: presence and type of traffic control device
(presence or absence of traffic lights for vehicles and pedestrians); one-way street or not; different crossing surface material (anything outside marked pavement); presence of cycling infrastructure; presence of parked cars near the crossing; presence of curb extensions and presence of arterial or collector roads at the intersection.
4.3 Observed pedestrian crossing behaviours and interactions with other road users Observation of crossings was conducted using an observation grid adapted from previous work [43, 51]. Three individual variables were retained here: age (estimated in 5
“running” when compared to an average adult speed) of the observed pedestrians (see Table 2).
As stated earlier, we used a broader definition of interactions in order to be able to capture events with “dangerous proximity” [13], which can be considered serious incidents, particularly for the two targeted groups, namely child and senior pedestrians. Therefore, interactions were recorded when the pedestrian’s path (blue line in Figure 3) and the driver’s path (red line) crossed while the pedestrian was still on the street (on the pavement, not curb). This definition recalls the one used by Kaparias et al. (3) in a shared-space context. Each time these two paths crossed, one of the observers recorded characteristics related to the type of vehicle involved (car, bus, bike, etc.) and to the observed pedestrians’ and drivers’ behaviours during the interaction. For this paper, we will test five different behaviours, based on existing results (the first two) or on our field experience with pedestrian crossings (the last three) (see Table 4 for the detailed
categories): the driver’s reaction during encounter (from slowing down to accelerating); observed distance between car and pedestrian (estimated at less than a meter, 1 to 2 meters or more than 2 meters); and vehicle movement during interaction (straight line, right or left turn); whether the vehicle was passing the stop line (or not); and pedestrian priority compliance (from drivers and/or pedestrians) .
FIGURE 3: Data collection protocol and definition of an interaction
4.4 Statistical analyses
The final database includes pedestrian crossing observations, interaction characteristics (if applicable) and crossing environment characteristics, including a unique ID for observation grouping by location. After providing descriptive bivariate analyses, a mixed-effect logit model was used to assess the correlates of interactions with other road users while crossing, accounting for the grouping of observations in selected crossing environments using a random effect [52]. This model was computed in addition to a basic logistic regression model. Finally, Chi-squared tests were used on the interactions’ subset of data (n=843) to highlight significant associations between interaction characteristics and age group. All analyses were carried out using Stata 14.
5. RESULTS
5.1 Descriptive statistics of pedestrian observations and crossing sites
Data collection resulted in 4,687 pedestrians observed at 278 crossing sites. Almost half of them were seniors (46%) because of the original study design requiring oversampling of the elderly, but there was an almost equal number of men and women and the most frequent walking speed recorded was “normal,” despite the age of the observed
pedestrians (see Table 1 for percentages). As for children, only 17% of our sample was collected during summer months since most of the observation sites were near schools during school periods. Interactions were observed for 18% of the pedestrians, with only 8 observations being a serious conflict according to the sudden avoidance behaviour of one of the protagonist (e.g. breaking for drivers, jumping backward for pedestrians).
A larger proportion of observations were made at crossing sites with traffic lights, which could partially be explained by the search for points of interest, usually on main roads, also overrepresented here. Another hypothesis would be that seniors tend to cross more at intersections with traffic lights for a variety of reasons such as better trust in the ability to cross safely, as it was observed before [53]. One third of the observation sites were one-way streets while respectively only 11% and 9% of them had curb extensions and/or a different surface material used to delineate the crossing. Lastly, a smaller number of observations were located near a bike path, located either directly at the crossing or at the intersection (21%) and a third of the observation had parked cars on one or both sides of the streets (Table 2).
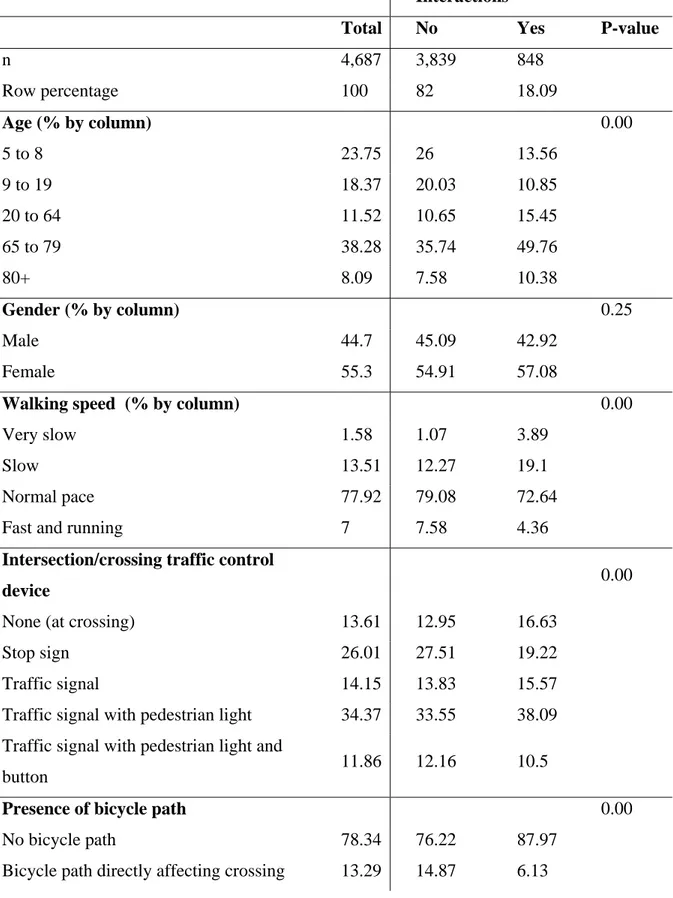
TABLE 2: Descriptive statistics (n=4,687 observed pedestrian crossings) Interactions
Total No Yes P-value
n 4,687 3,839 848 Row percentage 100 82 18.09 Age (% by column) 0.00 5 to 8 23.75 26 13.56 9 to 19 18.37 20.03 10.85 20 to 64 11.52 10.65 15.45 65 to 79 38.28 35.74 49.76 80+ 8.09 7.58 10.38 Gender (% by column) 0.25 Male 44.7 45.09 42.92 Female 55.3 54.91 57.08
Walking speed (% by column) 0.00
Very slow 1.58 1.07 3.89
Slow 13.51 12.27 19.1
Normal pace 77.92 79.08 72.64
Fast and running 7 7.58 4.36
Intersection/crossing traffic control
device 0.00
None (at crossing) 13.61 12.95 16.63
Stop sign 26.01 27.51 19.22
Traffic signal 14.15 13.83 15.57
Traffic signal with pedestrian light 34.37 33.55 38.09 Traffic signal with pedestrian light and
button 11.86 12.16 10.5
Presence of bicycle path 0.00
No bicycle path 78.34 76.22 87.97
Bicycle path at intersection 8.36 8.91 5.9
Parked cars close to crossing 0.00
None 69.06 70.2 63.92
Cars parked on one side 23.41 22.17 29.01
Cars parked both sides 7.53 7.63 7.08
One-way street 32.94 34.15 27.48 0.00
Different crossing surface material 8.92 9.51 6.25 0.00
Curb extension 10.65 11.38 7.31 0.00
Arterial or collector street at intersection 59.36 58.4 63.68 0.01
5.2 Individual and crosswalk characteristics related to interaction occurrences Descriptive statistics and Chi-squared tests are presented in Table 2. While gender was not significant, age was positively associated with interactions, with the 65-79 year-old age group experiencing the highest proportion of interactions. Almost half of the observed pedestrian in that age group had an interaction with a vehicle or a bike. As mentioned earlier, crossing speed of elderly is likely a contributing factor, since very slow and slow speeds are significantly associated with more interactions.
All crossing site variables are significantly associated with interactions. One-way streets and different crossing surface materials both had significantly fewer interactions. When bicycle paths were present, as well as when the crosswalk was extended (curb extension), the share of interactions was also significantly lower. Both the presence of parked cars on the corner and of an arterial or collector street at the crossed intersection led to more interactions. Lastly, the occurrence of interactions differed significantly between types of street signal. Crossing at intersections with both traffic and pedestrian lights was
5.3 Mixed-effect logit model
To account for the grouping of observations by crossing sites, we modeled the binary variable of interactions (yes/no) in a mixed-effect logit model and compared the results to a simple multivariate logistic regression (see Table 3). As per the Akaike Information Criterion (AIC), the mixed effect logit model performed considerably better. While the relationships between age, gender and walking speed remained similar in both models, crossing environment variables displayed different patterns. Since nearly 30% of the variance in the logit model is explained by the grouping of observations in studied intersections, we can hypothesize that several of the significant results are now amalgamated in this coefficient (i.e.: the crossing site constant is also significant).
Gender does not influence interaction probability in our models. However, in all age groups—younger and older adults—positive odd ratios were around 2.7, while children experienced less interactions than other groups. As for walking speed, “very slow” walking speeds made all other categories negatively associated to interactions, with odd ratios as low as 0.194 for pedestrians going fast or running. With respect to crossing environment characteristics, six of the seven variables were significantly associated with interactions. The only characteristic not significant in the mixed-effect logit model (traffic control device) was significantly and negatively related to interactions in the logistic model (presence of traffic signal), suggesting that this effect was captured by the random effect of street crossings groupings. The presence of four characteristics
street, when crossing had a different surface material, when a bicycle path directly affected crossing and when a curb extension was present. Two variables were positively related to interactions: when cars were parked close to one side of the crossing and when an arterial or collector road was part of the intersection.
TABLE 3: Logistic regression of likelihood of interactions and conflicts (Odds ratio)
Outcome: Interactions yes/no Logistic model
Mixed-effect logit model Age 5 to 8 0.94 0.934 9 to 19 (ref.) 20 to 64 2.916*** 2.831*** 65 to 79 2.612*** 2.745*** 80+ 2.100*** 2.631*** Female 0.98 1.019 Walking speed
Very slow (ref.)
Slow 0.413*** 0.328***
Normal pace 0.309*** 0.236***
Fast and running 0.222*** 0.194***
Traffic control device
None (at crossing) (ref.)
Stop sign 0.96 0.921
Traffic signal 0.552*** 0.533
Traffic signal with pedestrian light 0.85 0.62 Traffic signal with pedestrian light and button 0.74 0.726
Presence of bicycle path
No bicycle path (ref.)
Bicycle path at intersection 0.572** 0.479 Parked cars close to crossing
No parked cars (ref.)
Cars parked on one side 1.383*** 1.613*
Cars parked both sides 1.432* 1.59
One-way street 0.656*** 0.591*
Different crossing surface material 0.382*** 0.419**
Curb extension 0.74 0.611
Arterial or collector street 1.295** 1.592*
Constant 0.489* 0.447
Crossing site constant / 3.854***
ICC / 0.2908 Observations 4687 4687 Chi square 302.3 111 Significance 0.000 0.000 Pseudo R squared 0.068 / AIC 4171.7 3904.6 * p<0.05, ** p<0.01, *** p<0.001
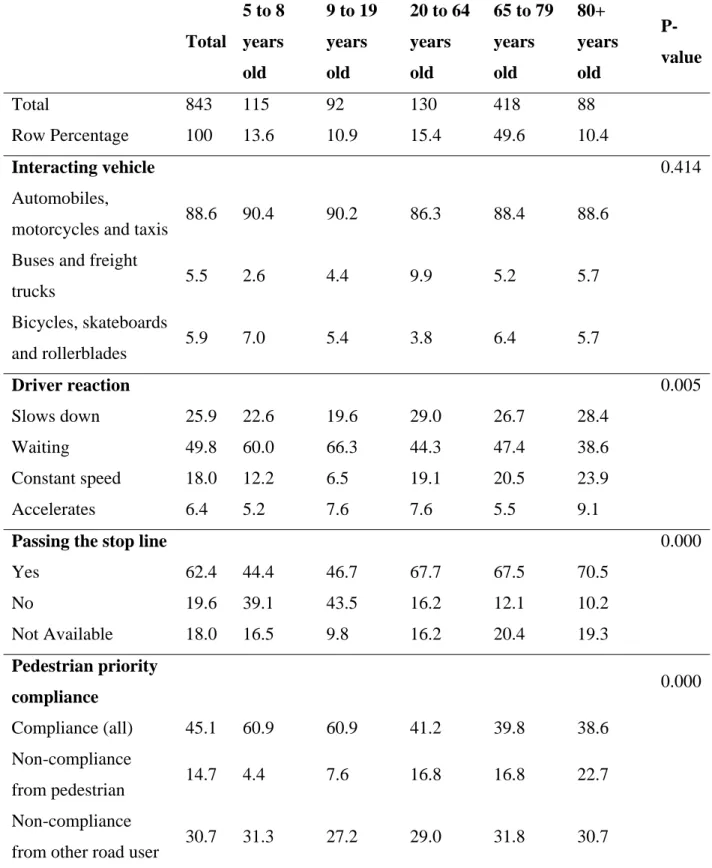
5.4 Behaviours during interactions and age difference
Turning to an analysis of recorded interactions (n=843), Table 4 provides cross
tabulations for the behavioural characteristics of interactions across age groups. Of the six variables we tested, five were significant associated, based on Chi-squared tests. Vehicle type was the only variable that was not significant. When looking at proportions, children’s age groups (5 to 8 and 9 to 19 years old) seem to have distinct behaviours since they were present in greater proportions when road users were waiting and had a straight course. The stop line was not respected by a larger proportion of road users when child pedestrians were crossing, but the distance between the pedestrian and the vehicle
was greater (more than 2 meters 44% of the time), and both protagonists respected road regulations in greater proportions. Adults were involved in more interactions where the driver/cyclist was turning right and in interactions where both road users were not in compliance with the rules. The 65 to 79 years old group were more frequently involved in interactions with vehicles at constant speed and in cases when the pedestrian was at fault, in a proportion similar to adults (17%). Lastly, the oldest age group (80+) was involved in riskier interactions several times: when vehicles were going at constant speed or were accelerating (23% and 9% respectively) and when pedestrians were at fault (23%). No clear tendencies are shown for distance between the eldest pedestrians and vehicles: either it was very short (less than 1 meter for 23% of them) or very long (more than 2 meters for 33% of them). On a positive note, the stop line was respected by 71% of drivers/cyclists facing an 80+ pedestrian, the largest proportion of all age categories.
TABLE 4: Descriptive statistics (%) of interaction characteristics across age groups Total 5 to 8 years old 9 to 19 years old 20 to 64 years old 65 to 79 years old 80+ years old P-value Total 843 115 92 130 418 88 Row Percentage 100 13.6 10.9 15.4 49.6 10.4 Interacting vehicle 0.414 Automobiles,
motorcycles and taxis 88.6 90.4 90.2 86.3 88.4 88.6 Buses and freight
trucks 5.5 2.6 4.4 9.9 5.2 5.7 Bicycles, skateboards and rollerblades 5.9 7.0 5.4 3.8 6.4 5.7 Driver reaction 0.005 Slows down 25.9 22.6 19.6 29.0 26.7 28.4 Waiting 49.8 60.0 66.3 44.3 47.4 38.6 Constant speed 18.0 12.2 6.5 19.1 20.5 23.9 Accelerates 6.4 5.2 7.6 7.6 5.5 9.1
Passing the stop line 0.000
Yes 62.4 44.4 46.7 67.7 67.5 70.5 No 19.6 39.1 43.5 16.2 12.1 10.2 Not Available 18.0 16.5 9.8 16.2 20.4 19.3 Pedestrian priority compliance 0.000 Compliance (all) 45.1 60.9 60.9 41.2 39.8 38.6 Non-compliance from pedestrian 14.7 4.4 7.6 16.8 16.8 22.7 Non-compliance
Non-compliance both 9.6 3.5 4.4 13.0 11.6 8.0 Distance to
pedestrian 0.024
0-1 meter 20.2 17.4 16.3 20.0 21.3 22.7
1-2 meters 46.9 38.3 39.1 50.8 50.2 44.3
More than 2 meters 33.0 44.4 44.6 29.2 28.5 33.0
Vehicle movement 0.000
Straight course 39.5 64.35 57.61 31.3 32.22 35.23 Was turning right 36.5 17.39 17.39 45.8 42 40.91 Was turning left 24 18.26 25 22.9 25.78 23.86
6. DISCUSSION
This study found that in more than 4,000 observed street crossings in a variety of different environments, interactions with other road users occurred in nearly 18% of cases. While one-fifth of random crossing observations is a considerable amount, few of these interactions actually led to conflicts and very dangerous situations. There are a number of issues for which data from the existing literature is inconclusive and others for which our results contribute since there has been little to no research so far. We present our contribution while focusing on three specific aspects: the relative protection around schools for children; the worrisome situation of interactions involving senior pedestrians; and the importance of the roadway characteristics in the occurrence of pedestrian
interactions with vehicles.
Children seem to be in a particular situation in our sample when it comes to interactions while crossing. They experienced fewer interactions and when they do so, these
interactions are less severe (more compliance with priority rules by other users and longer distance separating them from vehicles). We put forward three hypotheses to
explain those results. First, a majority of our observations were taken within school zones (mean distance of 105 meters between observed crossing and nearest elementary school) and during school period (83% of them outside summer time), which means that the road infrastructure, if it follows prescriptions, should be safer. Road signage for school zone, speed limit of 30 km/h and other road safety devices (drop-off area, traffic calming, etc.) are common, if not mandatory, in the immediate school vicinity. Those safety devices were associated to less collisions in several studies [54, 55]. Our results might be influence by the “cumulative” effect of street features in proximity to schools, an effect that we were not able to measure and directly take into account here but that would be interesting to explore further in the future. Second, adult school crossing guards were present in about half of children’s observations. In past studies, their presence was either associated to higher or to non-significant effect on collision rates [34, 56, 57], which is often identified as the consequence of the crossing guard’s location, often at accident-prone intersections. We did not include this variable in the model since it was not collected at all the observation sites (adults and seniors). The hypothesis that school crossing guards could reduce interactions while crossing should be examine further: preliminary results on a similar database found that interactions were less frequent at crossing with adult school crossing guards [58]. Third, the “safety in number” hypothesis [59] may be at play here too: observations were mostly undertaken in the morning, when surroundings of the school are very busy with children and parents walking or driving around in a short period of time (approximately 15-20 minutes before school starts). Even if driving parents are known to not always behave appropriately [60], our field experience show us that even small groups of children crossing are more visible and harder to ignore
for drivers. As well, children might behave more safely while surrounded by other adults and traffic.
As for older adult pedestrians, their situation is more worrying since they are more at risk of interactions, especially for those with low walking speed. These results are in line with recent research, which also insists on the high compliance of elders: they wait more frequently for the next green light, hesitate in greater proportion before crossing, do not accelerate at mid-crossing and cross in straight line more often than younger pedestrians do [29, 61]. However, all these “safe” behaviors might contribute to greater odds of finishing a street crossing on a red light, which might explain their higher proportion of non-compliance to regulation found here. Finally, their slower speed might also explain drivers’ reactions when interacting: although the proportion of drivers stopping at the stop line is higher, the distance between elderly pedestrian and the vehicle is either very short or very large. Would it be that drivers lack patience when facing an older pedestrian taking more time to cross? This new line of research is promising in terms of education campaigns towards drivers.
Finally, our results demonstrate once again the importance of road characteristics and intersections design when it comes to pedestrian road safety. The strong association between arterial road and more vehicle-pedestrian interactions found in our model points out once again the inherent danger of these roads for pedestrians. Our results add new knowledge about their positive influence on the occurrence of interactions, a result in line with previous research that demonstrate their positive association with pedestrian crash
probabilities, either for the general population [33] or the school-age children [62]. Arterial roads are often wider, have more lanes and faster and heavier traffic, which makes them unsuitable for pedestrians to cross. Interventions targeting at least safer intersection crossing are required since arterial roads are ubiquitous in modern cities, especially in poorer central neighborhood [63].
Visibility at the crossing seems to be another important feature in our results since one variable affecting visibility was positively related to interaction occurrence and three were negatively related to them. First, the presence of parked cars is related to more interactions, which is in line with research on child collisions [34, 64] and other research on pedestrians cautious behaviors when approaching a crossing with parked car [44]. However, interpreting why the “parked cars on both sides” variable was not significantly associated with interactions (only in the mixed-effect model) is unclear. We suggest that more cars blocking pedestrians’ line of sight may lead to more vigilant behaviors from both pedestrians and drivers. Further investigation of this finding may be warranted in future research. Inversely, three variables were associated with fewer interactions: one-way streets, different crossing surface material, and presence of a bike path at the
crossing. As for one-way streets, one would argue that having cars coming from only one way reduces the chances of interactions, which is in line with our result. However, they were found to either reduce or increase collision risk for specific population (children [34, 37] and on university college campus [38]), so our results calls for additional
exploration of the influence of this major urban feature on road user behaviors. Our result on different surface material is also in line with previous work on conflicts and
(yellow and white zebra, and double line) were not significantly related to interactions. Nevertheless, the poor quality of the marked crosswalk in a great number of observation sites (marking not visible) might also explain these results, which is why we only kept the different surface material variable here. Finally, the exploration of the relation between bike path and interactions is not usual in road safety: this type of variable is usually related to cycle crash studies, for example. The fact that our result demonstrate a negative relation between their presence and interaction is even more intriguing: our previous work on senior pedestrians link the presence of a bike path to greater odds of finishing the crossing on a red light, which would lead to expect more interactions. This is not the case here, maybe because of the inclusion of all age group.
All these results and new research avenues strengthen the importance of conducting naturalistic observational study like ours to understand the upstream mechanism involved in collisions. Given the similarities in the factors associated with vehicle-pedestrian interactions and those known to influence collisions occurrence and rate, interactions may be a reasonable proxy for potential collisions. Future studies should verify this hypothesis by comparing the occurrence of collisions and interaction rates at specific intersections for pedestrians. Such a study was undertaken for car-car crashes and near-crashes and results illustrate the strong relationship between contributing factors for crashes and for near-crashes [19].
6.1 Limitations
Such field observations are known to be more valid than other automatic traffic-conflict techniques, but they are also vulnerable to intra and inter-observer variability [8]. Even with multiple hours of training in groups (both on and off site), the nature of the data collected creates the possibility for interpretation and misreporting, especially when taking into account the complex movement dynamics of pedestrians [13]. Using a pre-tested observation grid and placing observers in pairs ensured a greater level of accuracy in observations, even if we did not test, in this project, the inter-observer agreement since it was done on the same grid in a prior project [43]. Another example lies in the
possibility that observers may have misreported more subjective variables such as walking speed and age, even though few categories were used. Observers were clearly indicated to determine speed as compared with an average adult, and age through facial traits, posture and general common sense, but we recognize that signs of aging differ depending on lifestyle and genes and that observations of personal characteristics may be subjective. Another limitation of our dataset lies in the timing of the observations: during Spring, Summer and Fall days. The data is therefore partially representative of all the possible time period a pedestrian can cross streets, such as at night or during the Winter. These schedules were chosen in order to be present when there are important numbers of pedestrians on the street during relatively short periods of time. Also, nighttime is a source of insecurity both for children and seniors, leading them to go out less frequently than during daylight hours. We acknowledge that our results only reflect those times of the day/year and cannot be generalized to all pedestrians, all year long. All these may be explanations for the modest size of the Pseudo R-Square provided in the logistic
usually lead to low R-square and pseudo R-square [20]. Possible improvements to the model could include direct measurements of traffic and speed of vehicles and actual distance between vehicles and pedestrians, or weather variations. These were unfortunately not included in data collection.
7. CONCLUSION
The main objective of this paper was first to explore the relationship between individuals and crossing characteristics and interaction occurrence between pedestrians and other road users (mostly vehicles) and second, to see if these particular interactions led to different reactions and behaviors for pedestrians of different age groups. Our unique data set of observations of street crossings in different urban road environments in Quebec, Canada is one of the strengths of this study. Our results provide a better understanding of the interaction between pedestrians and vehicles in different crossing environments and for different age groups: Senior and child pedestrians were found to have very different interaction pattern compared to adults. Past research have studied the influence of most of our variables on crash risk, but not on the occurrence of interactions or conflicts involving pedestrians [14]. This is where our results are the most valuable: adding to the knowledge of pedestrian-vehicle interactions. We also found that design of crosswalks and the addition of safety and visibility features can reduce the probability of interactions between crossing pedestrians and vehicles. Educating drivers and pedestrians to respect each other’s space requires an understanding of where, between whom, and under what circumstances interactions occur. Such an approach can also help identify which
engineering, urban design and enforcement programs are needed to ensure safe pedestrian crossings for all ages.
8. ACKNOWLEDGEMENTS
This project was supported by two grants from the Actions concertées Research Program, jointly funded by Transport Québec, the Société de l’assurance automobile du Québec (SAAQ), and by the Fonds de recherche du Québec (FRQ-Société et culture, Nature et technologie and Santé). The views expressed here are those of the authors and do not necessarily represent those of the sponsoring agencies. We would like to thank Marie-Axelle Granié and Annick St-Denis for taking part in the development of the observation tools and we are grateful to all the students involved in the data collection. We would also like to thank Gaëtan Dussault for his help with processing the data. This paper was first presented at the Transportation Research Board (TRB) 96th Annual Meeting.
9. REFERENCES 1. Dumbaugh, E. and R. Rae, Safe Urban Form: Revisiting the Relationship Between Community Design and Traffic Safety. Journal of the American Planning Association, 2009. 75(3): p. 309 ‐ 329. 2. ITF, Pedestrian Safety, Urban Space and Health. 2012: OECD Publishing. 3. Kaparias, I., et al., Behavioural analysis of interactions between pedestrians and vehicles in street designs with elements of shared space. Transportation Research Part F: Traffic Psychology and Behaviour, 2015. 30: p. 115‐127. 4. Miranda‐Moreno, L.E., A. Labbe, and L.P. Fu, Bayesian multiple testing procedures for hotspot identification. Accident Analysis and Prevention, 2007. 39(6): p. 1192‐1201. 5. Theofilatos, A., et al., Predicting Road Accidents: A Rare‐events Modeling Approach. Transportation Research Procedia, 2016. 14: p. 3399‐3405.
6. Langbroek, J., et al. Analyzing interactions between pedestrians and motor vehicles at two‐phase signalized intersections‐an explorative study combining traffic behaviour and traffic conflict observations in a cross‐national context. in Road safety in a globalised and more sustainable world ‐ current issues and future challenges. 2012. Hasselt, Belgique. 7. Laureshyn, A., A. Svensson, and C. Hydén, Evaluation of traffic safety, based on micro‐level behavioural data: Theoretical framework and first implementation. Accident Analysis & Prevention, 2010. 42(6): p. 1637‐1646. 8. Zheng, L., K. Ismail, and X. Meng, Traffic conflict techniques for road safety analysis: open questions and some insights. Canadian Journal of Civil Engineering, 2014. 41(7): p. 633‐641. 9. Hyden, C., Traffic conflict techniques: some data to supplement accident analysis, in Transport planning & traffic safety: making cities, roads & vehicles safer, G. Tiwari and D. Mohan, Editors. 2016, CRC Press: Boca Raton, U.S.A. p. 89‐108. 10. Tarko, A., et al., White Paper: Surrogate measure of safety. 2009, ANB20(3) Subcommittee on Surrogate Measure of Safety and ANB20 Committee on Safety Data Evaluation and Analysis of the Transportation Research Board. 11. Muhlrad, N., Technique des Conflits de Trafic: manuel de l'utilisateur. 1988, Institut national de recherche sur les transports et leur sécurité (INRETS). 12. Davies, J., et al., Safety Management: A Qualitative Systemes Approach. 2003: Taylor & Francis. 13. Ismail, K., et al., Automated analysis of pedestrian‐vehicle conflicts using video data. Transportation Research Record, 2009: p. 44‐54. 14. Laurenshyn, A., et al., Review of current study methods for VRU safety: Appendix 6‐surrogate measures of safety in site‐based road traffic observations. 2016, InDeV: In‐Depth understanding of accident causation for vulneralbe orad users: Horizon 2020. 15. Child Friendly Cities. Unicef : Child Friendly Cities. 2014; Available from: http://childfriendlycities.org/. 16. World Health Organization. Global age‐friendly cities : a guide. 2016; Available from: http://www.who.int/ageing/age_friendly_cities_guide/en/. 17. World Health Organization. Global status report on road safety 2015. 2015; Available from: http://www.who.int/violence_injury_prevention/road_safety_status/2015/e n/. 18. Gharieh, K., et al., Probabilistic pedestrian safety modeling in intersections using surrogate safety measure, in Intelligent Transportation System 21st World Congress. 2014: Detroi, U.S.A. 19. Guo, F., et al., Evaluating the relationship between near‐crashes and crashes: can near‐crashes serve as a surrogate safety metric for crashes?, in NHTSA. 2010. 20. Dommes, A. and V. Cavallo, The role of perceptual, cognitive, and motor abilities in street‐crossing decisions of young and older pedestrians. Ophthalmic Physiol Opt, 2011. 31(3): p. 292‐301. 21. Fontaine, H. and Y. Gourlet, Fatal pedestrian accidents in France: A typological
analysis. Accident Analysis and Prevention, 1997. 29(3): p. 303‐312. 22. Abou‐Raya, S. and L.A. ElMeguid, Road traffic accidents and the elderly. Geriatr Gerontol Int, 2009. 9(3): p. 290‐7. 23. Loo, B.P. and K.L. Tsui, Pedestrian injuries in an ageing society: insights from hospital trauma registry. The Journal of trauma, 2009. 66(4): p. 1196. 24. LaScala, E., D. Gerber, and P. Grunewald, Demographic and environmental correlates of pedestrian injury collisions: a spatial analysis. Accident Analysis & Prevention, 2000. 32(5): p. 651‐658. 25. Burigusa, G., Sécurité des élèves du primaire lors des déplacements à pied et à vélo entre la maison et l'école au Québec avis scientifique. 2011, Direction du développement des individus et des communautés, Institut national de santé publique du Québec: Montréal. 26. Zeedyk, M.S., et al., Children and road safety: Increasing knowledge does not improve behaviour. British Journal of Educational Psychology, 2001. 71(4): p. 573‐594. 27. Lee, C. and M. Abdel‐Aty, Comprehensive analysis of vehicle–pedestrian crashes at intersections in Florida. Accident Analysis & Prevention, 2005. 37(4): p. 775‐786. 28. Dunbar, G., The relative risk of nearside accidents is high for the youngest and oldest pedestrians. Accident; analysis and prevention, 2012. 45: p. 517‐521. 29. Lachapelle, U. and M.‐S. Cloutier, On the complexity of finishing a crossing on time: Elderly pedestrians, timing and cycling infrastructure. Transportation Research Part A: Policy and Practice, 2017. 96: p. 54‐63. 30. Julien, A. and J.‐R. Carré, Cheminements piétonniers et exposition au risque: Risk exposure during pedestrian journeys. Recherche ‐ Transports ‐ Sécurité, 2002. 76(Octobre‐Décembre): p. 173‐189. 31. Dumbaugh, E. and W. Li, Designing for the safety of pedestrians, cyclists, and motorists in urban environments. Journal of the American Planning Association, 2011. 77(1): p. 69‐88. 32. Miranda‐Moreno, L.F., P. Morency, and A.M. El‐Geneidy, The link between built environment, pedestrian activity and pedestrian‐vehicle collision occurrence at signalized intersections. Accident Analysis and Prevention, 2011. 43(5): p. 1624‐1634. 33. Morency, P., et al., Major urban road characteristics and injured pedestrians: A representative survey of intersections in Montréal, Quebec. 2015, 2015. 106(6): p. 7. 34. Rothman, L., et al., Motor Vehicle‐Pedestrian Collisions and Walking to School: The Role of the Built Environment. Pediatrics, 2014. 133(5): p. 776‐784. 35. Rifaat, S., R. Tay, and A. De Barros, Effect of street pattern on the severity of crashes involving vulnerable road users. Accident Analysis and Prevention, 2011. 43(1): p. 276‐283. 36. Svensson, A. and C. Hydén, Estimating the severity of safety related behaviour. Accident Analysis & Prevention, 2006. 38(2): p. 379‐385. 37. Wazana, A., et al., Are child pedestrians at increased risk of injury on one‐way compared to two‐way streets? Canadian Journal of Public Health/Revue Canadienne de Santé Publique, 2000. 91(3): p. 201‐206.
38. Dai, D., et al., The Impact of Built Environment on Pedestrian Crashes and the Identification of Crash Clusters on an Urban University Campus. Western Journal of Emergency Medicine, 2010. 11(3): p. 294‐301. 39. Leden, L., et al., Safety and accessibility effects of code modifications and traffic calming of an arterial road. Accident Analysis and Prevention, 2006. 38(3): p. 455‐461. 40. Koepsell, T., et al., Crosswalk markings and the risk of pedestrian–motor vehicle collisions in older pedestrians. JAMA, 2002. 288(17): p. 2136‐2143. 41. Zegeer, C.V., et al., Safety effects of marked versus unmarked crosswalks at uncontrolled locations ‐ Final report and recommended guidelines. 2005, U.S. Department of Transportation. 42. Huybers, S., R. Van Houten, and J.E.L. Malenfant, Reducing conflicts between motor vehicles and pedestrians: the separate and combined effects of pavement markings and a sign prompt. Journal of Applied Behavior Analysis, 2004. 37(4): p. 445‐456. 43. Tom, A. and M.‐A. Granié, Gender differences in pedestrian rule compliance and visual search at signalized and unsignalized crossroads. Accident Analysis & Prevention, 2011. 43(5): p. 1794‐1801. 44. Yannis, G., E. Papadimitriou, and A. Theofilatos, Pedestrian gap acceptance for mid‐block street crossing. Transportation Planning and Technology, 2013. 36(5): p. 450‐462. 45. DiMaggio, C. and G. Li, Roadway characteristics and pediatric pedestrian injury. Epidemiologic Reviews, 2012. 34(1): p. 46‐56. 46. Bellefleur, O. and F. Gagnon, Urban traffic calming and health. 2012, National collaborating centre for healthy public policy. 47. Gitelman, V., et al., Characterization of pedestrian accidents and an examination of infrastructure measures to improve pedestrian safety in Israel. Accident Analysis & Prevention, 2012. 44(1): p. 63‐73. 48. Mead, J., C.V. Zegeer, and M. Bushell, Evaluation of pedestrian‐related roadway measures: a summary of available research. 2014, Federal Highway Administration. 49. Siram, S.M., et al., Does the pattern of injury in elderly pedestrian trauma mirror that of the younger pedestrian? J Surg Res, 2011. 167(1): p. 14‐8. 50. Lord, S., C. Després, and T. Ramadier, When mobility makes sense: A qualitative and longitudinal study of the daily mobility of the elderly. J Env Psycho, 2011. 31(1): p. 52‐61. 51. Thouez, J.‐P., et al., Le contact visuel à la traversée d’une intersection par les piétons à Montréal et à Toronto. Assurances et gestion des risques, 2007. 73(4): p. 525‐544. 52. Ye, F. and D. Lord, Comparing three commonly used crash severity models on sample size requirements: Multinomial logit, ordered probit and mixed logit models. Analytic Methods in Accident Research, 2014. 1: p. 72‐85. 53. Bernhoft, I.M. and G. Carstensen, Preferences and behaviour of pedestrians and cyclists by age and gender. Transportation Research. Part F: Traffic Psychology and Behaviour, 2008. 11(2): p. 83‐95. 54. Clifton, K.J. and K. Kreamer‐Fults, An examination of the environmental
attributes associated with pedestrian–vehicular crashes near public schools. Accident Analysis & Prevention, 2007. 39(4): p. 708‐715. 55. Graham, A. and P. Sparkes, Causalty reductions in NSW associated with the 40 km/h school zone initiative, in Australasian road Safety, Research, Policing and Education Conference. 2010. 56. Rothman, L., et al., Do school crossing guards make crossing roads safer? A quasi‐experimental study of pedestrian‐motor vehicle collisions in Toronto, Canada. BMC Public Health, 2015. 15(1): p. 1‐7. 57. Cloutier, M.‐S. and P. Apparicio, L’environnement autour des écoles a‐t‐il un impact sur le risque routier impliquant des enfants piétons à Montréal? Apport de la régression de Poisson géographiquement pondérée. Territoire en Mouvement, 2010. 2008‐01. 58. D'Amours Ouellet, A.‐A., L'environnement routier près des écoles primaires et les interactions de trafic impliquant des enfants piétons. 2016, Master Thesis, Institut national de la recherche scientifique. p. 112 p. 59. Jacobsen, P.L., D.R. Ragland, and C. Komanoff, Safety in Numbers for walkers and bicyclists: exploring the mechanisms. Injury Prevention, 2015. 60. Rothman, L., et al., Dangerous student car drop‐off behaviors and child pedestrian‐motor vehicle collisions: An observational study. Traffic Injury Prevention, 2016. 17(5): p. 454‐459. 61. Tournier, I., A. Dommes, and V. Cavallo, Review of safety and mobility issues among older pedestrians. Accident Analysis & Prevention, 2016. 91: p. 24‐35. 62. Abdel‐Aty, M., S.S. Chundi, and C. Lee, Geo‐spatial and log‐linear analysis of pedestrian and bicyclist crashes involving school‐aged children. Journal of Safety Research, 2007. 38(5): p. 571‐579. 63. Morency, P., et al., Neighborhood Social Inequalities in Road Traffic Injuries: The Influence of Traffic Volume and Road Design. American Journal of Public Health, 2012. 102(6): p. 1112‐1119. 64. Stevenson, M., D. Sleet, and R. Ferguson, Preventing Child Pedestrian Injury: A Guide for Practitioners. American Journal of Lifestyle Medicine, 2015. 9(6): p. 442‐450.