MASTER IN MANAGEMENT - GRANDE ECOLE
RESEARCH PAPER
Academic Year 2017 - 2018
Natural Gas Market in China
Current State and Prospects of Development for Trading
Activities
Liuning CHEN
Under the supervision of Prof. Jean-Pierre FRANCOIS
Jury:
< >
< >
Abstract
This research paper comprehensively analyzes the natural gas market in China (“this market”), focusing on this market’s current state and prospects for trading activities. For better understanding, the paper also summarizes the historical evolution and reforms of this market and then refers to the US and the UK practices. Main findings include: at present, (1) this market is growing fast driven by policies; (2) the Chinese government plays a pivotal role in this market but is attempting a hands-off approach; (3) physical trading is limited due to state monopolies and the regulated pricing; (4) financial trading is foreseeable but depends on the progress of the ongoing market and pricing reform. Since market liberalization is inevitable, major suggestions for developing this market include: (1) to participate more in the international gas market; (2) to introduce more competition in the upstream market; (3) to accelerate the construction of gas infrastructures and unbundle transportation from sales; (4) to push more trading activities into gas hubs. As marketization deepens, either physical or virtual gas hubs are feasible in China.
Acknowledgements
I would like to extend my deepest and wholehearted gratitude to my thesis supervisor Professor Jean-Pierre Francois, who gave me directions, suggestions, and knowledge in the first place with kind and patience. This research paper would not have reached its level without Professor Francois’s help and guidance.
My profound appreciation also goes to the faculty members at HEC Paris, who have taught me invaluable business knowledge and skills. These knowledge and skills crossed my mind heaps of times when I did the research and wrote the paper. I hope I have practiced them well.
Table of contents
Abstract ...2
Acknowledgements ...3
Table of contents ...4
List of tables and figures ...5
Part I. Introduction ...7
1. Research orientation ...7
2. Literature review ...12
Part II. Current state of the natural gas market in China ...15
3. Development policies ...15
4. Demand, supply, and infrastructure ...21
5. Market structure...33
6. Pricing system ...38
Part III. Development analysis of the natural gas market in China ...46
7. Main features of the development ...46
Part IV. Prospects for natural gas trading activities in China ...51
8. International experience of market reform ...51
9. Trading hubs ...62
Part V. Conclusion...76
10. Conclusions and suggestions ...76
Appendices ...80
Acronyms, abbreviations, and units of measure ...86
List of tables and figures
Tables
Table 1. Air pollutants produced by different kinds of primary energy ... 7
Table 2. Energy efficiency comparison between coal and natural gas ... 7
Table 3. Competitive analysis of the four countries in Asia Pacific in terms of establishing a natural gas hub ... 14
Table 4. Political targets of the natural gas industry in China towards Year 2020 ... 16
Table 5. Tasks and obstacles of the Chinese natural gas system reform ... 18
Table 6. Proven rates and recovery rates of gas reserves in China by the end of 2016 ... 28
Table 7. Cross-border gas pipelines in China ... 31
Table 8. Top 5 domestic pipelines in China at the end of 2015 ... 32
Table 9. Pipeline gas and LNG market structures and players in China ... 34
Table 10. Companies with the state-approved qualifications to explore or exploit natural gas in China ... 35
Table 11. Evolution of natural gas pricing in China ... 42
Table 12. Evolution of gas transmission pricing in China ... 43
Table 13. Pricing mechanisms by different gas sources ... 45
Table 14. Reforms of the US natural gas market ... 52
Table 15. British Gas’s market share in 1990 - 1996 ... 56
Table 16. Reforms of the UK natural gas market ... 57
Table 17. Chinese policies about TPA ... 61
Table 18. Trading rules in SHPGX and CQPGX ... 68
Table 19. SWOT analysis of the natural gas market in China ... 76
Table 20. Recommended strategies for China’s natural gas market based on SWOT analysis ... 78
Appendix 4: Table 21. IGU types of price formation mechanisms ... 83
Appendix 5: Table 22. Key unbundling models ... 84
Figures
Figure 1. Changes in the world primary energy demand by fuel from Year 2016 to 2040 ... 8Figure 2. Structure of this research paper ... 11
Figure 3. Chinese natural prices vs. Brent oil price ... 12
Figure 4. Natural gas consumption in the BTH region and China ... 20
Figure 5. China’s natural gas consumption and GDP growth ... 22
Figure 6. Urban population by regions (% of total) ... 22
Figure 8. Proportions of China’s gas consumption in different segments from 2003 to 2014 ... 25
Figure 9. Electric power generation by energy sources in the US vs. China in 2016 ... 26
Figure 10. Gas consumption in chemical production and Nitrogen fertilizer application ... 26
Figure 11. China’s natural gas production, consumption, and external dependence ... 27
Figure 12. Supply volumes and proportions of different gas sources in China ... 27
Figure 13. Trend of China’s natural gas supply by sources ... 28
Figure 14. China’s top 10 natural gas suppliers by volume in 2017 ... 29
Figure 15. Strategic channels of importing gas to China and Import volumes of pipeline gas vs. LNG ... 29
Figure 16. China’s top 5 LNG exporters and top 3 importers by volume in 2015 ... 30
Figure 17. Comparison of China’s LNG import prices with other indicators and Operation rates of LNG terminals in China 30 Figure 18. Natural gas value chain ... 34
Figure 19. Diagram of natural gas price formulation ... 39
Figure 20. The benchmark city gate price set by NDRC for every province since June 10, 2018 and the sketch map of the West-East Gas Pipelines ... 43
Figure 21. Current financial policies supporting the utilization of natural gas in China ... 46
Figure 22. China’s national LNG ex-plant price index (in SHPGX) and the Platts JKM from Nov 2016 to Jan 2018 ... 49
Figure 23. Structural model of the US natural gas spot market ... 53
Figure 24. Top 25 North American gas trading locations by transaction volumes ... 54
Figure 25. Henry Hub daily gas spot price index ... 54
Figure 26. History of demerger of British Gas plc... 56
Figure 27. Natural gas trading mechanisms in the UK ... 58
Figure 28. The UK NBP natural gas spot price ... 59
Figure 29. Diagrams of a physical and a virtual hub ... 63
Figure 30. The US natural gas pipeline network in 2009 and Schematic diagram of Henry Hub ... 64
Figure 31. Network route map of National Transmission System ... 66
Figure 32. Historical trend of the national LNG ex-plant price index ... 70
Figure 33. Provincial LNG ex-plant price indices on June 6, 2018 ... 71
Figure 34. Historical trend of the Southeastern LNG transaction price index ... 71
Figure 35. Pipeline networks in Zhejiang Province ... 75
Appendix 1: Figure 36. Gas consumption by region during 2005 - 2012 ... 80
Appendix 2: Figure 37. Gas consumption in urban and industrial fuel, numbers of natural gas cars and filling stations, and gas consumption in power generation and installed gas-powered generators ... 81
Appendix 3: Figure 38. Distribution of major gas-bearing basins and gas fields in China ... 82
Part I. Introduction
1. Research orientation
1.1 Background
Natural gas is the kind of primary energy that is clean (Table 1), low-carbon (Table 1), efficient (Table 2), and of high quality. Serving as a bridge (i.e., transitional energy) between fossil fuels and renewable energy, natural gas is a realistic choice for energy conservation and emission reduction, and it is very helpful to cope with urgent ecological problems such as global warming and air pollution.
Table 1. Air pollutants produced by different kinds of primary energy
(Pounds per billion British thermal unit (Btu) of energy)
Source: EIA. (1999). Natural Gas 1998: Issues and trends. Retrieved from
http://webapp1.dlib.indiana.edu/virtual_disk_library/index.cgi/4265704/FID1578/pdf/gas/056098.pdf
Table 2. Energy efficiency comparison between coal and natural gas
Efficiency Power generation Industrial boiler – steam generation
Thermal generation for civil use
Consumption for chemicals (kg/tonne of Nitrogen) Coal Conventional: 35%
IGCC:45% 65% - 80% 15% - 30% 1570 - 1800
Natural gas CCGT:60% 86% - 90% 55% - 65% 990 - 1210
Note: IGCC denotes the integrated gasification combined cycle, which is currently the best technology for coal power generation. CCGT denotes the combined cycle gas turbines.
Regarding China’s energy situation, according to BP, since 2009, the total energy consumption of China has been ranking first in the world, surpassing that of the United States. In Year 2016, China’s energy consumption accounted for 23.0% of the world, in contrast to the US energy consumption ranking second and accounting for 17.1% of the world. Now China is continuing to be the world largest energy consumer — by BP’s prediction, in 2040, China’s energy consumption will be 24% of the world, in contrast to the US energy consumption to be 13% of the world. However, due to the heaviest weight of coal in its energy mix, for every unit of GDP, China consumes more energy and emits more carbon dioxide than the world average, so it has born pressures from Paris Accord and suffered from poor air quality in major cities.
Realizing such serious problems, China is putting in efforts to cut down its carbon footprint and propel the switch from coal to natural gas. The Chinese government is appealing for the “battle for the blue sky” and the revolution of energy production and consumption. According to the government policy, natural gas shall replace coal to become one of main energy sources in China. Predicted by BP Energy Outlook 2018, China is going to substantially raise the weight of natural gas in its primary energy mix by 2040, thus driving the world energy mix towards a much cleaner one (Figure 1).
But the indicators in Figure 1 will not work out automatically. For China, there are still many obstacles to overcome, one of which is its immature natural gas market and system.
Figure 1. Changes in the world primary energy demand by fuel from Year 2016 to 2040
Source: BP (2018, February).
To sum up, because of (1) the superiorities that natural gas has over other primary energy sources and (2) the large impacts that China’s energy consumption amount and structure have on the world, it’s meaningful to conduct such a research on China’s natural gas market as to investigate its current state and to know more about its future trends
–
whether this market will help make China cleaner and greener. In the meanwhile, by using various analysis methodologies, the research hopes to raise some valuable suggestions for the development of this market.1.2 Objectives
Considering the impacts of China’s energy mix on the world and the strategic position of natural gas in China’s energy mix, the
research
is dedicated to addressing the following questions:(1) What are the Chinese government policies towards the natural gas market? Are they in line with the world trends and in the right direction? Can natural gas trading activities prosper in such policy environment? (2) What’s the current development stage that China’s natural gas market is at, in terms of demand, supply, and
infrastructure? Is natural gas effectively used? Is there any weakness in gas supply or threat to energy security? Is demand and supply balanced? Does infrastructure fit demand and supply?
(3) What’s the current natural gas market structure and pricing system in China? How can they be improved along the natural gas value chain, compared to the US and the UK natural gas markets? What are China’s advantages and disadvantages in the way of improvement?
(4) What are the current states and progresses of natural gas trading hubs in China? How does physical trading work and what are the prospects of financial trading? In comparison with the US and the UK natural gas hubs, how can Chinese gas hubs be properly developed to foster trading and to better serve the Chinese natural gas market reform?
The research aims to comprehensively analyze the current state of the natural gas market and to exhibit the prospects of natural gas trading hubs and trading activities in China. Moreover, by reviewing the historical footsteps of the Chinese natural gas pricing reform and learning the relevant experience of the US and the UK, the research intends to put forward strategic suggestions about the further development of China’s gas market and its trading activities.
1.3 Methodologies
To answer the questions and achieve the objectives mentioned above, the research basically applies four methodologies as follows:
With statistical methods, the research precisely demonstrates the real status quo and the future trends of China’s natural gas market. The data used for statistical analysis is collected from multiple sources, which include authoritative databases, academic papers, brokers analysis, media reports, government publications, etc.
(2) Case study
The research uses the most related case, the gas shortage in China as of winter 2017-18 (i.e., from early October 2017 to late February 2018), as evidence of the most crucial loopholes in China’s natural gas market for now. This case also indicates the directions for future progress of the market.
(3) Comparative analysis
After looking through various natural gas markets over the world, the research chooses the US and the UK natural gas markets as the benchmarks, which are the most mature gas markets in the world and believed to provide the most relevant and valuable experience for China to learn from. Hence, with the purpose of making meaningful conclusions and proposals for the development of China’s gas market, the research first reviews the reform steps of the US and the UK gas markets, then studies their benchmark gas hubs – the US Henry Hub and the UK National Balancing Point (NBP), and finally makes comparisons with China’s gas market and hubs to gain insights.
(4) SWOT analysis
To identify the current state and prospects of China’s natural gas market in a more organized way, the research uses the SWOT matrix to summarize this market’s internal attributes and its external environment. Then by combining SO, ST, WO, or WT in SWOT, strategies for developing this market are logically achieved.
1.4 Framework
As shown in Figure 2, the research paper is divided into 5 parts (in the largest boxes).
Part 1 is the introduction. First is the orientation of the research, explaining why this research, how the research is carried out, and the research’s framework. Then come the reviews of existing studies, pointing out the necessity of deregulating China’s gas market and thus setting the tone for the research.
Part 2 presents the current state of China’s natural gas market, which is analyzed from six aspects – government policies, demand, supply, infrastructure, the market structure, and the pricing system.
Part 3, as an intermediate conclusion, highlights the advantages and disadvantages in the development process of China’s gas market up till the present. This part also shows a real-life case, the gas shortage in China as of winter 2017-18, to further illustrate these development features.
Part 4 starts from looking into the evolution of the US and the UK natural gas markets and their trading activities, draws the successful experience of market reform, and makes comparisons with China’s natural gas market. Then this part generalizes the successful reasons of two typical natural gas hubs – the US Henry Hub (physical) and the UK NBP (virtual) – and examines how these reasons can be applied to the establishment of Chinese gas hubs. Next, the part goes into details about the existing natural gas trading hubs in China, reveals their current states and trading activities, and gives outlooks for these hubs through comparison with Henry Hub and the NBP.
In the end, Part 5 concludes the research and brings up strategic recommendations for the upcoming development of the natural gas market in China and its trading activities.
2. Literature review
2.1 Pricing mechanisms
Both Chinese and international scholars have consensus that China should adopt the gas-on-gas competition (GOG) pricing, allow third-party access (TPA) to gas pipeline networks, and liberalize the natural gas market eventually. It’s because among all the pricing mechanisms, GOG or marginal cost pricing maximizes social welfare to the most (Jiang, Q., 2013; Wang, S., 2015). Specially, deregulating the natural gas price can greatly increase the market penetration of natural gas-fired electricity (Tian, R., et al., 2017). And TPA means any operator of natural gas infrastructures shall provide any other party convenient access to the infrastructure. This allows consumers to buy gas directly from sellers, with no need for grants from the infrastructure owner. In this way, TPA endows consumers with stronger bargaining power, thus stimulating the efficiency of the natural gas value chain and increasing the profits of the whole industry (Zhang, Y., 2016).
In fact, since 2005, the Chinese government has carried out a series of reforms of its natural gas pricing methods and raised the gas price several times to make it closer to the market value (Figure 3). Hence, a lot of research papers have discussed about the effects of these reforms and whether the liberalization of the natural gas market is a right choice for China.
Figure 3. Chinese natural prices vs. Brent oil price
Source: Paltsev, S., & Zhang, D. (2015).
In terms of the Chinese macro economy, in the short term, an increase in the natural gas price will lead to an increase in the Consumer Price Index (CPI) and an increase in the Producer Price Index (PPI), but a decrease in the Gross Domestic Product (GDP) (Wang, S., 2015; Zhang, W., Yang, J., Zhang, Z., & Shackman, J. D., 2017; He, Y., &
Lin, B., 2017). But in the long term, an increase in the gas price won’t hurt the GDP too much, and deregulation of the natural gas ex-plant price will decrease the CPI and increase the real GDP (He, Y., & Lin, B., 2017).
In terms of the welfare of gas producers and consumers, the change from the “cost-plus” pricing to the “netback” pricing will increase the producers’ profits but decrease the consumer surplus and decrease the total social welfare (Zhu, Y., 2014; Wang, Sh., 2015; He, Y., & Lin, B., 2017). To put it another way, the netback pricing, which links the price of natural gas to the values of its alternatives – imported fuel oil and liquified petroleum gas (LPG), in fact benefits gas producers or large gas suppliers, rather than the consumers who were protected by the cost-plus pricing before the change. Therefore, natural gas supply is incentivized by the netback pricing to satisfy unexpected high demand (Wang, S., 2015; Paltsev, S., & Zhang, D., 2015).
In addition, consumers in China of indigenous gas are more sensitive to the gas price changes than those of imported gas (Jiang, Q., 2013). In this sense, it’s reasonable for the Chinese government to hold the prices of indigenous gas in control but deregulate the prices of LNG imports at the current stage, because consumers of indigenous gas will be more hurt than those of imported gas when the market fluctuates. Moreover, industrial users are more sensitive to the gas price changes than residential users (Wang, S., 2015). So, there’s still some space to raise the residential gas price, which now in China is just equal to the industrial gas price, whereas in OECD member countries, residential gas prices are generally higher than industrial ones.
Overall, despite some negative effects mentioned above of adjusting the natural gas price to the market, the netback pricing is indeed suitable for China’s current situation, because it straightens out the relationship between natural gas and alternative energy sources and makes the gas price more transparent and predictable. Also, in order to avoid any potential negative effect or opposition of a more flexible pricing system, interim arrangements before full liberalization, like the netback pricing, are imperative (Zhang, W., et al, 2017). Specifically, as the gas price increases from the controlled level to the market level, the netback pricing forces consumers to use natural gas more intensively with less waste (Wang, S., 2015).
2.2 Trading hubs
Although the Chinese government holds the control of China’s natural gas market, this market has its competitive advantages and enjoys late-mover opportunities of establishing a successful natural gas hub (Table 3). Firstly, China has diversified natural gas supply, while Singapore and Japan almost 100% rely on imported LNG. Secondly, China has some superior locations equipped with dense transportation facilities and attracting multiple market players, of which Shanghai is the most outstanding. Shanghai is not only the financial center of China, but also a converging point of major pipelines and LNG terminals. If China improves the software conditions such as the market structure, pricing system, and regulations, and adds more gas storage facilities and completes the gas transportation system in
Shanghai, Shanghai has the biggest potential to become a powerful benchmark hub in Asia Pacific (Tong, X., Zheng, J., & Fang, B., 2014).
As a matter of fact, since Shanghai Petroleum and Natural Gas Exchange (SHPGX) was put into formal operation in November 2016, Chinese policymakers has the intention to develop Shanghai into a natural gas pricing center of Asia Pacific. But there’re a lot to improve before realizing the goal. The improvements, according to Liu, M. (2017), include: first is to have a market-based natural gas pricing system. Reforming the current pricing system, the Chinese government raises an idea which is, “controlling the middle, liberalizing both ends” of the natural gas value chain. Second is to form a competitive natural gas market with numerous diversified market players. As state monopolies are dominating China’s gas market, this reform has to be pushed by the government efforts. Third is to form a natural gas futures market, which shall be done step by step: step 1) to standardize physical natural gas contracts traded in SHPGX; step 2) to widen the range of spot natural gas contracts, particularly to introduce mid-term and long-term spot contracts; step 3) to launch natural gas futures, swaps, and options in some appropriate time.
Table 3. Competitive analysis of the four countries in Asia Pacific in terms of establishing a natural gas hub
Part II. Current state of the natural gas
market in China
3. Development policies
A main feature of the natural gas market in China is policy-driven. In other words, the Chinese government plays the pivotal role in this market by enacting policies and holding shares in giant oil and gas companies. Therefore, it’s essential to understand the Chinese government’s development policies relating to the natural gas market, which display a general picture of the current market and indicate where the market is going next.
3.1 Thirteenth Five-Year Plan
In December 2016, National Development and Reform Commission (NDRC) of the People’s Republic of China (PRC) released “the 13th five-year plan (from 2016 to 2020) for energy development” and particularly “the 13th five-year plan for natural gas development” (hereinafter both two plans referred to as “the Plan”), which demonstrate the top-level design of China’s natural gas market by the end of 2020.
The Plan places emphasis on economic efficiency and green development, therefore low-carbon and clean energy like natural gas and renewable energy will be the main increments of energy consumption in China, and the replacement of coal with natural gas will be intensively pushed. Numerically, with the total energy consumption per annum controlled below 5 billion tonnes of standard coal equivalent (TCE) by the end of 2020, the Plan requires that natural gas should account for more than 10% (5.9% in 2015) of the primary energy consumption per annum, non-fossil fuel account for more than 15% (12% in 2015), and coal less than 58% (64% in 2015).
The Plan also stresses that increasing the proportion of natural gas in China’s primary energy consumption: (1) is an evitable path towards a clean, low-carbon, safe, and efficient modern energy system; (2) is a realistic choice to effectively control air pollution and to actively deal with ecological environment problems such as climate change; (3) is important content in the promotion of “clean heating” in the Northern area and the revolution of Chinese rural lifestyle; and (4) can push the development of related equipment manufacturing so as to foster a new economic growth point.
Since natural gas is crucial for China to change its energy mix and fulfill its climate pledge in Paris Accord by 2030, in June 2017, NDRC and other 12 relevant government departments jointly released “Opinions on the acceleration of natural gas use” (hereinafter referred to as “the Opinions on the Acceleration”), which additionally sets goals of increasing the consumption proportion of natural gas in primary energy per annum to 15% and increasing the effective working capacity of underground gas storage to over 35 billion cubic meters (bcm) by 2030, in pursuit of making natural gas one of the main energy sources in China’s modern energy system.
3.1.1 Development goals
The Plan declares 4 development goals of the natural gas industry in China during the 13th Five Years as follows: (1) proven reserves: the proven reserves of conventional gas shall increase by 3 trillion (tn) cubic meters (cu.m), shale gas by 1 tn cu.m, and coalbed gas by 0.42 tn cu.m; (2) guaranteed supply: overall natural gas supply in 2020 shall exceed 0.36 tn cu.m; (3) infrastructure: the length of major pipelines shall increase by 40 thousand (K) kilometers (Km), and the working capacity of underground storage must reach 14.8 bcm (compulsory); (4) market system: the natural gas market reform shall be accelerated, along with the improvement of the legal and regulatory system and the policy system. The details are listed in Table 4.
Table 4. Political targets of the natural gas industry in China towards Year 2020
Natural gas Year 2015 Year 2020 CAGR
Proportion in primary energy consumption 5.9% 8.3 - 10% -
Accumulated proven reserves (tn cu.m)
o.w. Conventional gas 13 16 4.3%
o.w. Shale gas 0.5 1.5 24.6%
o.w. Coalbed methane (CBM) 0.58 1 19.0%
Production (bn cu.m/ year) 135 207 8.9%
o.w. Shale gas 4.6 30 45.0%
o.w. Coalbed gas 4.4 10 18.0%
Pipelines
o.w. Length (K Km) 64 104 10.2%
o.w. One-time transportation capacity (bn cu.m) 280 400 7.4%
Working capacity of underground storage (bn cu.m) 5.5 14.8* 21.9%
Installed capacity of power generation (GW) 66.37 110 10.6%
No. of LNG filling stations (K) 6.5 12 25.0%
Population covered by gasification (M) 330 470 10.3%
Gasification rate of urban population 42.8% 57.0% -
3.1.2 Key tasks
In order to achieve the development goals above, the Plan lists 4 major tasks during the five years as follows. 1. To enhance exploration and exploitation of natural gas to improve domestic production.
In accordance with the policy of “simultaneously developing on shore and off shore, conventional and unconventional”, (1) investment in domestic exploration shall be continuously increased, and investigation and assessment shall be strengthened. (2) Production of conventional gas shall mainly come from the proven reserves in 4 production bases – Tarim Basin, Ordos Basin, Sichuan Basin, and the marine area (Appendix 3), where exploitation of natural gas shall be accelerated. (3) More efforts shall be put into the research and development (R&D) of low-graded or unconventional gas, especially shale gas and CBM, aiming to make major breakthroughs in technical bottlenecks and realize economic scales.
2. To foster natural gas consumption and promote efficient usage.
Gasification and gas usage shall be promoted in three fields: (1) fuels in regions with heavy air pollution – the Beijing-Tianjin-Hebei (BTH) region, the Yangtze River Delta (YRD), the Pearl River Delta (PRD), and the Northeast; (2) electricity generation (By 2020, natural gas-fired generation shall account for over 5% of the total installed capacity of power generation.); (3) vehicles including city buses, taxis, sanitation cars, and cargo trucks, and LNG fueled vessels in inland rivers, lakes, and coastal areas (By 2020, about 10 million vehicles will be gasified, with over 12,000 gas stations and over 200 marine gas stations built.). In the meanwhile, the efficient and economical usage of natural gas by advanced technologies and equipment is encouraged to avoid any waste. 3. To accelerate construction of pipeline networks.
Major importing channels and domestic arteries shall be further improved, including pipelines linking to LNG import terminals. Gas transportation capabilities in the BTH region and the urban agglomerations in the middle of Yangtze River need to be greatly enhanced. The Opinions on the Acceleration also asks to complete “the last one mile” of pipelines connecting to rural and remote areas. Moreover, interconnections between pipelines run by different transmission operators and TPA will be allowed.
4. Accelerate construction of storage facilities and enhance peak load regulation.
The working capacity of underground gas storage and the capacity of LNG storage tanks shall be increased. With regards to this issue, in April 2018, NDRC and National Energy Administration (NEA) of the PRC released “Opinions on accelerating construction of gas storage facilities and improving the market mechanism of gas storage and peak regulation services”, in which 3 targets by 2020 are clarified: (1) A gas supplier shall set up storage facilities which have a capacity of no less than 10% of its annual contractual sales, enough to meet seasonal (monthly) peak-shaving requirement or cope with emergent disruptions. (2) A prefecture-level city shall have a storage
capacity which could satisfy 3-day gas demand of the city every day. Cities in the North, especially those in The BTH region suffering severe air pollution, should further raise the storage standards. (3) A local distribution company shall set up storage facilities and have a capacity of no less than 5% of its annual use. In addition, large end users are encouraged to build self-owned storage facilities and other emergency measures. Also, when in shortage, gas for residential use shall be guaranteed first and unconditionally – whether written in contracts or not. Prices of storage facilities and services and gas used for peak shaving shall be market-determined, that is, dependent on demand and supply with no government intervention. What’s more, (1) storage facilities shall be financially independent; (2) independent companies specialized in storage services are encouraged to be set up; (3) gas for storage is encouraged to be listed for trading in Shanghai and Chongqing natural gas exchanges.
3.1.3 Supporting measures
The Plan states eight supporting measures to guarantee its key tasks to be perfectly executed, of which the most notable ones are further reforming the natural gas value chain, further restructuring state-owned oil & gas companies, and deepening the marketization of the natural gas industry. Following the Plan, in May 2017, the Central Committee of the Communist Party and the State Council of the PRC co-issued “Several opinions on deepening the reform of the oil and gas system”, which lists 8 tasks as detailed expansions of the supporting measures stated in the Plan. Table 5 summarizes main contents of the 8 tasks and identifies possible obstacles during the execution of
these tasks.
Table 5. Tasks and obstacles of the Chinese natural gas system reform
Task Main contents Obstacles
1. Open access to exploration and exploitation
1) Participation of diverse economic entities besides state-owned companies;
2) Mineral rights bidding system; 3) Stricter exit mechanism.
1) Specific requirements on exploration or exploitation qualifications;
2) Quality of blocks released by state-owned companies. 2. Improve gas import
and export management system
Enhancement of the capabilities of utilizing international and domestic resources and preventing market risk.
China’s natural gas pricing power is relatively weak, for it doesn’t have an enough mature gas trading hub yet, nor a convincing pricing system. 3. Unbundle pipeline
networks
1) Unbundling of pipeline transportation and gas sales step by step;
2) TPA to pipelines.
Possible contradictions between restructuring of state-owned companies and the unbundling process.
4. Deepen competition in the downstream
1) Expansion of gas consumption; 2) Fair competition in gas distribution.
Gas distribution companies may face more fierce competition or even be forced to change business models.
5. Advance pricing reform
1) More market-based prices of gas for non-residential use;
2) Accelerated development of natural gas trading platforms;
3) Strengthened regulation on the costs and prices of pipeline transportation.
Differentiation and positioning of multitude trading platforms.
6. Restructure state-owned oil & gas companies
1) Private or foreign capital investment;
2) Demerger of departments like engineering technology, construction, and equipment manufacturing.
1) Timeline of restructuring; 2) Complicated ownership
structures. 7. Improve gas storage
and peak load regulation
Gas suppliers, pipeline companies, gas distribution companies, and large end users shall all have
responsibilities of storing and peak shaving of natural gas.
Related companies may have pressures (because of lacking money) of building these facilities.
8. Improve safety and environmental
protection in the system
1) A complete system of safe production, especially risk management;
2) Safe and clean operation in the whole natural gas value chain.
Contradictions between economic profits and safety or environment protection.
Overall, this system reform, if strictly carried out, will change China’s natural gas market in two major parts. First, it will break down the state monopolies and introduce competition into the upstream and the downstream of the gas value chain. Second, gas wellhead prices and storage prices will be determined by the market, while transportation prices are controlled by the government – so called “controlling the middle, liberalizing both ends”.
The Opinions on Accelerating also suggests reducing the hierarchies in the midstream of the gas value chain and letting end users freely choose gas supply sources and transport paths, by which way gas flows along the value chain will be more efficient and cost-saving.
3.2 Coal-to-gas switching
In September 2013, the State Council of the PRC issued the “Air pollution prevention and control action plan” which states 10 measures to prevent and control the air pollution (hereinafter referred to as “the Ten Articles”) as the starting point of the coal-to-gas switching policy. The Ten Articles requires adjusting the energy mix more quickly where clean energy should be more heavily weighted, and the BTH region, the YRD, and the PRD – the three key megalopolises – are targeted with a priority.
In specific indicators, compared with 2012, by 2017, nationwide urban concentrations of PM10 should decreased by more than 10%; regional PM2.5 concentrations should respectively drop by about 25% in the BTH, 20% in the YRD, and 15% in the PRD, among which the annual average concentration of PM2.5 in Beijing should be specially controlled below 60 micrograms per cu.m.
Policies relating to the coal-to-gas switching in the Ten Articles are mainly: (1) to implement ceilings of coal consumption (The 3 key megalopolises should have negative growth of coal consumption by way of replacing coal with electricity, natural gas, and non-fossil fuels, and restricting coal-fired power plants.); (2) to push the utilization of clean energy (The incremental supply of natural gas should be used preferentially in the residential sector or as a substitute to coal; by 2017, the increase of the gas pipeline capacity should be more than 150 bcm and cover the 3 key megalopolises, and the switching from coal-fired to gas-fired facilities in industries of the 3 key megalopolises should be substantially finished.); (3) to reform natural gas pricing mechanisms, making gas prices in line with prices of alternative energy sources.
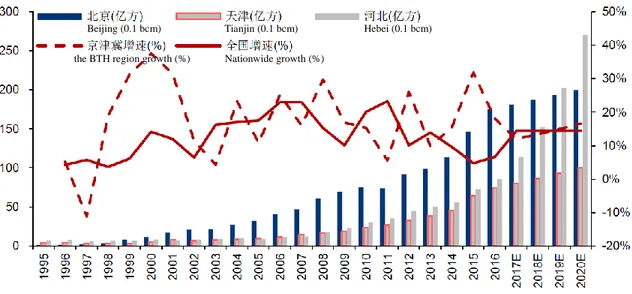
Following the Ten Articles, a series of government policies, either national or local, are issued to urge the replacement of coal with natural gas as soon as possible. The Plan vigorously promotes coal-to-gas projects in key cities in the BTH region, the YRD, the PRD, and the Northeast, such as phasing out of coal boilers, industrial kilns, and coal-fired facilities, and expanding the scope of zones prohibited from burning high-pollution fuels. The Opinions on the Acceleration appeals that by 2017, the “2+26” key cities of the BTH air pollution transmission channel should basically realize the conversion from coal-fired heating to clean heating, such as natural gas-fired heating, electric power, geothermal, and industrial waste heat. Pushed by the government’s stricter rules, the consumption growth rates in the BTH region since the Ten Articles was enacted are much higher than the growth of the national consumption (Figure 4). The result is optimistic: by the end of 2017, when the Ten Articles has finished its first 5 years, all numerical targets were achieved.
Figure 4. Natural gas consumption in the BTH region and China
Source: Huatai Securities (2017, November 6).
But the “battle for the blue sky” won’t come to the end with the deadline of the Ten Articles until the air pollution is completely controlled. In December 2017, NDRC, NEA and other 8 government agencies issued the “2017–2021
Beijing (0.1 bcm) Tianjin (0.1 bcm) Hebei (0.1 bcm) the BTH region growth (%) Nationwide growth (%)
winter clean heating plan for northern regions”, one of the new targets set by which is to make clean heating cover over 70% of the heated floor space in the North and 100% in the “2+26” key cities by the end of 2021.
4. Demand, supply, and infrastructure
4.1 Demand
4.1.1 Vertical comparison
China’s consumption of natural gas is highly related to the GDP growth, urbanization, and price relations between natural gas and alternative energy sources. With the rapid growth of China’s GDP (Figure 5) and continuing urbanization (Figure 6), the natural gas consumption (Figure 5) keeps rising since 1998. Specifically, before 1990, the consumption of natural gas was little and volatile. In 1991 - 1995, the Compound Average Growth Rate (CAGR) of natural gas consumption is 3.1%; in 1996 - 2000, the CAGR increased to 6.7%.
When entering the 21th century, the consumption was greatly boosted by the discovery of gas fields in Ordos basin and Tarim basin and the construction of West-East gas pipelines. The operation of West-East Gas Pipeline I from the beginning of 2005 opened a new era of the natural gas industry in China, with the CAGR of gas consumption going up to 13.7% in 2001 - 2005 and 18.3% in 2006 - 2010.
However, the gas consumption slowed down afterwards, because of two major factors. One factor is slower GDP growth, which decreases year by year, from 10.6% per annum in 2010 to 6.7% in 2016. The other factor is natural gas pricing reform, which majorly changed the former cost-plus pricing method to the current net-back method (linked to prices of Liquefied Petroleum Gas, i.e., LPG, and fuel oil), whose trial in Guangdong Province and Guangxi Province started in 2011, followed by a formal launch across the country in 2013. The reform increased gas prices, thus holding back gas demand. In addition, as crude oil prices dropped in 2015, gas further lost its competitive advantage to coal and refined petroleum products. As a result, the growth rate of natural gas consumption decreased from 23.3% in 2011 to 3.8% in 2015.
In order to promote the coal-to-gas switching policy, NDRC lowered the benchmark city gate price of gas for non-residential use by 0.7 yuan/cu.m in November 2015 and lowered the price again by 0.1 yuan/cu.m in August 2017. As the deadline of realizing the specific indicators set by the Ten Articles fell at the end of 2017 and the coal-to-gas switching is being executed more and more fiercely, the growth of coal-to-gas consumption bounced back to 6.7% in 2016 and even to 15.3% in 2017. The apparent consumption of natural gas in 2017 reaches 237.3 bcm.
Figure 5. China’s natural gas consumption and GDP growth
Data source: Department of Energy Statistics, National Bureau of Statistics, the PRC. (2017). China energy statistical yearbook
2017. Beijing: China Statistical Press.
Figure 6. Urban population by regions (% of total)
Note: “JP” indicates Japan. “KR” indicates South Korea. “European Union” includes the United Kingdom.
Source: The World Bank Group. (2018). Retrieved from https://data.worldbank.org/indicator/SP.URB.TOTL.IN.ZS
Following the recent trend, three favorable factors would boost the gas consumption in China: (1) an obvious competitive advantage of gas prices relative to coal and oil; (2) a market-oriented reform which diversifies gas sources, leading to renegotiates of current long-term contracts; and (3) environmental policies which forces the usage of gas instead of coal. Besides, if the goals set in the Plan are fundamentally realized by 2020, the CAGR of gas consumption in 2017 – 2020 by estimate should be around 18.7%, much more than the CAGRs of other energy sources such as non-fossil fuels (around 6%), coal (around 3.2%) and oil (0.7%).
-15.0 -10.0 -5.0 0.0 5.0 10.0 15.0 20.0 25.0 0 50 100 150 200 250 300 1980 1982 1984 1986 1988 1990 1992 1994 1996 1998 2000 2002 2004 2006 2008 2010 2012 2014 2016 Total natural gas consumption (m tce) Proportion of natural gas in total energy consumption (%) Annual growth of natural gas consumption (%) Annual growth of GDP (%)
On top of that, within a certain year, the seasonality of natural gas consumption is quite significant. The ratio of the average peak-valley difference in summer vs. the average difference in winter reaches 1.7: 1 as of 2016. Along with the promotion of clean heating projects in winter, the peak-valley difference in winter will be much wider, as well as the gap between winter and summer. The peak-valley and winter-summer spreads clearly require more gas storage facilities and stronger peak-shaving capabilities.
4.1.2 Horizontal comparison
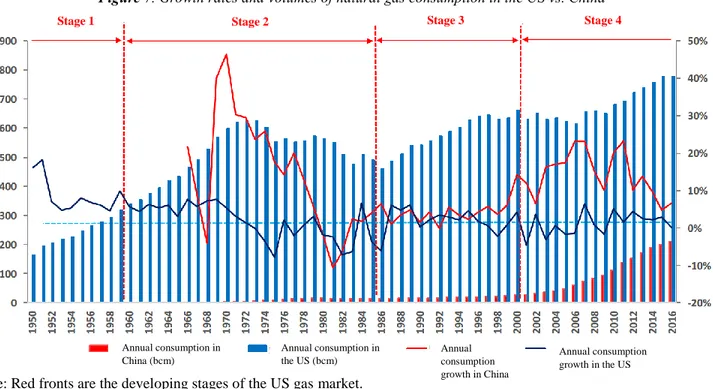
According to the industry life cycle theorem, the development of a natural gas market can be divided into four stages, where the natural gas consumption displays different growth patterns.
Figure 7. Growth rates and volumes of natural gas consumption in the US vs. China
Note: Red fronts are the developing stages of the US gas market. Source: Huatai Securities (2017, November 28).
Stage 1: Introduction. This is a stage when the natural gas market starts from scratch and all participants fight
fiercely to get a firm position in the value chain. The market is characterized by fierce competition, rapid expansion, and low supervision.
Stage 2: Non-Competition. Because gas infrastructures like pipelines need vast capital investment, owners or
operators of the infrastructures could naturally take over the market, resulting in a monopolistic or oligopolistic market structure. In order to break down the uneven market power, governments intervene and set standards to lead the market. The consumption growth becomes volatile and may even decline.
Stage 3: Liberalization. Due to excessive governance, the market development is abnormal. The supply is
especially weak. Therefore, the government gradually relaxes its control and lets prices be competitively formed by
Stage 1 Stage 2 Stage 3 Stage 4
Annual consumption in China (bcm) Annual consumption in the US (bcm) Annual consumption growth in China Annual consumption growth in the US
the demand and supply. Supply is stimulated again by increased economic surplus and participants all benefit from the revival of the market. The consumption rebounds.
Stage 4: Maturity. The market structure is relatively stable. The consumption stays at a high level and doesn’t
change too much.
As shown in Figure 7, China’s natural gas market is shifting to Stage 3, with consumption only equal to that of the United States in the 1950s. Since China’s natural gas consumption didn’t enter rapid growth until late 1990s, there’s still broad space for development. Regarding China’s large economic volume, undergoing structural reforms, and stricter environmental policies, the future will see appreciable gas consumption in China.
4.1.3 Regional comparison
Natural gas consumption in China is concentrated in four regions (Appendix 1) – the West (Xinjiang, Chongqing, Sichuan), the Bohai Economic Rim (Beijing, Tianjin, Heibei, Shandong, Liaoning), the YRD (Shanghai, Zhejiang, Jiangsu), and Southeast coastal areas (Fujian, Guangdong). These four regions are either in the cluster of gas fields (the West), or relatively more developed (the other three regions) thus in greater need of natural gas. Since West-East Gas Pipeline and Sichuan-Shanghai Gas Pipeline were completed around 2010, natural gas consumption in the latter three regions has been greatly boosted, which reaches 101.9 bcm in 2016, accounting for above 50% of the national total. In 2016, provinces consuming 10 bcm and above of natural gas are: Xinjiang, Sichuan, Beijing, Shandong, Jiangsu, Guangdong.
4.1.4 Market segments
In China, natural gas is used in 4 major segments: urban fuel, industrial fuel, power generation, and chemical production. The proportions of these fields in the national total consumption (from 2003 to 2014 shown in Figure 8) respectively are 32.5%/ 38.2%/ 14.7%/ 14.6% in Year 2015; 35.4% /34.6% /17.8%/ 12.2% in Year 2016, and
37.6% / 30.9%/ 19.9%/ 11.6% in Year 2017. As the total gas consumption is continuingly growing in recent years,
uses in urban fuel and power generation are expanding much faster than other fields. This has much to do with the government guidance, including the coal-to-gas switching policy more rigid in urban fuel, the guarantee for residential demand by suppressing commercial and industrial demand when in gas shortages, as well as much lower prices of gas for residential use than for non-residential.
Both the Plan and The Opinions on the Acceleration promote the utilization of gas in urban fuel, industrial fuel, power generation, and transport fuel. The historical growth in these four fields are shown in Appendix 2.
Figure 8. Proportions of China’s gas consumption in different segments from 2003 to 2014
Source: Minsheng Securities (2017).
Urban fuel. Not only the coal-to-gas switching process is accelerated, but the upgrade of public service systems
concerning natural gas supply and use is required, such as the coverage of pipelines in “the last one mile”, rightly in combination with the new-type urbanization. Natural gas heating projects are also encouraged in southern China, with the purpose of bettering public services.
Industrial fuel. The proportion of natural gas vs. coal in the industrial fuel mix of China currently is around 10%:
70%, making it urgent to convert industrial boilers and kilns into natural gas fired. However, facing high costs of conversion and high prices of natural gas, this field needs more government subsidies.
Power generation. In fact, the use of natural gas in this field is just starting out in China. More than half of the
electricity in China is generated from coal (Figure 9). In 2016, Gas-fired electricity only takes up 3.1% of the total production, compared to 33.8% in the US. By the end of 2017, the installed capacity of power generation using natural gas is 76.29 GW, only accounting for 4.3% of the total installed electricity capacity, far from the world average, 20%. NDRC has seen the gap, so the Plan lays out the targets that by 2020, the installed capacity of natural fired electric generation shall be above 110 GW, accounting for more than 5% of the total. Three major gas-fired generation projects are promoted, which are: distributed generation, peak power stations, and combined heat and power generation (CHP). However, to shift the energy mix of electricity generation sources into a much cleaner one, many obstacles need to be overcome, among which is the domestic high prices of natural gas making it uneconomical to be extensively used.
Transport fuel. Natural gas vehicles, i.e., cars and ships powered by compressed natural gas (CNG) or liquefied
natural gas (LNG), have been greatly supported by the government with substantial subsidies. Policies are also pushing the construction of CNG/ LNG filling stations. The Plan stipulates that by 2020, there should be about 10 million natural gas vehicles, more than 12,000 gas stations, and more than 200 marine refueling stations.
Chemical production. Here natural gas is used as raw material of menthol and nitrogen fertilizer. Because natural
gas is not economical in China for its high prices, the final chemical products are low-value added. Therefore, the use of gas in chemicals is neither encouraged nor restricted. However, natural gas is indispensable in the production of nitrogen fertilizer – as shown in Figure 10, in the past few years, the trend of natural gas consumptions in chemical production is very similar to that of nitrogen fertilizer application. Considering there’s rigid and high demand for nitrogen fertilizer in China as an agricultural producing country, the total consumption of natural gas used in chemical production will still maintain in a certain scale, though the proportion is shrinking.
Figure 9. Electric power generation by energy sources in the US vs. China in 2016
Data source: (left) EIA. Retrieved from https://www.eia.gov/electricity/monthly/epm_table_grapher.php?t=epmt_1_01. (right) China Energy Portal. Retrieved from https://chinaenergyportal.org/en/2016-detailed-electricity-statistics-updated/
Figure 10. Gas consumption in chemical production and Nitrogen fertilizer application
Source: Mingsheng Securities (2017).
Natural gas 33.8% Coal 30.4% Nuclear 19.7% Hydro 6.5% Wind 5.5% Other 2.6% Biomass 1.5% In the US Coal 65.5% Hydro 19.5% Wind 4.0% Nuclear 3.5% Thermal 3.2% Natural gas 3.1% Solar 1.1% Oil 0.0% Other 0.0% Volume
of gas used in chemical production Growth in 0.1 bcm
Amount
of nitrogen fertilizer application
Growth in 10K tonnes
4.2 Supply
China’s natural gas supply capacity is continuously enhanced by the demand side, and its external dependence (imports as a proportion of total consumption) is increasing notably – from a low of 2% in 2008 to 38% in 2017 (Figure 11). At present, China has formed a supply pattern of “West gas to the East, North gas to the South, off shore gas landing, suppling nearby”, with diversified sources from indigenous conventional or unconventional gas to imported pipeline or liquified gas (Figure 12).
Figure 11. China’s natural gas production, consumption, and external dependence
Source: Huatai Securities (2017, November 28).
Figure 12. Supply volumes and proportions of different gas sources in China
Source: Haitong Securities (2017, May 21).
GE Strategy and Analytics 2013 (Farina M. F. & Wang, A., 2013) projected that by 2025 (Figure 13), China’s indigenous gas production would grow by 75%, among which unconventional gas would represent 1/3 of the total supply, and shale gas would represent production of 30 bcm (lower than the government’s target) or 7% of the total supply as of Year 2025. Imported gas was estimated to account for 45% of China’s gas supply in 2020 and 50% in 2025. China’s gas supply pattern would be more balanced between domestic and international gas sources in following years. This forecast is very close to most of existing Chinese brokers’ analysis.
Production (in 0.1 bcm)
Consumption
(in 0.1 bcm) External dependence (%)
in bcm
Imported LNG
Imported pipeline gas
Indigenous gas Imported LNG Imported pipeline gas
Figure 13. Trend of China’s natural gas supply by sources
Note: UC: Unconventional gas resources. Source: Farina M. F. & Wang, A. (2013).
4.2.1 Indigenous gas
China is rich in natural gas resources, which are mainly in the North and marine areas (Appendix 3). In particular, according to the US EIA estimate, China owns 31.6 trillion cu.m of technically recoverable shale gas resources, ranking the world’s second only to the US. At the end of 2016, the proven rate of conventional gas reserves was 13% and the rate of unconventional gas was less than 3% (Table 6), indicating that China is just in the early stage of exploration and has big potentials.
Table 6. Proven rates and recovery rates of gas reserves in China by the end of 2016
Natural gas (in bcm) Proven reserves Proven rate of total reserves Accumulated production Recovery rate of proven reserves Remaining recoverable reserves Conventional gas
(incl. Tight gas) 11,700 13.0% 1,400 12.0% 5,200
CBM 692.83 2.3% 24.11 3.5% 334.40
Shale gas 544.13 0.4% 13.62 2.5% 122.41
Data source: NEA, Development Research Center of the State Council, and Ministry of Land and Resources of PRC (2017).
However, the difficulty of gas exploration and exploitation in China is increasing. With intensive exploitation and consumption of high-quality resources in the past few decades, about 80% of remaining conventional gas resources are low-quality and high-risk types: 35% in low-permeability reservoirs, 25% in tight gas reservoirs, and 20% in the deep sea. As for the unconventional gas, the exploitation is not feasible for most reserves under current technological conditions, let alone create positive economic values. The geological conditions of China’s shale gas
are much more complicated than that of the US. The locations of shale gas resources in China are mostly mountainous, lacking in water, and densely populated, all making it challenging to exploit on a large scale. Overall, although China possesses abundant natural gas resources, the complexity of these resources requires advanced technology and continuous capital investment. Protecting ecological civilization is also a serious issue. However, with shrinking production of conventional gas and for energy security, the Chinese government currently is supporting the production of shale gas: 0.3 yuan is subsidized for every cubic meter of shale gas produced in 2016-2018, and 0.2 yuan in 2019-2020, with the aim of hitting the Plan’s target of 30 bcm in 2020.
4.2.2 Imported gas
Figure 14. China’s top 10 natural gas suppliers by volume in 2017
Source: Hart, M., Bassett, L., and Johnson, B., 2018.
Figure 15. Strategic channels of importing gas to China and Import volumes of pipeline gas vs. LNG
Source: (left) Haitong Securities (2017, May 24); (right) Guangda Securities (2018).
Because exploiting indigenous gas resources in China is not as easy as in the US, China pays attention to importing gas from several countries (Figure 14). Strategic importing channels from four corners have formed (Figure 15, left).
Monthly imports of pipeline gas (in 0.1K tonnes) Monthly imports of LNG (in 0.1K tonnes) External dependency (%) Northeastern channel Northwestern channel Overseas channel Asia–China pipeline gas
China–Russia pipeline gas Myanmar–China pipeline gas Overseas LNG
The amount of LNG imports and that of pipeline gas imports are very close, with the amount of LNG slightly larger in recent years (Figure 15, right).
4.2.2.1 LNG imports
Starting from the first LNG tank fleet from Australia landing in Guangdong Province in 2006, LNG imports to China have expanded fast. According to statistics in 2015 (Figure 16), China’s five largest LNG exporters are Australia, Qatar, Malaysia, Indonesia, and Papua New Guinea; China’s three largest LNG importers are China National Petroleum Corporation (CNPC), China Petrochemical Corporation (Sinopec), China National Offshore Oil Corporation (CNOOC) – hereinafter referred to as “the Big Three”. (Just to clarify, PetroChina Co., Ltd is a subsidiary of CNPC, and CNPC holds approximately 82.71% of PetroChina shares on December 31, 2017.)
Figure 16. China’s top 5 LNG exporters and top 3 importers by volume in 2015
Data source: Haitong Securities (2017, May 21).
Figure 17. Comparison of China’s LNG import prices with other indicators and Operation rates of LNG terminals in China
Source: China International Capital Co., Ltd (2017).
However, the average operation rate of current LNG terminals in China is quite low (Figure 17, right). It’s because LNG purchasing prices predetermined in the long-term “take-or-pay” contracts are too high, higher than international prices (Figure 17, left) and even higher than domestic gas selling prices at city gates. To put it another way, the city gate gas price is controlled at a very low level by the government, whereas the LNG import price is
Australia 28% Qatar 25% Malaysia 17% Indonesia 15% Papua New Guinea 8% Others 7% CNOOC 68% CNPC 22% Sinopec 8% Others 2%
Top 5 LNG exporters to China in 2015 Top 3 LNG import companies to China in 2015
$/mmBtu
Henry Hub NBP Japanese & South Korean LNG price China’s LNG import price LNG imports (LHS) Operation rate of LNG terminals (RHS) M tonnes
totally determined by the market and thus often soars when in strong demand, so it’s often the case where LNG purchasing costs are much higher than its selling prices and LNG sellers lose money for every unit of LNG sold. In the future, favorable factors which can bring more LNG imports to China include: a global downward trend of LNG prices, new LNG terminals built in China making renegotiation of existing long-term contracts possible, new LNG contracts with flexible terms, and Chinese gas pricing reform.
4.2.2.2 Pipeline gas imports
At present, China has three international pipelines in operation (Table 7). Since the pipelines were completed, China’s top suppliers of pipeline gas have been Turkmenistan, Uzbekistan, Kazakhstan, and Myanmar. In 2016, China imported about 29.4 bcm of pipeline gas from Turkmenistan, taking up 77% of the nation’s total pipeline gas imports. The percentage indicates a high dependency on a single country and thus a high concentration risk. What’s worse, Turkmenistan is politically unstable. According to Sun, L., Wu X., Li, J. S, Y. (2016), in Year 2014, the regulatory safety index of Turkmenistan was 17.92, Uzbekistan 14.74, and Myanmar 8.43, in stark contrast to the regulatory safety indices of China’s top two LNG suppliers, Australia and Qatar, which respectively were 92.75 and 82.71. Therefore, to ensure energy security, it’s necessary for China to have both LNG imports and pipeline gas imports in the long run.
Table 7. Cross-border gas pipelines in China
Cross-border pipelines Location of
Gas sources Status
Length (Km) Capacity (bcm/year) Year of completion International connecting point Central Asia - China Gas
Pipeline A
Turkmenistan, Uzbekistan,
and Kazakhstan
In operation 1833 15 2009 Khorgos in Xinjiang
Central Asia - China Gas
Pipeline B In operation 1833 15 2010 Khorgos in Xinjiang
Central Asia - China Gas
Pipeline C In operation 1840 25 2014 Khorgos in Xinjiang
Central Asia - China Gas
Pipeline D In research 970 30 2020E Wuqia in Xinjiang
Myanmar - China
Pipeline Myanmar In operation 2520 12 2013 Guigang in Guangxi
China - Russia East
Pipeline Russia
Under
construction 4000 38 2019E Heihe in Heilongjiang
China - Russia West
Pipeline Russia Delayed N/A 30 N/A N/A
Note: The owner and operator of these pipelines above is PetroChina Co., Ltd. Data source: Haitong Securities (2017, May 21).
4.3 Infrastructure
Natural gas infrastructures constitute the midstream of the gas value chain, which are comprised of transportation and storage facilities such as gas pipelines, gas storage, LNG receiving terminals, LNG tankers trunks, etc.
Gas pipelines. By the end of 2016, the length of pipelines in operation was 68 thousand Km and the transmission
capacity of major pipelines exceeded 280 bcm of gas per year, which are targeted respectively at 104 thousand Km and a transmission capacity of 400 bcm/year by 2020. Besides cross-border pipelines (Table 7), domestic pipelines are also expanding quickly, expected to cover 90% of prefecture-level cities by 2020 and 95% by 2030. Table 8
shows some information as of the end of Year 2015 about the top 5 domestic pipelines.
Table 8. Top 5 domestic pipelines in China at the end of 2015
Domestic pipelines Capacity (bcm/year) Length (Km) Year of completion No. of provinces covered
Main gas sources Transmission operator
West - East Gas Pipeline III 30 7,378 2014 10 Central Asia PetroChina
West - East Gas Pipeline II 30 4,859 2012 15 Central Asia PetroChina
West - East Gas Pipeline I 12 4,200 2004 9 Kela2 Gas Field in
Tarim Basin PetroChina
Sichuan - East Gas Pipeline 12 2,203 2010 7 Sichuan Basin Sinopec
Zhong - Gui Pipeline 15 1,636 2012 6 Tarim Basin, Central
Asia, Myanmar PetroChina Data source: Haitong Securities (2017, May 21).
Underground gas storage. At the end of 2016, 18 underground gas storage reservoirs were in operation, whose
total volume of working gas was 6.4 bcm, making up only 3.1% of natural gas consumption in 2016 – this was far from the basic need. The world average ratio of working gas capacity to annual gas consumption is 12% - 15%, or the ratio should be at least 10% to ensure the needs of peak shaving and supply guarantee. Hence, a few relevant policies have been launched, of which the most specific one is “Opinions on accelerating construction of gas storage facilities and improving the market mechanism of gas storage and peak regulation services” issued by NDRC and NEA in April 2018, as a tough position against the severe gas shortage in 2017. In this document, three indicators are set: (1) by 2020, a gas supplier shall have a storage capacity as above 10% of its contractual sales; (2) a prefecture-level city shall have a daily storage capacity as above average 3 days demand of the city; (3) a gas distribution company shall have a storage capacity as above 5% of its annual gas consumption.
LNG facilities. According to International Gas Union (IGU) 2017 World LNG Report, China owned 11 LNG carriers by April 2017.
By the end of 2015, China had 12 LNG import terminals in operation, whose reception capacity was 43.8 billion tonnes per year; by 2020, there will be more than 21 LNG import terminals in operation. Tank capacities of these LNG terminals at present only accounts for 2.2% of the national gas consumption, in contrast with about 15% in Japan and South Korea. This is another indication that China lacks gas storage capacity. While seeing the great profits in the future, private companies have begun to actively participate in China’s LNG market. For now, more than 40 LNG terminals are in construction or in plan, half of which are owned by private companies.
The number of LNG tanker trucks in China reached 9,106 by 2017 (from around 5,000 in 2013), increasing by 14.45% compared to 2016. The coal-to-gas switching policy clearly pulled the increase, for the new LNG tanker trucks notably concentrated in the BTH region, especially in the Hebei province, where the number of LNG tanker trucks was increased by 22.76%, far above the national average.
The development of LNG railway tankers is also underway, as the prototype design of China’s first LNG railway tanker was approved in April 2015. The transportation cost of LNG railway is expected to be 0.37-0.42 yuan/tonne per Km, which is much lower than that of road or pipeline transportation.
In conclusion, gas infrastructures in China are quite limited, restraining the expansion of both ends of the natural
gas value chain. Long-distance gas pipelines are not so many that they have residual capacities which can be given out to third parties, even though favorable policies have been issued by NEA that gas transmission operators should fairly give third-parties fair access to their gas infrastructures (“Supervision measures to fairly open oil and gas pipeline network facilities (trial)” issued in February 2014), and publicize all the information of their pipeline networks and LNG terminals (“Notification of the completion of information disclosure related to oil and gas pipeline network facilities” issued in September 2016).
Furthermore, as the gas shortage in winter 2017-18 evidenced, the most crucial problem in China’s natural gas market for now is the lack of the gas storage and peak regulation capacity, that is, far from enough underground gas reservoirs and LNG storage tanks. Therefore, China needs to make great efforts to construct more gas infrastructures. Only in this way, its boosted gas demand can be satisfied, and its extended supply can be used in place.
5. Market structure
The natural gas value chain is shown in Figure 18. Because of different product characters, the natural gas market can be divided into two segments: the pipeline natural gas market and the liquified natural gas (LNG) market. In the Chines pipeline gas market, three national oil and gas companies, China National Petroleum Corp. (CNPC), China Petrochemical Corp. (Sinopec), China National Offshore Oil Corp. (CNOOC), i.e., “the Big Three” dominate the upstream and midstream of the value chain. The Big Three make a vertical integrated market structure, for they explore, produce, transport, and store gas, and can bundle these services into one sales product. It’s significant that the Big Three own the most of exploration and exploitation rights and trunk pipelines. The downstream market, however, is more competitive, which is comprised of different kinds of gas distribution companies and wholesale end users that are state-owned, private, or foreign invested.
Except the importation side which depends on the ownership of receiving terminals, the LNG market is already full of various players from the upstream to the downstream. Now with more and more LNG terminals run by non-big-three companies, the entire LNG market in China is going to be highly competitive.
Further details of the market structures along the natural gas value chain in China are summarized in Table 9.
Figure 18. Natural gas value chain
Source: The Development Research Center of the State Council of PRC and Shell International (2015).
Table 9. Pipeline gas and LNG market structures and players in China
Pipeline gas Position in the
gas value chain Upstream Midstream Downstream
Function Domestic production Pipeline gas
imports Transmission and storage Distribution and end uses
Competitiveness State-owned oligopoly State-owned
oligopoly State-owned oligopoly Highly competitive
Players
The Big Three, Yanchang Petroleum, and smaller players mainly producing unconventional gas
The Big Three, and several smaller players
The Big Three, and several smaller players having pipelines within small geographic scopes
More than 1,450 city gas companies, and
numerous end users of different kinds
LNG Position in the
gas value chain Upstream Midstream Downstream
Function Liquification plants LNG imports &
terminals LNG tank trucks LNG fueling stations
Competitiveness Highly competitive State-owned
oligopoly Highly competitive Highly competitive
Players
50% private companies, and 50% state-owned companies
The Big Three, and several smaller players
PetroChina, and many