Ecological, morphological and allozymic differentiation between diploid
and tetraploid knapweeds (Centaurea jacea) from a contact zone in the
Belgian Ardennes
O. J. Hardy1, S. Vanderhoeven1, M. De Loose2 AND P. Meerts1
1 Laboratoire de Génétique et Ecologie Végétales, Université Libre de Bruxelles, Chaussée de Wavre 1850, B-1160 Bruxelles, Belgium 2
Departement Plantengenetica en -veredeling, Centrum Landbouwkundig Onderzoek, Ministerie van Middenstand en Landbouw, Caritastraat 21, B-9090 Melle, Belgium
SUMMARY
In the northeastern part of Belgium, the Centaurea jacea complex shows extensive morphological variation and is represented by a diploid (2n = 22) and a tetraploid (2n = 44) cytotype. Polysomic inheritance of allozyme markers in the tetraploids, suggesting autopolyploidy, is here demonstrated for the first time. In order to test whether the two cytotypes occupy distinct habitats and possess different gene pools, patterns of allozymic and morphological variation were investigated in relation to ploidy level and site characteristics in 26 populations from the Belgian Ardennes. The two cytotypes showed a parapatric distribution, the diploids occurring at higher elevations (mostly above 500 m) than the tetraploids (mostly below 500 m). Three mixed populations were found near the contact zone of the two cytotypes. Within the mixed populations no triploid plant and no evidence for gene flow between cytotypes were found, despite widely overlapping flowering periods. The two cytotypes can be distinguished on the basis of morphological traits and enzymatic gene pools. The congruence of
morphological and allozymic variation with chromosome numbers suggests a secondary contact between the two cytotypes with limited gene flow between them. The origin and persistence of the parapatric distribution are discussed.
Keywords: Centaurea jacea complex (knapweeds) ; polyploidy ; parapatric cytotypes ; hybridization ;
tetrasomic inheritance ; morphological variation ; flow cytometry.
INTRODUCTION
In northwestern Europe, knapweeds (Centaurea subg. Jacea (Mill.) Hayek, Asteraceae) form an extremely polymorphic complex, sometimes referred to as the C. jacea/nigra complex (Marsden-Jones & Turrill, 1952; Gardou, 1972; Guinochet & de Vilmorin, 1982). Accordingly, taxonomic treatments are highly controversial, ranging from a single polymorphic species (Briquet, 1931), to several dozens of species (Van Soest, 1947; Dostal, 1976). Biosystematic studies have demonstrated low overall levels of genetic divergence within the complex. Specifically, crosses between most putative taxa within the complex, including those involving the most distantly related morphotypes (the so-called C. nigra L. and C. jacea L. sensu stricto), most often yield viable and fertile offspring (Marsden-Jones & Turrill, 1952; Saarisalo-Taubert, 1966; Gardou, 1972). These findings, in addition to the lack of clear-cut discontinuities in morphological variation, led Gardou (1972) to conclude that the complex formed a single biological species. That point of view recently received circumstantial support from the patterns of allozymic variation (Sommer, 1990), which demonstrated the low level of genetic divergence within the whole complex, and the absence of distinct allozymic gene pools for the subordinate taxa
C. jacea s. s. and C. nigra, as well as for the different ploidy levels. Hence in this paper we use the name C. jacea in a broad sense, to refer to the whole complex.
The complex comprises two ploidy levels (2n = 22, 44), both of which are represented in most putative taxa within the complex (Gardou, 1972; Dostal, 1976; Sommer, 1990; Weeda et al., 1991). The origin of polyploidy in C. jacea s. l. is not resolved. Caryological observations (Gardou, 1972) suggest an allopolyploid origin, while allozymic phenotypes (Sommer, 1990) indicate a tetrasomic mode of inheritance and thus an autopolyploid origin. Tetraploid populations are apparently more variable and have a wider ecogeographical distribution than diploid ones (Gardou, 1972; Weeda et al., 1991). As in many other polyploid complexes, single cytotypes apparently occur over large areas, although the distribution areas of diploids and tetraploids overlap in particular
areas of Europe (Gardou, 1972), including eastern Belgium (Sommer, 1990).
In several other polyploid complexes, comparisons of ecogeographical distribution of different cytotypes in areas where they co-exist have offered excellent opportunities to gain deeper knowledge on the ecological and
evolutionary significance of variation in chromosome number (e.g. Deschampsia : Rothera & Davy, 1986;
Dactylis : Lumaret et al., 1987; Lumaret & Barrientos, 1990; Bretagnolle & Thompson, 1996; Anthoxanthum :
Felber-Girard et al., 1996; Lotus : Blaise et al., 1991 ; Gauthier et al., 1998; Arrhenatherum : Petit et al., 1997; Petit & Thompson, 1997; Epilobium : Husband & Schemske, 1998; Plantago : Van Dijk et al., 1992; Van Dijk & Bakx-Schotman, 1997; Galax : Burton & Husband, 1999). Within contact zones, cytotypes usually show spatial segregation (e.g. Van Dijk et al., 1992; Felber-Girard et al., 1996; Burton & Husband, 1999) as a result of niche differentiation and/or of a 'minority cytotype exclusion' effect (Levin, 1975) caused by unsuccessful intercytotype crosses. The relative significance of these phenomena is, however, controversial (Van Dijk & Bakx-Schotman, 1997; Petit et al., 1999).
In Belgium, preliminary data indicate that the diploid cytotype would be restricted to the eastern part of the country (the Ardennes massif; J. Lambinon & C. Moulin, unpublished). There, populations with and without ray florets co-exist over short distances (personal observation) and preliminary data seem to indicate that these two floral morphs would have different chromosome numbers.
This study investigates the variation pattern of 26 populations of knapweeds in the northeastern part of the Belgian Ardennes using morphological and allozymic markers. It is established that the two floral morphs consistently have different chromosome numbers, and segregation patterns of allozymes are used to demonstrate that the tetraploids have a tetrasomic mode of inheritance. Tests were carried out to determine whether the two cytotypes have distinct ecogeographical distributions. The study focuses on a contact zone where the two cytotypes were found to co-exist; morphological and allozymic variation in mixed populations are investigated in greater detail. In particular, we tested whether the patterns of morphological, allozymic and chromosomic variation were congruent. Finally, the potential factors determining the parapatric distribution of cytotypes and the reproductive isolation between cytotypes are discussed.
MATERIALS AND METHODS Population sampling and site description
The study area is located in the northeastern Belgian Ardennes and roughly corresponds to the basin of the river Amblève. In that region, the C. jacea complex shows extensive morphological polymorphism. The most variable characters include involucral bract shape, achene pappus length and presence/ absence of ray florets. Based on Dostal (1976) and Lambinon et al. (1992), the C. jacea complex comprises three microspecies in that area : C.
nigra (flower heads with deeply pinnatisect bracts and lacking peripheral ray florets; achenes with well
developed pappus) ; C. jacea s. s. (flower heads with entire bracts and peripheral ray florets; achenes without pappus); and C. thuillieri (Dostal) J. Duvigneaud et Lambinon (= C. pratensis Thuill.) (flower heads with dissected bracts and peripheral ray florets; achenes without pappus). Intermediate morphs also occur.
Twenty-six populations were sampled along an altitudinal gradient (200-600 m) over an area of c. 2000 km2 (Fig. 1). Fourteen populations (hereafter referred to as t1-t14) contained only plants with ray florets; nine populations (d1-d9) contained only plants without ray florets; and in three populations (m1-m3) both
morphotypes grew intermingled. In two of the latter (m1 and m2), each plant sampled for flow cytometry was labelled in the first week of July 1997 and its morphotype recorded. At that time both morphotypes were
flowering. Habitat characteristics (road verge, hay meadow, pasture), altitude, slope and aspect were recorded for each population and a soil sample (bulk sample of five cores at 0-12 cm depth) were collected for determination of pH and phosphorus concentration (phosphorus extracted with ammonium acetate-EDTA, pH 4.65, and determined by vanado-molybdate colorimetry). The dominant plant species were listed. The vegetation data were analysed using Ellenberg's (1974) indicator values, which represent estimators of the relationship of each species to several major environmental factors. Three indices were considered: the F-index (soil moisture), R-index (soil pH) and N-index (soil nitrogen availability). For each index the site mean value was calculated as the average of the individual values of all species.
Fig. 1. Study area and locations of populations of Centaurea jacea s. l. in the Belgian Ardennes. White dots,
diploid populations; black dots, tetraploid populations; black-and-white dots, mixed populations. Altitudes: white, <300 m; light hatching, 300 500 m; dense hatching, 500 694 m.
Flow cytometry
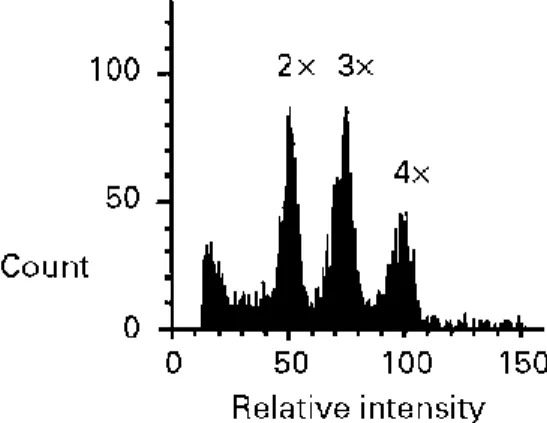
In each population, fresh leaves were collected from 10-20 plants in July 1997 for ploidy-level determination. The sample was increased in August 1997 in two mixed populations (m1 and m2), when both morphotypes were still flowering, to 60 and 130 plants, respectively. Flow cytometry was used to assess the ploidy level of 540 individuals. This technique allows the rapid determination of the relative DNA content of individual nuclei by measuring the fluorescence of a fluorochrome (4',6-diamidino-2-phenylindole, DAPI) that specifically binds to DNA (Galbraith et al., 1983). To release individual nuclei, small pieces of fresh leaves were chopped with a sharp razor blade in a Petri dish after addition of 0.5 ml 0.1 M sodium hydrogen phosphate at pH 7, containing 0.5% Tween 20. After filtration through a 30-µm nylon filter, 0.5 ml of a solution of 5 g l-1 DAPI in 0.1 M sodium hydrogen phosphate was added. Flow cytometry measurements were performed with a Partec machine equipped with a UV lamp. The fluorochrome was excited at 340 nm and emitted at 465 nm. An individual whose chromosome number had been checked by direct counting on root-tip cells was used as an internal standard for each measurement. This method allows us to discriminate diploids, triploids and tetraploids (Fig. 2), and also permits the detection of rare ploidy levels, because large sample sizes can be analysed.
Fig. 2. Frequency distribution of fluorescence intensity of single nuclei for a mixed sample of di-, tri- and
tetraploid analysed by flow cytometry. The triploid was obtained by artificially crossing a diploid and a tetraploid.
Allozyme electrophoresis
In two mixed populations (m1 and m2) and in two pure populations of each morph (d1, d2, t4, t12), 19-71 individuals of each morph were sampled for allozyme electrophoresis, providing a total sample of 154 diploids and 165 tetraploids. To extract proteins, 300 mg of fresh leaves were ground in a mortar with 1 ml of the following extraction buffer: 0.001 M EDTA, 0.01 M NaCl, 0.01 M MgCl2, 4% polyvinyl pyrrolidone and 0.1% 2-mercaptoethanol in 0.1 M Tris-HCl at pH 7.5. The extract was centrifuged at 15 000 g and the supernatant was stored at -75°C before analysis. The electrophoresis was run on a vertical polyacrylamide gel (8%) for 5 h at 300 V. Fifteen enzymatic systems were assayed using standard staining recipes (Hillis et al., 1996). Three systems [6-phosphogluconate dehydrogenase (PGD), EC 1.1.1.44; leucine aminopeptidase (LAP), EC 3.4.11.1; diaphorase (DIA), EC 1.8.1.4] were selected because they were polymorphic and showed readily interpretable banding patterns at one locus (Fig. 3). The enzymatic systems LAP and DIA were monomeric, and accordingly each band could be ascribed to one allele. PGD is dimeric and, accordingly, intermediate bands corresponding to heterodimers were detected in the heterozygotes. For all enzymes the relative intensity of the bands was taken into account for genotypic interpretation in the tetraploids. In the case of the monomeric enzymes, it occasionally proved difficult to determine if two-banded zymograms corresponded to a 2:2 or a 3:1 allelic ratio. The same problem was encountered for three-banded phenotypes. In contrast, for the dimeric enzyme PGD the genotypic interpretation of tetraploids was highly reliable because the intensity of each band was proportional to the product of the relative frequencies of the constituent polypeptides.
Nei's genetic distances between cytotypes and populations were calculated based on allelic frequencies (Nei, 1987) and were used to construct an unweighted pair-group method with arithmetic averages (UPGMA) dendrogram. Nei's distances can be used to compare populations with different ploidy levels, as they rely solely on allele frequencies per population (although those alleles are grouped by two or four within individuals). However, for identical genetic and demographic parameters Nei's distances are expected to be smaller for comparisons between tetraploid populations than diploid ones, because genetic drift is lower in tetraploids (the same is true for co-ancestry coefficients; Ronfort et al., 1998). Thus care must be taken in the dendrogram in interpreting differences in branch lengths.
Morphometric variation in mixed populations
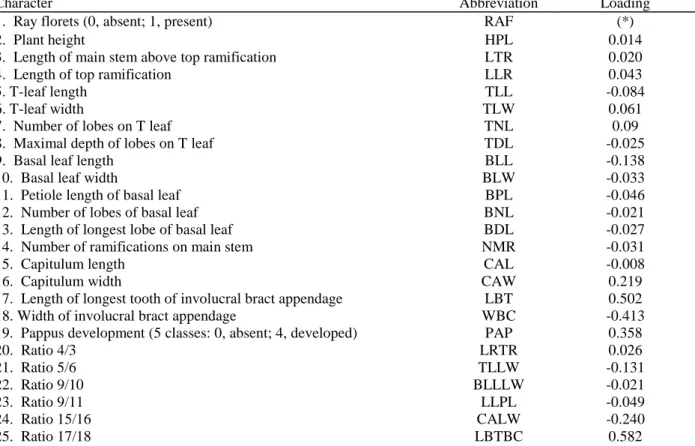
A morphological investigation was conducted in two populations in which diploid and tetraploid plants co-existed (m1 and m2). In these populations we assumed that morphological differences between the cytotypes, if any, would have a genetic basis, as both cytotypes were subjected to common environmental conditions. Herbarium samples of 10-20 plants of each cytotype were collected in August 1997; at that time nearly all labelled individuals of both cytotypes were still flowering. Nineteen morphological traits were assessed on each plant, including characters that are classically used to discriminate species in the C. jacea complex (e.g. pappus of achene, involucral bract appendage, Dostal, 1976; Table 1). Differences between cytotypes were tested by means of multivariate analysis of variance (MANOVA) and canonical discriminant analysis.
Crossing experiments
To assess the mode of inheritance for the tetraploid cytotype, controlled crosses were performed and the genotype of the progeny was scored using allozyme markers. To carry out the crosses, floral heads were
enclosed in paper bags prior to anthesis. At anthesis, those heads were brushed against each other once every day for three to four consecutive days. Thereafter, paper bags were put back on the heads to avoid pollen
contamination. It was not necessary to emasculate flowers because knapweeds are highly self-incompatible (Gardou, 1972). The resulting seeds were allowed to germinate in Petri dishes with distilled water in a growth chamber.
Parents to be crossed were selected so that, at a given locus, one was homozygote whereas the other possessed three or four different alleles. Hence the genotypes of the gametes produced by the het-erozygote parent could be inferred directly from the genotypes of the progenies.
Table 1. Morphometric characters studied and their canonical loadings (correlations between conditional
dependent variables and dependent canonical factor)
Character Abbreviation Loading
1. Ray florets (0, absent; 1, present) RAF (*)
2. Plant height HPL 0.014
3. Length of main stem above top ramification LTR 0.020
4. Length of top ramification LLR 0.043
5. T-leaf length TLL -0.084
6. T-leaf width TLW 0.061
7. Number of lobes on T leaf TNL 0.09
8. Maximal depth of lobes on T leaf TDL -0.025
9. Basal leaf length BLL -0.138
10. Basal leaf width BLW -0.033
11. Petiole length of basal leaf BPL -0.046
12. Number of lobes of basal leaf BNL -0.021
13. Length of longest lobe of basal leaf BDL -0.027
14. Number of ramifications on main stem NMR -0.031
15. Capitulum length CAL -0.008
16. Capitulum width CAW 0.219
17. Length of longest tooth of involucral bract appendage LBT 0.502
18. Width of involucral bract appendage WBC -0.413
19. Pappus development (5 classes: 0, absent; 4, developed) PAP 0.358
20. Ratio 4/3 LRTR 0.026 21. Ratio 5/6 TLLW -0.131 22. Ratio 9/10 BLLLW -0.021 23. Ratio 9/11 LLPL -0.049 24. Ratio 15/16 CALW -0.240 25. Ratio 17/18 LBTBC 0.582
(*) Character excluded from canonical discriminant analysis. The T-leaf is the one below the last top ramification of the main stem.
RESULTS Spatial distribution
A total of 223 individuals from 12 populations were found to be diploid, and 317 individuals from 17 populations were found to be tetraploid. With two exceptions all tetraploid plants possessed ray florets, and without exception all diploid plants possessed no ray florets. Twenty-one populations were homogeneous with respect to ploidy level. In three populations (m1, m2 and m3), diploid and tetraploid plants grew intermingled. In addition to diploids and tetraploids, one hexaploid plant was detected in population t12. No triploid plant was found in any population.
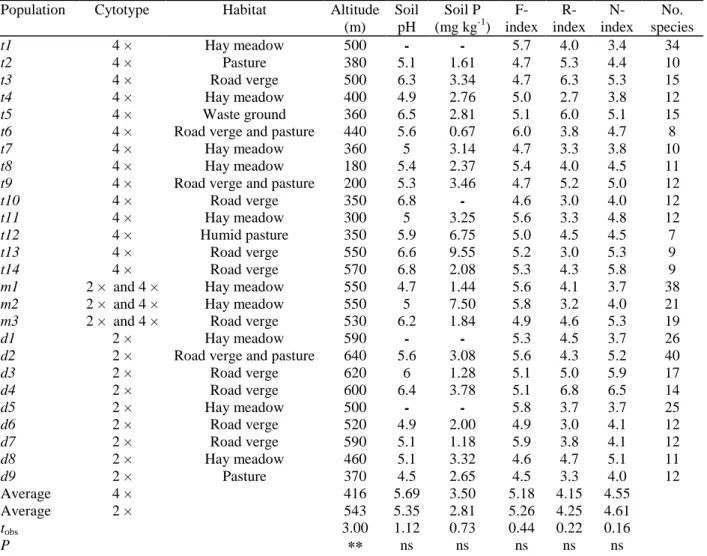
There was a striking geographical segregation of diploid and tetraploid plants (Fig. 1). Specifically, the diploids were found only in the eastern part of the study area; the altitude of the corresponding sites ranged from 370-640 m. By contrast, the tetraploids were mostly found in the western part of the study area, at altitudes ranging from 180-570 m. The mean altitudes were significantly different for the two cytotypes (Table 2). Two of the mixed populations (m2 and m3) occurred close to the contact zone.
Table 2. Site characteristics in the populations (d, t and m refer to diploid, tetraploid and mixed populations,
respectively)
Population Cytotype Habitat Altitude
(m) Soil pH Soil P (mg kg-1) F- index R- index N-index No. species t1 4 × Hay meadow 500 - - 5.7 4.0 3.4 34 t2 4 × Pasture 380 5.1 1.61 4.7 5.3 4.4 10 t3 4 × Road verge 500 6.3 3.34 4.7 6.3 5.3 15 t4 4 × Hay meadow 400 4.9 2.76 5.0 2.7 3.8 12 t5 4 × Waste ground 360 6.5 2.81 5.1 6.0 5.1 15
t6 4 × Road verge and pasture 440 5.6 0.67 6.0 3.8 4.7 8
t7 4 × Hay meadow 360 5 3.14 4.7 3.3 3.8 10
t8 4 × Hay meadow 180 5.4 2.37 5.4 4.0 4.5 11
t9 4 × Road verge and pasture 200 5.3 3.46 4.7 5.2 5.0 12
t10 4 × Road verge 350 6.8 - 4.6 3.0 4.0 12
t11 4 × Hay meadow 300 5 3.25 5.6 3.3 4.8 12
t12 4 × Humid pasture 350 5.9 6.75 5.0 4.5 4.5 7
t13 4 × Road verge 550 6.6 9.55 5.2 3.0 5.3 9
t14 4 × Road verge 570 6.8 2.08 5.3 4.3 5.8 9
m1 2 × and 4 × Hay meadow 550 4.7 1.44 5.6 4.1 3.7 38
m2 2 × and 4 × Hay meadow 550 5 7.50 5.8 3.2 4.0 21
m3 2 × and 4 × Road verge 530 6.2 1.84 4.9 4.6 5.3 19
d1 2 × Hay meadow 590 - - 5.3 4.5 3.7 26
d2 2 × Road verge and pasture 640 5.6 3.08 5.6 4.3 5.2 40
d3 2 × Road verge 620 6 1.28 5.1 5.0 5.9 17 d4 2 × Road verge 600 6.4 3.78 5.1 6.8 6.5 14 d5 2 × Hay meadow 500 - - 5.8 3.7 3.7 25 d6 2 × Road verge 520 4.9 2.00 4.9 3.0 4.1 12 d7 2 × Road verge 590 5.1 1.18 5.9 3.8 4.1 12 d8 2 × Hay meadow 460 5.1 3.32 4.6 4.7 5.1 11 d9 2 × Pasture 370 4.5 2.65 4.5 3.3 4.0 12 Average 4 × 416 5.69 3.50 5.18 4.15 4.55 Average 2 × 543 5.35 2.81 5.26 4.25 4.61 tobs 3.00 1.12 0.73 0.44 0.22 0.16 P ** ns ns ns ns ns
Ellenberg's indices (F, soil moisture; R, soil pH; N, nitrogen availability) are means over all species. Students t-tests for differences between diploids and tetraploids. **, P <0.01; ns, not significant.
Ecological distribution
Apart from altitude, there was no striking difference in habitat characteristics between the two cytotypes (Table 2). Diploid populations occurred on slightly more acidic soils than tetraploid ones, but the difference was not significant (pH ranges : tetraploid sites, 4.9-6.8; diploid sites, 4.5-6.4). Exchangeable phosphorus ranged from 0.67-9.55 mg kg-1 with an average of 3.5 for the tetraploids, and from 1.13-7.5 mg kg-1 with an average of 2.5 for the diploids; the difference was not significant. Site-averaged Ellenberg's indices were not statistically different between diploid and tetraploid populations (Table 2).
Within one of the mixed populations (m1), situated along a small river, tetraploids were often found close to the bottom of the basin and diploids on its slope, but patches in which the cytotypes were intermixed also existed. Within the other two mixed populations (m2 and m3) there was no obvious spatial segregation of the cytotypes.
Allozymic variation
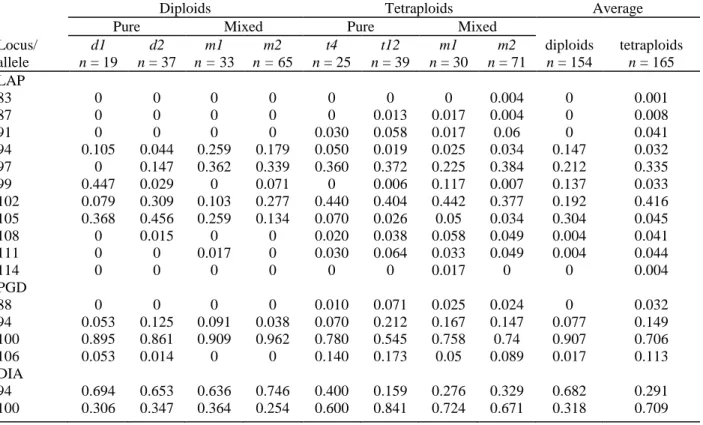
The allelic frequencies are shown in Table 3 for each population. A total of 17 alleles were detected (two for DIA, four for PGD and 11 for LAP; Fig. 3). The 11 alleles of the LAP system is an underestimate because, for a few of them, difference of migration was too weak to ascertain correct identification and so they were treated as a single allele. For example, alleles 105 and 106 present in the control were grouped (Fig. 3).
All the alleles found in the diploids also existed in the tetraploids, but five out of 17 alleles, all of which had a low frequency (<0.05), were unique to the tetraploids. Among the shared alleles, LAP94, LAP105 and DIA94 were substantially more frequent in all the diploid populations, whereas LAP102 and DIA100 were more frequent in all the tetraploid populations. Fixed heterozygosity was not observed in tetraploid populations at any locus.
The dendrogram based on Nei's genetic distance (Fig. 4) shows that all populations were grouped according to ploidy level, and that the genetic divergence between the cytotypes was much stronger than the divergence among populations within each cytotype. Branch lengths were shorter within the tetraploid than the diploid cytotype. This is consistent with the expectation that genetic drift within tetraploid populations is lower than within diploid (Ronfort et al., 1998).
Genetic distances between cytotypes in mixed populations were no smaller than the distances between allopatric cytotypes (Table 4).
Table 3. Allelic frequencies at three enzymatic loci in two mixed and two pure populations of either cytotype,
and average frequencies over all populations
Diploids Tetraploids Average
Pure Mixed Pure Mixed
Locus/ allele d1 d2 m1 m2 t4 t12 m1 m2 diploids tetraploids n = 19 n = 37 n = 33 n = 65 n = 25 n = 39 n = 30 n = 71 n = 154 n = 165 LAP 83 0 0 0 0 0 0 0 0.004 0 0.001 87 0 0 0 0 0 0.013 0.017 0.004 0 0.008 91 0 0 0 0 0.030 0.058 0.017 0.06 0 0.041 94 0.105 0.044 0.259 0.179 0.050 0.019 0.025 0.034 0.147 0.032 97 0 0.147 0.362 0.339 0.360 0.372 0.225 0.384 0.212 0.335 99 0.447 0.029 0 0.071 0 0.006 0.117 0.007 0.137 0.033 102 0.079 0.309 0.103 0.277 0.440 0.404 0.442 0.377 0.192 0.416 105 0.368 0.456 0.259 0.134 0.070 0.026 0.05 0.034 0.304 0.045 108 0 0.015 0 0 0.020 0.038 0.058 0.049 0.004 0.041 111 0 0 0.017 0 0.030 0.064 0.033 0.049 0.004 0.044 114 0 0 0 0 0 0 0.017 0 0 0.004 PGD 88 0 0 0 0 0.010 0.071 0.025 0.024 0 0.032 94 0.053 0.125 0.091 0.038 0.070 0.212 0.167 0.147 0.077 0.149 100 0.895 0.861 0.909 0.962 0.780 0.545 0.758 0.74 0.907 0.706 106 0.053 0.014 0 0 0.140 0.173 0.05 0.089 0.017 0.113 DIA 94 0.694 0.653 0.636 0.746 0.400 0.159 0.276 0.329 0.682 0.291 100 0.306 0.347 0.364 0.254 0.600 0.841 0.724 0.671 0.318 0.709
Table 4. Comparison of Nei's (1987) genetic distances between cytotypes in sympatric populations (underlined)
and allopatric populations
Diploids Tetraploids m1 m2 d1 d2 m1 0.189 0.191 0.278 0.174 m2 0.141 0.152 0.310 0.167 t4 0.115 0.108 0.261 0.124 t12 0.320 0.364 0.532 0.337
Fig. 3. Images of representative phenotypes at the three polymorphic enzyme loci for diploids and tetraploids of
the Centaurea jacea complex. Alleles are named according to their relative mobility, and the inferred genotypes are given at the bottom of each line. A tetraploid control occurs in lanes 3 and 8 in each gel (genotypes in italics).
Fig. 4. Unweighted pair-group method with arithmetic averages (UPGMA) dendrogram according to Nei's
Morphological variation
In the two mixed populations (m1 and m2), a MANOVA showed that the two cytotypes were highly significantly different, based on 16 morphological traits (Wilks' Lambda = 0.108, F(16,34) = 17.53, P <0.001). All individuals were correctly grouped by the discriminant function (Fig. 5). Based on canonical loadings (Table 1), the characters that best discriminate the two cytotypes are LBTBC, LBT, WBC, PAP and CALW. Specifically, diploids had more deeply laciniate appendages of involucral bracts (LBTBC, mean ±SE: diploids, 1.48 ± 0.05; tetraploids, 0.53 ± 0.06); a longer pappus (PAP, mean ±SE: diploids, 3.18 ± 0.16; tetraploids, 1.3 ± 0.18); and more spherical capitula (CALW, mean ±SE: diploids, 1.06 ± 0.02; tetraploids, 1.23 ± 0.02). The possession of ray florets was not included in the MANOVA because it is a presence/absence character. All diploid individuals had capitula without ray florets, while all tetraploid individuals except two (population m2) had ray florets.
Fig. 5. Frequency distribution of individual scores on canonical discriminant function. Hatched bars, diploids.
Mode of inheritance in tetraploids
A first cross involved a mother with four different alleles at locus PGD pollinated by a homozygote father. Both parents originated from population m2. Under a disomic inheritance, four different genotypes were expected, whereas under a tetrasomic inheritance six were expected, or even more in the presence of double reduction (Demarly, 1963). In the analysis of 32 progenies we obtained six different genotypes. The observed frequencies of those genotypes did not significantly differ from the 1/6 frequency expected with tetrasomic inheritance without double reduction (observed frequencies: 8, 6, 5, 3, 6 and 4 for gametic genotypes 88/94, 88/100, 88/106, 94/100, 94/106 and 100/106, respectively; χ2 = 2.88, P = 0.7).
A second cross involved one parent with three different alleles (hereafter called a, b and c) at locus LAP with genotype aabc, and another parent homozygote with genotype aaaa. Reciprocal crosses led to a total of 64 progenies. As mentioned previously, exact genotypic interpretation for two or three banded LAP phenotypes cannot be achieved with absolute confidence. Hence we analysed phenotype frequencies considering only the presence or absence of the different alleles. Four different phenotypes were observed in the progeny: a, ab, ac and abc (with frequencies 10, 20, 23 and 11, respectively). Under a disomic inheritance with the two a alleles in the heterozygote parent located on homologous chromosomes, the expected frequencies are 16, 16, 16 and 16, respectively (χ2 = 7.88, P = 0.048). Under a tetrasomic inheritance without double reduction, the expected frequencies are 10.67, 20.33, 20.33 and 10.67, respectively (χ2 = 0.27, P = 0.97). The discrimination power between disomic and tetrasomic inheritance can be further enhanced by grouping, on the one hand, ab and ac phenotypes, and on the other hand, a and abc phenotypes (disomic inheritance: χ2 = 7.56, P = 0.006; tetrasomic inheritance: χ2 = 0.008, P = 0.93).
Tetrasomy thus appears to be the only mode of inheritance compatible with the observed segregation patterns at PGD and LAP loci. This result is in line with the observation that no fixed heterozygosity occurred in the tetraploid populations at any locus.
DISCUSSION
Ecogeographic distribution of cytotypes
This study offers the first demonstration of a polysomic mode of inheritance in tetraploid knapweeds. This suggests that the tetraploid cytotype occurring in the Belgian Ardennes has an autopolyploid origin. In this
context, the finding of a parapatric distribution of diploids and tetraploids in the study area is particularly interesting. This finding adds to reports of contrasting ecogeographical distributions of cytotypes in several other polyploid complexes (e.g. Stebbins & Zohary, 1959; Kay, 1969; Brunsberg, 1977; Rothera & Davy, 1986; Lumaret et al., 1987; Van Dijk et al., 1992; Felber-Girard et al., 1996; Husband & Schemske, 1998; Segraves et
al., 1999).
Parapatric distributions of different cytotypes can be maintained by two different mechanisms : habitat differentiation and minority cytotype exclusion. Differences between cytotypes in habitat requirements have often been demonstrated in experimental conditions and in the field (e.g. Tyler et al., 1978; Rothera & Davy, 1986; Lumaret et al., 1987; Blaise et al., 1991 ; Felber-Girard et al., 1996; Petit et al., 1997; but see Van Dijk et
al., 1992; Van Dijk & Bakx-Schotman, 1997). In this study there was little evidence for habitat differentiation
between diploids and tetraploids, apart from altitude. Specifically, there was no clear support for an association of diploids (more specifically, the taxon recognized as C. nigra) with a particular type of mountainous hay meadow on acidic, nutrient-poor soil as suggested by Duvigneaud & Saintenoy-Simon (1997). This result should be considered with caution, however, because those hay meadows have dramatically decreased in the last decades in the Ardennes as a consequence of fertilization and reclamation (Norway spruce plantations) ; accordingly, they are not well represented in our sample. The two cytotypes might conceivably differ in their climatic tolerance. Specifically, areas 500 m or more above sea level are regarded as phytogeographically distinct (the so-called Haute Ardenne), with a substantial proportion of mountain species in the flora (Lambinon
et al., 1992). However, our results do not provide strong evidence that diploids occurred at sites with a higher
proportion of mountain species in their flora.
Minority cytotype exclusion can keep the areas of two cytotypes distinct even in the absence of contrasting habitat requirements. It occurs whenever a minority cytotype suffers reproductive inferiority due to ineffectual intercytotype pollination (Levin, 1975), for example, when hybrids have reduced fitness. This can explain limited intermingling of cytotypes that have come into contact after expansion from different origins (Thompson & Lumaret, 1992; Van Dijk & Bakx-Schotman, 1997; Bretagnolle et al., 1998 ; Petit et al., 1999), and may account for the pattern observed with knapweeds in the Belgian Ardennes.
Congruency of chromosomic, allozymic and morphological variation
The differences in morphology and allelic frequencies between the two cytotypes do not support an origin of the tetraploids through autopolyploidization of the neighbouring diploids. Rather, the evidence presented in this paper fits in better with a secondary contact between two cytotypes of different origin. Moreover, several observations suggest that gene flow between the two cytotypes is very limited in the contact zone. First, no morphologically intermediate plants were found in the mixed populations, and characters that best discriminate the two cytotypes showed no tendency to be correlated within cytotypes (diploids, n = 27: LBTBCPAP, r = -0.21 ns; CALW-PAP, r = -0.08 ns; CALW-LBTBC, r = -0.00 ns; tetraploids, n = 24: LBTBC-PAP, r = -0.25 ns;
CALW-PAP, r = -0.27 ns; CALW-LBTBC, r = 0.24 ns). Second, triploid individuals were not detected in the
mixed populations. Third, genetic distances between diploids and tetraploids were no smaller for sympatric than for allopatric populations.
In other studies of contact zones between different cytotypes, intermediate cytotypes were detected at low frequencies (Lumaret & Barrientos, 1990; Van Dijk et al., 1992; Bretagnolle & Thompson, 1995; Husband & Schemske, 1998; Burton & Husband, 1999). However, gene flow might still occur through fertilization of tetraploids by unreduced gametes from diploids (Lumaret & Hanotte, 1987; Lumaret & Barrientos, 1990 ; Bretagnolle & Thompson, 1995 ; Bretagnolle et al., 1998; Ramsey & Schemske, 1998; Petit et al., 1999).
The sharp difference in morphology and enzymatic markers between diploids and tetraploids in the Belgian Ardennes would seem to support their recognition as distinct taxa. Specifically, the distinctive morphological features of the diploids (deeply dissected involucral bracts, absence of ray florets and well developed pappus) match with the description of C. nigra. However, the congruence of morphological, chromosomic and allozymic variation found in the Belgian Ardennes contrasts with previous, larger-scale studies of variation in the C. jacea complex. At the scale of France, Gardou (1972) found no correspondence between morphology and cytotype and, based on controlled crosses, provided evidence for low overall levels of genetic divergence among members of the complex. At the scale of Europe, Sommer (1990) did not find distinct allozymic gene pools for diploids and tetraploids. She also found no consistent differentiation at allozyme loci for well characterized morphotypes that are often given taxonomic recognition within the complex (e.g. C. nigra, C. jacea sensu stricto). It thus appears that low overall genetic differentiation in the C. jacea complex do not prevent the build-up of well differentiated gene pools at the local scale. We suggest that partial incompatibility barriers between cytotypes
might explain such a discrepancy between variation patterns at small and large scales.
Occurrence of mixed populations
Whatever the mechanism maintaining the parapatric distribution of diploid and tetraploid knapweeds in the Belgian Ardennes (habitat differentiation or minority cytotype exclusion), the existence of mixed populations near the contact zone is intriguing. In mixed populations, as well as in allopatric populations near the contact zone, mechanisms preventing ineffectual intercytotype pollinations and formation of unfit triploid hybrids should evolve under natural selection (Levin, 1975; Lumaret, 1988; Thompson & Lumaret, 1992; Van Dijk & Bijlsma, 1994; Rodriguez, 1996; Petit et al., 1999). Accordingly, when different cytotypes co-exist sympatrically, they often show fine-scale niche differentiation, shift in flowering time, or increased selfing (e.g. Lumaret & Hanotte, 1987; Lumaret et al., 1987; Lumaret & Barrientos, 1990; Felber-Girard et al., 1996; Petit et al., 1997), but no such phenomenon was observed in knapweeds. The significant reduction of seed set and germination rate obtained for intercytotype controlled crosses (Gardou, 1972; O. J. Hardy, unpublished) suggest, however, that intercytotype pollination must hinder long-term co-existence of diploids and tetraploids. The difference in floral display between the two cytotypes of knapweeds (tetraploids and diploids with and without ray florets,
respectively) might conceivably allow assortative pollination (Petit et al., 1999). However, Sommer (1990) observed no such discrimination of floral morphs of C. jacea by Apis mellifera. Another explanation might be that when pollen from diploids and tetraploids are competing on a same stigma, the cytotype corresponding to the stigma is favoured, so that pollen transfers between cytotypes would have little effect on seed set of the maternal cytotype. Another hypothesis is that exclusion of one cytotype has not yet occurred, so that the populations are not in equilibrium. Specifically, population m2 is located in a former hay meadow which was recently ploughed and fertilized for Norway spruce plantation; it is likely that tetraploids were introduced there with tree saplings and have benefited from habitat disturbance at the time of planting.
Finally, several points need further investigation in order to achieve a better understanding of the origin and maintenance of the contact zone : the significance of ray florets to the reproductive isolation of the two cytotypes; the effect of pollen exchange between cytotypes on seed set; and the fate of triploid embryos when those are formed in diploid ×tetraploid crosses.
ACKNOWLEDGEMENTS
We are grateful to J. Lambinon and C. Moulin for drawing our attention to the existence of diploid populations of C. jacea in the Belgian Ardennes, to J. Saintenoy for helping us to localize several populations, to H. Carlier for carrying out flow cytometry analysis, to T. Pipar for drawing Fig. 1, and to W. Gruber for assistance with the soil analyses. We would also like to thank J. Thompson, A. L. Jacquemart, X. Vekemans and anonymous reviewers for their constructive comments on a previous draft of the manuscript. This project was supported by grant no. 2.4512.97 from the Belgian National Fund for Scientific Research (FNRS) where Olivier Hardy is a research assistant.
REFERENCES
Blaise S, Cartier D, Reynaud J. 1991. Evolution and differentiation of Lotus corniculatus/Lotus alpinus populations from French South-Western Alps. I. Morphologic and cyanogenic variations. Evolutionary Trends in Plants 5: 137-148.
Bretagnolle F, Felber F, Calame FG, Küpfer P. 1998. La polyploïdie chez les plantes. Botanica Helvetica 108: 5-37.
Bretagnolle F, Thompson JD. 1995. Gametes with the somatic chromosome number: mechanisms of their formation and role in the evolution of autopolyploid plants. New Phytologist 129: 1-22.
Bretagnolle F, Thompson JD. 1996. An experimental study of ecological differences in winter growth between sympatric diploid and autotetraploid Dactylis glomerata. Journal of Ecology 84: 343-351.
Briquet J. 1931. Composées Cynaroïdées. In: Burnat E, Briquet J, Cavillier F, eds. Flore des Alpes-Maritimes, vol. III. Geneva, Switzerland, Georg et Cie.
Brunsberg K. 1977. Biosystematics of the Lathyrus pratensis complex. Opera Botanica 42: 1-78.
Burton TL, Husband BC. 1999. Population cytotype structure in the polyploid Galax ureolata (Diapensiaceae). Heredity 82: 381-390. Demarly Y. 1963. Génétique des tétraploïdes et amélioration des plantes. Annales de l'Amélioration des Plantes 13: 307-400.
Dostal J. 1976. Centaurea L. In: Turin TG et al., eds. Flora Europaea. Cambridge, UK: Cambridge University Press, 254-301.
Duvigneaud J, Saintenoy-Simon J. 1997. Centaurea nigra. Sa description, son écologie, sa distribution dans nos régions. Adoxa 15/16: 29-31.
Ellenberg H. 1974. Zeigerwerte der Gefässpflanzen Mittel-europas. Scripta Geobotanica 9: 2-111.
Felber-Girard M, Felber F, Buttler A. 1996. Habitat differentiation in a narrow hybrid zone between diploid and tetraploid Anthoxanthum alpinum. New Phytologist 133: 531-540.
Galbraith DW, Harkins KR, Maddox JM, Ayres NM, Sharma DP, Firoozabadi E. 1983. Rapid flow cytometric analysis of the cell cycle in intact plant tissues. Science 220: 1049-1051.
Gardou C. 1972. Recherches biosystématiques sur la Section Jacea Cass. et quelques sections voïsïnes du genre Centaurea L. en France et dans les régions limitrophes. Feddes Repertorium 83: 311-472.
Gauthier P, Lumaret R, Bédécarrats A. 1998. Genetical variation and gene flow in Alpine diploid and tetraploid populations of Lotus [L. alpinus (DC.) Schleicher/L. corniculatus L.]. I. Insights from morphological and allozyme markers. Heredity 80: 683-693.
Guinochet M, de Vilmorin R. 1982. Flore de France. 4. Paris, France: Centre National de la Recherche Scientifique. Hillis DM, Moritz C, Mable BK. 1996. Molecular systematics. Sunderland, USA: Sinauer.
Husband BC, Schemske DW. 1998. Cytotype distribution at a diploid—tetraploid contact zone ίη Chamerion (Epilobium) angustifolium (Onagraceae). American Journal of Botany 85 : 1688-1694.
Kay QON. 1969. The origin and distribution of diploid and tetraploid Tripleurospermum inodorum (L.) Schultz Bip. Watsonia 7: 130-141. Lambinon J, De Langhe JE, Delvosalle L, Duvigneaud J. 1992. Nouvelle flore de la Belgique, du Grand-Duché de Luxembourg, du Nord de la France et des régions voisines (Ptéridophytes et Spermatophytes). Meise, Belgium: Jardin botanique national de Belgique. Levin DA. 1975. Minority cytotype exclusion in local plant populations. Taxon 24: 35-43.
Lumaret R. 1988. Adaptive strategies and ploidy levels. Oecologia Plantarum 9: 83-93.
Lumaret R, Barrientos E. 1990. Phylogenetic relationships and gene flow between sympatric diploid and tetraploid plants of Dactylis glomerata (Gramineae). Plant Systematics and Evolution 169: 81-96.
Lumaret R, Guillerm JL, Delay J, Ait Lhaj Loutfi A, Izco J, Jay M. 1987. Polyploidy and habitat differentiation in Dactylis glomerata L. from Galicia (Spain). Oecologia 73: 436-446.
Lumaret R, Hanotte C. 1987. Mise en évidence d'un écotype de dactyle (Dactylis glomerata L.) de pelouses dolomiriques subalpines dans les Grisons (Suisse): origine et échanges géniques avec les dactyles des prairies adjacentes. Oecologia Plantarum 8: 3-20.
Marsden-Jones EM, Turrill WB. 1952. British knapweeds. London, UK: Ray Society. Nei M. 1987. Molecular evolutionary genetics. New York, USA: Columbia University Press.
Petit C, Bretagnolle F, Felber F. 1999. Evolutionary consequences of diploid—polyploid hybrid zones in wild species. Trends in Ecology and Evolution 14: 306-311.
Petit C, Lesbros P, Ge X, Thompson JD. 1997. Variation in flowering phenology and outcrossing rate across a contact zone between diploid and tetraploid Arrhenatherum elatius. Heredity 79: 31-40.
Petit C, Thompson JD. 1997. Variation in phenotypic response to light availability between diploid and tetraploid populations of the perennial grass Arrhenatherum elatius from open and woodland sites. Journal of Ecology 85: 657-667.
Ramsey J, Schemske DW. 1998. Pathways, mechanisms, and rates of polyploid formation in flowering plants. Annual Review of Ecology and Systematics 29: 467-501.
Rodriguez DJ. 1996. A model for the establishment of polyploidy in plants. American Naturalist 147: 33-46.
Ronfort J, Jenczewski E, Bataillon T, Rousset F. 1998. Analysis of population structure in autotetraploid species. Genetics 150: 921-930. Rothera SL, Davy AJ. 1986. Polyploidy and habitat differentiation in Deschampsia cespitosa. New Phytologist 102: 449-467.
Segraves KA, Thompson JN, Soltis PS, Soltis DE. 1999. Multiple origins of polyploidy and the geographic structure of Heuchera grossulariifolia. Molecular Ecology 8: 253-262.
Sommer S. 1990. Isozymanalyse zur Ermittlung genetischer variabilität und mikroevolutiver prozesse bet Centaurea sect. Jacea (Asteraceae). PhD thesis, Universität Bayreuth, Bayreuth, Germany.
Stebbins GL, Zohary D. 1959. Cytogenetic and evolutionary studies in the genus Dactylis. University of California Publications in Botany 31: 1-40.
Thompson JD, Lumaret R. 1992. The evolutionary dynamics of polyploid plants : origins, establishment and persistence. Trends in Ecology and Evolution 7: 302-307.
Tyler B, Borrill M, Chorlton K. 1978. Studies in Festuca. X. Observations on germination and seedling cold tolerance in diploid Festuca pratensis and tetraploid F. pratensis var. apennina in relation to their alritudinal distribution. Journal of Applied Ecology 15: 219-226. Van Dijk P, Bakx-Schotman T. 1997. Chloroplast DNA phylogeography and cytotype geography in autopolyploid Plantago media. Molecular Ecology 6: 345-352.
Van Dijk P, Bijlsma R. 1994. Simulations of flowering time displacement between two cytotypes that form inviable hybrids. Heredity 72: 522-535.
Van Dijk P, Hartog M, Van Delden W. 1992. Single cytotype areas in autopolyploid Plantago media L. Biological Journal of the Linnean Society 46: 315-331.
Van Soest JL. 1947. Centaurea sectie Jacea en het voorkomen in Nederland. Nederlandsch Kruidkundig Archief 54: 68-106.
Weeda EJ, Westra R, Westra C, Westra T. 1991. Nederlandse oecologische flora. Wilde planten en hun relaties. Vol. 4. Hilversum, The Netherlands: IVN.


![Propriétés structurales et fonctionnelles du récepteur AT[indice inférieur 1] de l’angiotensine II](data:image/gif;base64,R0lGODlhAQABAIAAAP///wAAACH5BAEAAAAALAAAAAABAAEAAAICRAEAOw==)